Abstract
Purpose
To demonstrate high-speed, ultrahigh-resolution optical coherence tomography (OCT) for noninvasive, in vivo, three-dimensional imaging of the retina in rat and mouse models.
Methods
A high-speed, ultrahigh-resolution OCT system using spectral, or Fourier domain, detection has been developed for small animal retinal imaging. Imaging is performed with a contact lens and postobjective scanning. An axial image resolution of 2.8 μm is achieved with a spectrally broadband superluminescent diode light source with a bandwidth of ~150 nm at ~900-nm center wavelength. Imaging can be performed at 24,000 axial scans per second, which is ~100 times faster than previous ultrahigh-resolution OCT systems. High-definition and three-dimensional retinal imaging is performed in vivo in mouse and rat models.
Results
High-speed, ultrahigh-resolution OCT enabled high-definition, high transverse pixel density imaging of the murine retina and visualization of all major intraretinal layers. Raster scan protocols enabled three-dimensional volumetric imagingand comprehensive retinal segmentation algorithms allowed measurement of retinal layers. An OCT fundus image, akin to a fundus photograph was generated by axial summation of three-dimensional OCT data, thus enabling precise registration of OCT measurements to retinal fundus features.
Conclusions
High-speed, ultrahigh-resolution OCT enables imaging of retinal architectural morphology in small animal models. OCT fundus images allow precise registration of OCT images and repeated measurements with respect to retinal fundus features. Three-dimensional OCT imaging enables visualization and quantification of retinal structure, which promises to allow repeated, noninvasive measurements to track disease progression, thereby reducing the need for killing the animal for histology. This capability can accelerate basic research studies in rats and mice and their translation into clinical patient care.
Optical coherence tomography (OCT) can perform high-resolution, cross-sectional imaging of tissue morphology in situ and in real time. OCT measures the echo time delay and magnitude of backreflected or backscattered light using low-coherence interferometry. Cross-sectional images are generated by directing an optical beam onto the tissue and scanning it in the transverse direction, yielding a two-dimensional data set that can be displayed as a cross-sectional image.1 Full-field OCT has also been demonstrated in microscopy applications.2,3
OCT has emerged as a useful technique in ophthalmology for providing quantitative information about retinal microstructure. Cross-sectional studies of diseases including macular hole, glaucoma, age-related macular degeneration, macular edema, and diabetic retinopathy have been performed using OCT with standard 10- to 15-μm axial resolution.4–6 Ultrahigh-resolution OCT imaging with axial resolutions of 2 to 3 μm was recently demonstrated and shown to improve the visualization of intraretinal morphology.7,8 Studies have demonstrated that ultra-high-resolution OCT can provide additional information to that provided by standard-resolution OCT about subtle structural changes present in macular diseases and glaucoma.9–12 Recently, advances in OCT using spectral or Fourier domain detection have enabled dramatic increases in imaging speeds, achieving a ~25 to 50 times increase in speed over standard-resolution OCT systems and ~100 times over conventional ultrahigh-resolution OCT systems.13–18 These techniques are known as spectral, or Fourier domain, detection, because echo time delays of light are measured by Fourier-transforming the interference spectrum of the light signal.19,20
Research on ocular diseases is limited by the constraints on studying pathophysiologic processes in the human eye. Rat and mouse models of ocular disease provide powerful tools for analysis and characterization of disease pathogenesis and response to treatment. Although enucleation and histology are the gold standard for characterization of microstructural changes in the eye, noninvasive structural imaging has the potential to reduce the need for killing the animal for histology in many studies.
OCT imaging in rat and mouse models is challenging because of the small size and thin retina of the animal eye when compared with the human eye. Previously, conventional OCT with 17-μm resolution was used to monitor retinal degeneration in the mouse by measuring retinal thickness.21 OCT has also been compared to microanatomy in normal and rd chickens.22 Full-field OCT techniques have been demonstrated ex vivo on normal rat ocular tissues23 and in vivo on the normal rat anterior segment (Grieve KF et al. IOVS 2005;46:ARVO E-Abstract 2564).
In this study, we describe a prototype high-speed, ultra-high-resolution OCT instrument for performing in vivo imaging of the murine retina. OCT imaging was performed with a contact lens to remove corneal refraction, in combination with a postobjective scanning microscope design. A compact, multiplexed superluminescent diode light source with a bandwidth of ~ 150 nm centered near ~900 nm was used to achieve an axial resolution of 2.8 μm. OCT with spectral-Fourier domain detection enabled imaging speeds of 24,000 axial scans per second. OCT imaging protocols using high-definition, high transverse pixel- density imaging, as well as three-dimensional (3D-OCT) imaging with dense raster scanning, are demonstrated. Individual OCT images enable visualization of all major retinal layers including the photoreceptors. An OCT fundus image showing blood vessels and the optic nerve head may be generated by axially summing 3D-OCT data. Since the OCT fundus image is directly generated from 3D-OCT data, it enables precise registration of OCT images or measurements to fundus features. Segmentation algorithms enable thickness measurements of retinal layers.
Methods
A high-speed, ultrahigh-resolution OCT instrument was designed for imaging rat and mouse retinas, as shown in Figure 1A. Conventional clinical OCT instruments operate by relay-imaging the retina onto an external plane and scanning a focused OCT beam, such that the pivot point of the scanning is relay imaged onto the pupil.24 This design is not feasible for use in small animals, because the small size of the eye and short focal length necessitate an extremely short focal length objective lens design. In addition, the short focal length of the eye increases aberration, which degrades OCT signal and image quality. For this reason, imaging of the small animal eye was performed with a contact lens made from a flat microscope coverslip and hydroxypropyl methylcellulose (2.5% Goniosol; CibaVision, Duluth, GA). This effectively removes the refractive power of the air-corneal interface, leaving only the weaker refraction from the lens, thus enabling the incident OCT beam to be focused and scanned directly on the retina. This approach also has the advantage of removing aberrations from irregularities in the cornea while maintaining corneal hydration and clarity during imaging. The instrument for small-animal imaging used post-objective scanning with a long-working-distance microscope. The sample arm fiber in the OCT interferometer was collimated and refocused by a pair of long-working-distance, infrared (IR), chromatically compensated microscope objectives (M Plan NIR 5× and 10×; Mitutoyo, Paramus, NJ) with 2× magnification. This method yields a ~10-μm spot size in air. The output beam was scanned with a pair of galvanometer-actuated mirrors (6210H; Cambridge Technology, Cambridge, MA).
Figure 1.
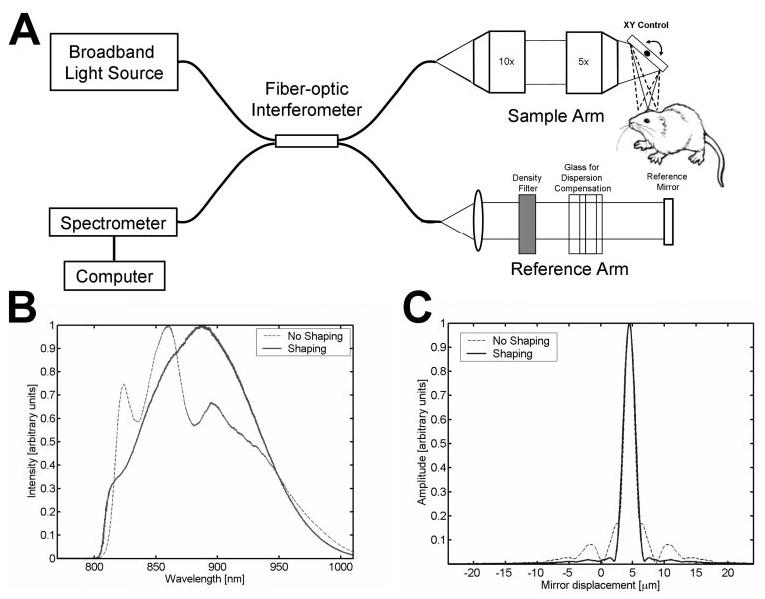
(A) Schematic of high-speed, ultrahigh-resolution OCT system for rat and mouse retinal imaging. Imaging is performed using contact lens and postobjective scanning. Spectral and Fourier domain detection are performed with a high-speed, high-resolution spectrometer. (B) Spectrum of the light source detected by the spectrometer, with and without numerical spectral shaping to smooth the spectrum. The compact, multiplexed superluminescent diode light source has BW = 145 nm at λc = 890 nm. (C) Axial PSF and without spectral shaping to reduce side lobes. The axial resolution is 2.8 μm in tissue.
To achieve ultrahigh-resolution OCT imaging, we used a multiplexed two-superluminescent-diode light source (Broadlighter; Superlum Diodes, Ltd., Moscow, Russia) with bandwidth (BW) = 145 nm and center wavelength λc = 890 nm. Water absorption in the vitreous at 950 nm limits the use of this wavelength range in human eyes. However, because the murine eye is much shorter than the human eye, absorption effects are negligible. This longer wavelength range is useful because broader bandwidth superluminescent diodes are more readily available at these wavelengths than at the standard 830-nm wavelengths used in clinical OCT instruments. Longer wavelength OCT systems at 1050 nm, operating on the other side of the 950-nm water absorption peak, have been shown to improve visualization of the choroid.25 The OCT imaging engine consisted of a 1200 lines/mm transmission grating and a 2048-pixel, 60-MHz, 12-bit line-scan camera.15 The interference spectrum was converted from wavelength to frequency and then fast Fourier transformed to obtain the axial scan data.
Because the multiplexed superluminescent diode light source has an irregularly shaped spectrum, as shown in Figure 1B, side lobes are present in the axial point-spread function (PSF), as shown in Figure 1C. Numerical postprocessing was used to correct the shape of the interference spectrum to approach a Gaussian,26 thereby reducing side-lobes in the PSF, as shown in Figures 1B and 1C. The axial resolution is 3.9 μm in air; corresponding to 2.8 μm in tissue. Dispersion imbalance between the sample and reference arms of the interferometer was compensated numerically by correcting the phase of the interference fringe pattern.13–15 The incident power at the cornea was 620 μW, and the measured system sensitivity was 95 dB. The imaging speed was 24,000 axial scans per second, with each axial scan consisting of 1024 axial pixels, and spanning an axial range of 1.3 mm in the retina.
Rats were anesthetized with pentobarbital sodium (40–50 mg/kg intraperitoneally [IP]) and mice were anesthetized with tribromoethanol (Avertin, 125–250 mg/kg IP). After anesthesia, eyes were dilated with tropicamide (1%) applied topically as drops. The animal was placed in a comfortable holder with its head in a mount to minimize eye and head motion. Hydroxypropyl methylcellulose (Goniosol, 2.5%) was used to preserve corneal hydration, and a thin coverslip contact lens was gently placed on the cornea. Histology was performed to obtain serial 7-μm-thick paraffin sections registered to the optic disc.27 These studies adhered to the ARVO Statement for the Use of Animals in Ophthalmic and Vision Research, and all imaging procedures were performed at Massachusetts Institute of Technology facilities with a protocol approved by the MIT Committee on Animal Care.
Two OCT scanning protocols were used. The first was a three-dimensional, dense raster scan that acquired 3D-OCT data consisting of 256 images with 512 axial scans each. This raster scan covered a 2.6 mm2 region of the retina; corresponding to transverse pixel spacing of 10 × 5 μm on the retina. An OCT fundus image was created by axial summation of the 3D-OCT data. This 3D-OCT data could also be used for quantitative measurements and mapping. The second protocol acquired 64 high-definition OCT images with 2048 axial scans each. Scanning was performed over a 2.6-mm2 region; corresponding to a transverse pixel spacing of 40 × 1.3 μm. The high-definition OCT images improve visualization of intraretinal layers and signal-to-noise ratio. Each scan protocol took 5.5 seconds. In some cases, vignetting of the OCT beam by the pupil limited the transverse scan range. The OCT fundus images, as well as individual OCT images, were used for alignment of the microscope during imaging. For alignment, lower pixel density scans can be performed to achieve rapid image display. A 100 × 100-pixel OCT fundus image can be generated at 2.4 frames per second. Care was taken to ensure that the incident OCT beam was perpendicular to the contact lens on the cornea at the center of the scan field.
The 3D-OCT data set was processed for visualization and rendering using a commercially available software package (Amira, ver. 4.0; Mercury Computer Systems, Inc., San Diego, CA). This software automatically aligns sequential OCT images and corrects for small axial displacements due to parasitic eye motion. To obtain quantitative information on retinal layer thickness, we segmented individual images from the 3D-OCT data set. The inner limiting membrane was detected with an adaptive threshold that was determined for each axial scan. The other intraretinal layers were detected by median filtering and edge detection performed on each axial scan. Integrity checks with adjacent axial scans were performed to detect segmentation errors, and segmentation boundaries were interpolated across regions below blood vessels, which cause signal dropouts. Registration of repeated measurements was performed by comparing OCT fundus images.
Results
The results of in vivo imaging in the normal young adult C57BL6 mouse and Long-Evans rat are shown in Figures 2 and 3, respectively. Figures 2A and 3A show OCT fundus images constructed by axial summation of 3D-OCT data. Fundus images show blood vessels, nerve fiber layer (NFL) striations, and the optic disc. Vignetting from the iris is evident in both OCT fundus images. The apparent horizontal irregularities in the mouse OCT fundus image in Figure 2A are artifacts due to residual transverse eye motion. Localized opacities in the vitreous, lens, or cornea can reduce the signal from the retina; corresponding to the darker areas in the OCT fundus images. Figures 2B–D and 3B–D show high-definition OCT images of the mouse and rat retinas. The images are displayed with an elongated axial dimension to show the thin retinal features more clearly. This display convention is also standard in clinical OCT imaging. The high-definition OCT images are precisely registered to the OCT fundus images (2A and 3A, respectively). Figures 2E and 3E show cropped enlargements of high-definition OCT images of the mouse and rat retinas. Each enlarged image has ~600 axial scans.
Figure 2.
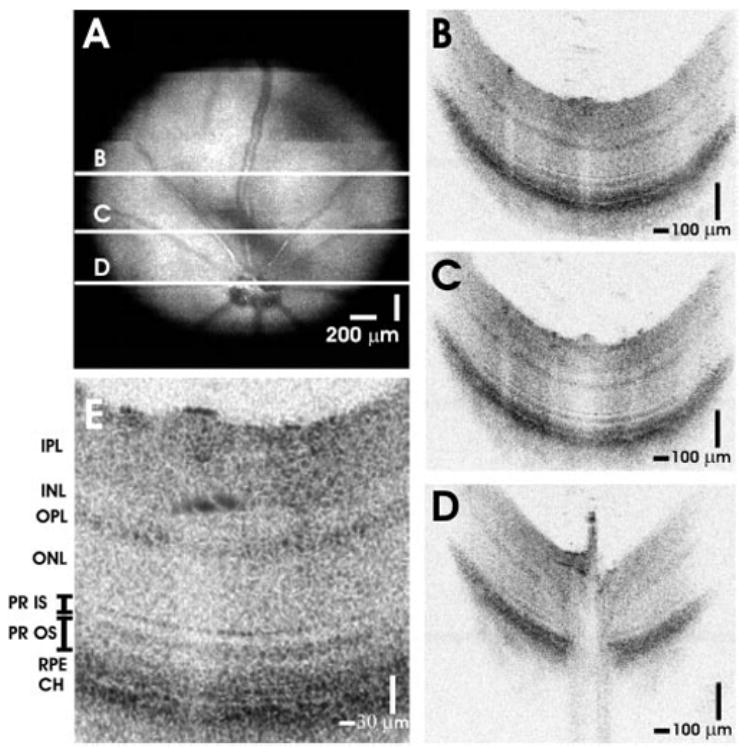
High-speed, ultrahigh-resolution OCT images from a normal C57BL6 mouse. (A) An OCT fundus image, created by axial summation of 3D-OCT data consisting of 256 images of 512 axial scans each, is shown. High-definition OCT images (B–D) with 2048 axial scans may be registered to the OCT fundus image. (E) Clear visualization of major intraretinal layers is enabled by OCT, as shown in the cropped, enlarged OCT image with ~600 axial scans.
Figure 3.
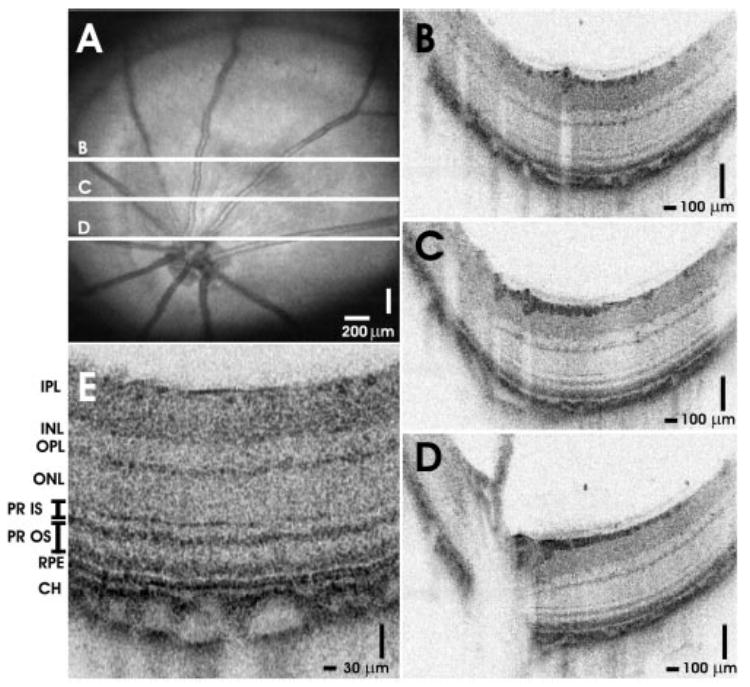
High-speed, ultrahigh-resolution OCT images from a normal Long-Evans rat. (A) An OCT fundus image. High-definition images (B–D) with 2048 axial scans are registered to the fundus image. (E) Intraretinal layers are visualized in the cropped, enlarged OCT image with ~600 axial scans.
Figure 4 shows a rendering of 3D-OCT data from the Long-Evans rat retina. The renderings enhance the NFL striations on the surface of the retina (Fig. 4A). Figure 4B shows that virtual slices can be created through the 3D data set, thus enabling the viewing of 3D-OCT data along arbitrary planes. Figure 4C shows a cut-away rendering near the optic nerve head. Renderings can be manipulated in real time to visualize structure.
Figure 4.
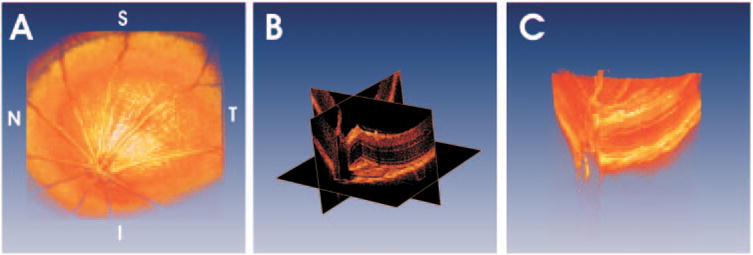
Using 3D-OCT data, visualization techniques such as volumetric rendering are possible. (A) A rendering of a normal Long-Evans rat retina. (B) It is possible to create virtual slices through 3D-OCT data and view images along arbitrary planes. Cut-away renderings can simultaneously show intraretinal structure and retinal topography (C).
Figure 5 shows the use of 3D-OCT for quantitative mapping of intraretinal layer thicknesses in the Long-Evans rat. Figure 5A is an OCT fundus image with a white arrow showing the location of the enlarged cross-sectional image in Figure 5B. Images are segmented as shown in Figure 5B. Figure 5C shows a map of retinal thickness, measured from the vitreoretinal interface to the photoreceptor inner and outer segment (IS–OS) junction, overlaid in color on the OCT fundus image. Figure 5D shows a map of NFL thickness. Thicknesses were computed by assuming a group refractive index of 1.4.
Figure 5.
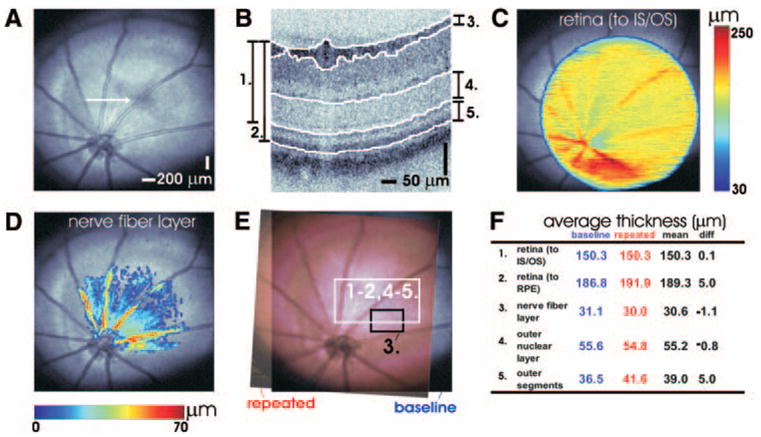
Using 3D-OCT data, quantitative mapping of intraretinal layers is possible. (A) A fundus image of the Long-Evans rat retina. (B) Cross-sectional OCT images from the 3D-OCT data set are segmented to identify boundaries between retinal layers. Retinal (C) and NFL (D) thicknesses are shown in pseudocolor on the fundus image. The OCT fundus image (E) can be used for registration of baseline (blue) and repeated (red) measurements. This example shows repeated measurements performed 9 days apart. (F) Measurements of retinal thickness (using two different conventions), NFL, ONL, and photoreceptor OS thickness. Rows 1 to 2 and 4 to 5 (F) correspond to the white rectangular region (E), whereas row 3 (F) corresponds to the black rectangular region (E).
Figures 5E and 5F show a simple comparison of quantitative measurements between two different imaging sessions on the same animal 9 days apart. Figure 5E illustrates the correlation of two OCT fundus images from different imaging sessions. The white square in Figure 5E shows a region of interest selected for comparing retinal, outer nuclear layer, (ONL) and photoreceptor OS thickness measurements. This region was chosen a priori, before quantitative comparisons were performed. NFL thickness was analyzed separately. To avoid artifacts caused by the blood vessels, the region indicated by the black square was chosen for this analysis. Figure 5F shows a table comparing repeated measurements.
Figure 6 shows a comparison of high-definition OCT images between a normal, young adult Sprague-Dawley (albino) rat and a normal, young adult Long-Evans (pigmented) rat. The inner retinal layers appeared similar in both strains. In the Long-Evans rat, the photoreceptors comprise two highly reflective and well-defined bands proximal to the RPE. In the Sprague-Dawley rat, the photoreceptors comprise two highly reflective bands separated by a region of moderate reflectivity. There is increased penetration of the OCT signal to the sclera in the Sprague-Dawley rat, which is consistent with the lack of absorption from pigment in this albino strain.
Figure 6.
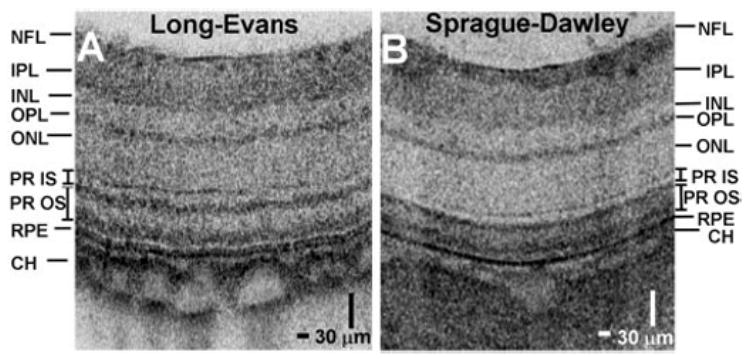
A comparison of cropped and enlarged OCT cross-sectional images (~600 axial scans) between normal, young-adult Sprague-Dawley (A) and Long-Evans (B) rats.
Figure 7 shows a comparison between histology and OCT images of a male, young adult Long-Evans rat retina (Figs. 7A, 7B, respectively). The purpose of this comparison was to identify retinal layers visualized in OCT. Comparison of dimensions is difficult because of histology processing artifacts. Representative histology is shown, which was obtained near the optic nerve head from a different sex- and age-matched animal. The OCT image is displayed with a 1:1 aspect ratio in the axial and transverse dimensions, in contrast to other OCT images that are displayed with an enlarged axial dimension. The axial scale is calculated by assuming an index of refraction of 1.4.
Figure 7.
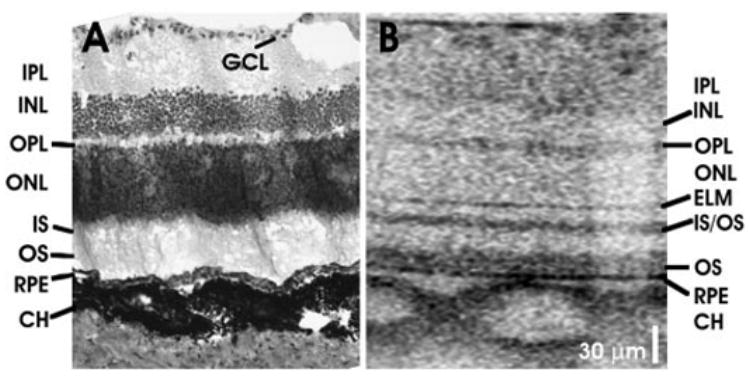
Comparisons between (A) representative histology and (B) OCT image in a young adult Long-Evans rat retina near the optic nerve head.
Discussion
Imaging in the mouse and rat eye has been challenging because of the small size, short focal length, and thin retina. The technique of using a contact lens and postobjective scanning simplifies the optical design, reduces aberrations, and provides a reasonably wide field of view for OCT scanning. High-speed, ultrahigh-resolution OCT using spectral-Fourier domain detection offers many advantages for imaging in the murine retina. The ultrahigh image resolution of 2.8 μm enables visualization of individual retinal layers. High-speed imaging enables acquisition of 3D-OCT data, as well as high-definition OCT images. The high imaging speed and the ability to display images in real time simplify alignment and eliminate the need for a simultaneous fundus view. Simultaneous microscope viewing of the murine retina is difficult because it requires illumination of the retina without stray reflection.
Similar to ultrahigh-resolution imaging in the human retina, imaging in the murine retina enables visualization of major intraretinal layers.9,10 The OCT images in the murine retina can be interpreted, based on a comparison with histology, ultra-high-resolution OCT imaging studies in human eyes, and the known optical properties of retinal layers. However, quantitative comparison of OCT images to histology is difficult because of histologic processing artifacts, such as nonlinear tissue shrinkage.28 Postmortem changes, such as retinal detachments, also make accurate measurement of photoreceptor features difficult. Because of these artifacts, OCT can provide a better measurement of dimensions than histology. At the same time, it is important to note that OCT measures optical time of flight, whereas measurement of physical dimension requires knowledge of the refractive index of different retinal layers. OCT images are typically displayed by assuming a constant refractive index.
The NFL is highly light-scattering and, based on its known structural variation across the fundus, it can be unambiguously interpreted in OCT images. The ganglion cell layer is not clearly visualized in the OCT images of the murine retina and, therefore, it is not labeled. Blood vessels cause shadowing in OCT images (Fig. 7B) due to absorption and scattering of the incident light beam by hemoglobin. The inner plexiform layer (IPL) and outer plexiform layer (OPL) are known to be highly light-scattering, whereas the inner nuclear layer (INL) and outer nuclear layer (ONL) are relatively low-scattering layers. Distal to the outer nuclear layer, a thin reflective band is seen, which probably corresponds to the external limiting membrane (ELM).
Similar to human retinal images, the photoreceptor-RPE complex comprises three reflective layers in the murine retina. A highly reflective band, posterior to the ELM, corresponds to the junction between the photoreceptor IS and OS. The abrupt transition from the IS ellipsoid to the OS may account for the high reflectance.29 The reflective band posterior to the photoreceptor IS–OS junction may be due to scattering from the OS tips in the region of interdigitation between the photoreceptor OS and the melanin-containing RPE cell processes that extend into the OS layer. This distinct, highly reflective band in the OS is consistent with earlier fundus reflectometry studies, which shows a directional reflectance component in the OS,30 and agrees with previous OCT studies in the porcine retina.29 The RPE is seen as a high-reflectivity region posterior to the OS; as the third band in the complex. This interpretation of the layers in the photoreceptor-RPE complex is consistent with recently published clinical OCT images,9,10 where serous fluid accumulation and macular holes elevate the two inner bands (labeled IS/OS and OS in Fig. 7B), but not the third outer band (labeled RPE in Fig. 7B). In the Sprague-Dawley rat retinal image (Fig. 6B) the highly reflective IS–OS junction is not well separated from the other reflective OS band, perhaps because of the early retinal degeneration in the young adult Sprague-Dawley rat.31
A distal region of high reflectivity corresponds to the choroid (CH). Prominent choroidal blood vessels appeared in the Long-Evans rat images (Fig. 6A). Whereas blood vessels typically exhibited shadowing, in the Long-Evans rat images, the region in the sclera posterior to blood vessels showed increased signal, as seen in Figures 3E, 6A, and 7B. This may be due to absorption by choroidal melanin in the intervening region between blood vessels. By comparison, in Sprague-Dawley rat images (Fig. 6B), the signal from the sclera was uniformly high. Deeper features may also be obscured by multiple scattering in the choroid and sclera.
It is important to note that OCT can be used to visualize changes in tissue optical scattering properties or refractive index discontinuities, but it cannot distinguish between tissues of similar optical properties. By comparison, histology visualizes tissue according to specific staining properties.32 Although OCT does not yet enable cellular-level resolution of the retina in vivo, it may be possible to track subtle morphologic changes in intraretinal structure that are altered in retinal disease.
3D-OCT has the potential to enable reproducible, noninvasive measurements of ocular tissue morphology. OCT fundus images generated from 3D-OCT data enabled registration of both OCT images (Figs. 2, 3) and thickness maps (Fig. 5) to fundus features. In these studies, a 2.6-mm2 region was imaged to obtain a wide-field fundus view. However, aberration and vignetting reduced off-axis image quality, so quantitative measurements of fine structures such as the photoreceptors were only possible in the central area of the field of view. Measurements of more prominent features such as retinal thickness (measured from the photoreceptor IS–OS junction) or NFL thickness are possible across a wider field of view. Measurement of different regions of the fundus can be obtained by adjusting instrument alignment. Higher-density scan patterns are also possible with longer image-acquisition times.
3D-OCT data sets are attractive for quantitative measurements because 3D-OCT fundus images enable registration of data sets acquired at different times (Fig. 5E). Preliminary investigation of measurement repeatability between two imaging sessions shows differences of 0.1, 0.8, and 1.1 μm, for retinal thickness (measured from the vitreoretinal interface to the photoreceptor IS–OS junction), ONL thickness, and NFL thickness, respectively. The convention of measuring retinal thickness using the reflection from the IS–OS junction is consistent with clinical instruments, such as the StratusOCT (Carl Zeiss Meditec, Dublin, CA). A difference of 5.0 μm is obtained for retinal thickness (measured from the vitreoretinal interface to the RPE) and photoreceptor OS thickness (measured from the photoreceptor IS–OS junction to the RPE). This decreased performance is probably due to poor detection of the anterior boundary of the RPE by our segmentation software and may improve with higher density data sets or software improvement. The repeatability study presented herein is preliminary and further studies are needed to demonstrate reproducibility.33 However, these preliminary results demonstrate the utility of 3D-OCT fundus images in registering data sets acquired across multiple imaging sessions and suggest that good reproducibility can be obtained for measurements of well-defined structural features.
OCT measurements of retinal layers in the human eye assume that the incident light beam is nearly normal to the retinal surface. However, due to the small size and high curvature of the murine eye, parallax effects from nonnormal incidence can be significant near the edges of the scan field. Geometrical correction of measurements can be made by using an assumed curvature of the eye, or measuring and correcting for retinal curvature in OCT images.
In conclusion, OCT has the potential to be an enabling tool for the study of ocular disease in animal models. This study demonstrates high-speed, ultrahigh-resolution imaging in the murine retina. Whereas standard excisional biopsy and histology require enucleating the eye, OCT can perform repeated, noninvasive in situ imaging and quantitative measurements of the rodent retina. Thus, OCT can be used to monitor retinal disease progression and response to therapy in the same animal over time and may reduce the need to kill animals. OCT also may enable in vivo quantitative measurements of the intact retina and, therefore, avoid histologic processing artifacts. These features suggest that OCT can become a valuable tool for the study of animal models of retinal disease.
Acknowledgments
The authors thank Wolfgang Drexler for contributions in the early phases of this study.
Supported by National Eye Institute Grants R01-EY11289-20, R01-EY12008-04, and R01-EY13178-06; National Science Foundation Grant BES-0522845 (VJS); Air Force Office of Scientific Research, Medical Free Electron Laser Program Contract FA9550-040-1-0046; Massachusetts Lions Eye Research Fund; unrestricted grants from Research to Prevent Blindness; and the Whitaker Foundation (THK).
Footnotes
Presented at the annual meeting of the Association for Research in Vision and Ophthalmology, Fort Lauderdale, Florida, May, 2005; and the SPIE BIOS Biomedical Optics conference in San Jose, CA, January 2006.
Disclosure: V.J. Srinivasan, None; T.H. Ko, None; M. Wojtkowski, None; M. Carvalho, None; A. Clermont, None; S.-E. Bursell, None; Q.H. Song, None; J. Lem, None; J.S. Duker, None; J.S. Schuman, Carl Zeiss Meditec (R); J.G. Fujimoto, Carl Zeiss Meditec (R)
References
- 1.Huang D, Swanson EA, Lin CP, et al. Optical coherence tomography. Science. 1991;254:1178–1181. doi: 10.1126/science.1957169. [DOI] [PMC free article] [PubMed] [Google Scholar]
- 2.Beaurepaire E, Boccara AC, Lebec M, Blanchot L, Saint-James H. Full-field optical coherence microscopy. Opt Lett. 1998;23:244–246. doi: 10.1364/ol.23.000244. [DOI] [PubMed] [Google Scholar]
- 3.Dubois A, Moneron G, Grieve K, Boccara AC. Three-dimensional cellular-level imaging using full-field optical coherence tomography. Phys Med Biol. 2004;49:1227–1234. doi: 10.1088/0031-9155/49/7/010. [DOI] [PubMed] [Google Scholar]
- 4.Hee MR, Izatt JA, Swanson EA, et al. Optical coherence tomography of the human retina. Arch Ophthalmol. 1995;113:325–332. doi: 10.1001/archopht.1995.01100030081025. [DOI] [PubMed] [Google Scholar]
- 5.Puliafito CA, Hee MR, Lin CP, et al. Imaging of macular diseases with optical coherence tomography. Ophthalmology. 1995;102:217–229. doi: 10.1016/s0161-6420(95)31032-9. [DOI] [PubMed] [Google Scholar]
- 6.Schuman JS, Puliafito CA, Fujimoto JG. Optical Coherence Tomography of Ocular Diseases. 2. Thorofare, NJ: Slack Inc; 2004. [Google Scholar]
- 7.Drexler W, Morgner U, Ghanta RK, Kartner FX, Schuman JS, Fujimoto JG. In vivo ultrahigh-resolution optical coherence tomography. Opt Lett. 1999;24:1221–1223. doi: 10.1364/ol.24.001221. [DOI] [PubMed] [Google Scholar]
- 8.Drexler W, Morgner U, Ghanta RK, Kartner FX, Schuman JS, Fujimoto JG. Ultrahigh-resolution ophthalmic optical coherence tomography. Nat Med. 2001;7:502–507. doi: 10.1038/86589. [DOI] [PMC free article] [PubMed] [Google Scholar]
- 9.Drexler W, Sattmann H, Hermann B, et al. Enhanced visualization of macular pathology with the use of ultrahigh-resolution optical coherence tomography. Arch Ophthalmol. 2003;121:695–706. doi: 10.1001/archopht.121.5.695. [DOI] [PubMed] [Google Scholar]
- 10.Ko TH, Fujimoto JG, Ducker JS, et al. Comparison of ultrahigh- and standard-resolution optical coherence tomography for imaging macular hole pathology and repair. Ophthalmology. 2004;111:2033–2043. doi: 10.1016/j.ophtha.2004.05.021. [DOI] [PMC free article] [PubMed] [Google Scholar]
- 11.Wollstein G, Paunescu LA, Ko TH, et al. Ultrahigh-resolution optical coherence tomography in glaucoma. Ophthalmology. 2005;112:229–237. doi: 10.1016/j.ophtha.2004.08.021. [DOI] [PMC free article] [PubMed] [Google Scholar]
- 12.Ergun E, Hermann B, Wirtitsch M, et al. Assessment of central visual function in Stargardt’s disease/fundus flavimaculatus with ultrahigh-resolution optical coherence tomography. Invest Ophthalmol Vis Sci. 2005;46:310–316. doi: 10.1167/iovs.04-0212. [DOI] [PubMed] [Google Scholar]
- 13.Cense B, Nassif N, Chen T, et al. Ultrahigh-resolution high-speed retinal imaging using spectral-domain optical coherence tomography. Opt Express. 2004;12:2435–2447. doi: 10.1364/opex.12.002435. [DOI] [PubMed] [Google Scholar]
- 14.Leitgeb RA, Drexler W, Unterhuber A, et al. Ultrahigh resolution Fourier domain optical coherence tomography. Opt Express. 2004;12:2156–2165. doi: 10.1364/opex.12.002156. [DOI] [PubMed] [Google Scholar]
- 15.Wojtkowski M, Srinivasan V, Ko T, Fujimoto J, Kowalczyk A, Duker J. Ultrahigh resolution, high speed, Fourier domain optical coherence tomography and methods for dispersion compensation. Opt Express. 2004;12:2404–2422. doi: 10.1364/opex.12.002404. [DOI] [PubMed] [Google Scholar]
- 16.Wojtkowski M, Bajraszewski T, Gorczynska I, et al. Ophthalmic imaging by spectral optical coherence tomography. Am J Ophthalmol. 2004;138:412–419. doi: 10.1016/j.ajo.2004.04.049. [DOI] [PubMed] [Google Scholar]
- 17.Wojtkowski M, Srinivasan V, Fujimoto JG, et al. Three-dimensional retinal imaging with high-speed ultrahigh-resolution optical coherence tomography. Ophthalmology. 2005;112:1734–1746. doi: 10.1016/j.ophtha.2005.05.023. [DOI] [PMC free article] [PubMed] [Google Scholar]
- 18.Schmidt-Erfurth U, Leitgeb RA, Michels S, et al. Three-dimensional ultrahigh-resolution optical coherence tomography of macular diseases. Invest Ophthalmol Vis Sci. 2005;46:3393–3402. doi: 10.1167/iovs.05-0370. [DOI] [PubMed] [Google Scholar]
- 19.Fercher AF, Hitzenberger CK, Kamp G, Elzaiat SY. Measurement of intraocular distances by backscattering spectral interferometry. Opt Commun. 1995;117:43–48. [Google Scholar]
- 20.Hausler G, Linduer MW. “Coherence radar” and “spectral radar”-new tools for dermatological diagnosis. J Biomed Opt. 1998;3:21–31. doi: 10.1117/1.429899. [DOI] [PubMed] [Google Scholar]
- 21.Li Q, Timmers AM, Hunter K. Noninvasive imaging by optical coherence tomography to monitor retinal degeneration in the mouse. Invest Ophthalmol Vis Sci. 2001;42:2981–2989. [PubMed] [Google Scholar]
- 22.Huang Y, Cideciyan AV, Papastergiou GI. Relation of optical coherence tomography to microanatomy in normal and rd chickens. Invest Ophthalmol Vis Sci. 1998;39:2405–24l6. [PubMed] [Google Scholar]
- 23.Grieve K, Paques M, Dubois A, Sahel J, Boccara C, Gargasson J-F. Ocular tissue imaging using ultrahigh-resolution, full-field optical coherence tomography. Invest Ophthalmol Vis Sci. 2004;45:4126–4131. doi: 10.1167/iovs.04-0584. [DOI] [PubMed] [Google Scholar]
- 24.Swanson EA, Izatt JA, Hee MR, et al. In vivo retinal imaging by optical coherence tomography. Opt Lett. 1993;18:1864–1866. doi: 10.1364/ol.18.001864. [DOI] [PubMed] [Google Scholar]
- 25.Unterhuber A, Považay B, Hermann B, Sattmann H, Chavez-Pirson A, Drexler W. In vivo retinal optical coherence tomography at 1040 nm-enhanced penetration into the choroid. Opt Express. 2005;13:3252–3258. doi: 10.1364/opex.13.003252. [DOI] [PubMed] [Google Scholar]
- 26.Tripathi R, Nassif N, Nelson JS, Park BH, de Boer JF. Spectral shaping for non-Gaussian source spectra in optical coherence tomography. Opt Lett. 2002;27:406–408. doi: 10.1364/ol.27.000406. [DOI] [PubMed] [Google Scholar]
- 27.Smith RS. Systematic Evaluation of the Mouse Eye: Anatomy, Pathology, and Biomethods. Boca Raton, FL: CRC Press LLC; 2002. [Google Scholar]
- 28.Anger EM, Unterhuber A, Hermann B, et al. Ultrahigh resolution optical coherence tomography of the monkey fovea: identification of retinal sublayers by correlation with semithin histology sections. Exp Eye Res. 2004;78:1117–1125. doi: 10.1016/j.exer.2004.01.011. [DOI] [PubMed] [Google Scholar]
- 29.Gloesmann M, Hermann B, Schubert C, Sattmann H, Ahnelt PK, Drexler W. Histologic correlation of pig retina radial stratification with ultrahigh-resolution optical coherence tomography. Invest Ophthalmol Vis Sci. 2003;44:1696–3. doi: 10.1167/iovs.02-0654. [DOI] [PubMed] [Google Scholar]
- 30.van de Kraats J, Berendschot TT, van Norren D. The pathways of light measured in funds reflectometry. Vision Res. 1996;36:2229–2247. doi: 10.1016/0042-6989(96)00001-6. [DOI] [PubMed] [Google Scholar]
- 31.Lin WL, Essner E. An electron microscopic study of retinal degeneration in Sprague-Dawley rats. Lab Anim Sci. 1987;37:180–186. [PubMed] [Google Scholar]
- 32.Toth CA, Naravan DG, Boppart SA, et al. A comparison of retinal morphology viewed by optical coherence tomography and by light microscopy. Arch Ophthalmol. 1997;115:1425–1428. doi: 10.1001/archopht.1997.01100160595012. [DOI] [PubMed] [Google Scholar]
- 33.Paunescu LA, Schuman JS, Price LL. Reproducibility of nerve fiber thickness, macular thickness, and optic nerve head measurements using StratusOCT. Invest Ophthalmol Vis Sci. 2004;45:1716–1724. doi: 10.1167/iovs.03-0514. [DOI] [PMC free article] [PubMed] [Google Scholar]


