

Abstract
Several findings link proteinase 3 (PR3) to small vessel vasculitis. Besides being a major target of anti-neutrophil cytoplasm antibodies (ANCA), previous findings have shown increased circulating levels of PR3 in vasculitis patients, increased levels of neutrophil membrane-PR3 (mPR3) expression and a skewed distribution of the −564 A/G polymorphism in the promotor region of the PR3 gene. In this study we elucidate how these three findings relate to each other. The plasma concentration of PR3 was measured by enzyme-linked immunosorbent assay (ELISA), mPR3 expression by fluorescence activated cell sorter (FACS) and the gene polymorphism by real-time polymerase chain reaction (PCR). We compared results from 63 patients with ANCA-associated systemic vasculitis (AASV) with 107 healthy blood donors. In accordance with previous reports, AASV patients had increased plasma concentrations of PR3 compared to healthy controls (mean 224 µg/l versus 155 µg/l, P < 0·0001). They also showed an increased number of mPR3-positive neutrophils (60%versus 42%, P < 0·001). However, contrary to a previous report, we found no skewed distribution of the polymorphism in PR3 gene. There was a weak correlation between mPR3 mean fluorescence intensity (MFI) and plasma PR3 among healthy controls and myeloperoxidase–ANCA (MPO–ANCA)-positive patients (r = 0·24, P = 0·015 and r = 0·52, P = 0·011, respectively). In conclusion, increased plasma PR3 and high expression of mPR3 are associated with small vessel vasculitis, but neither of them is a consequence of the −564 A/G polymorphism of the PR3 gene promotor.
Introduction
The most common forms of small vessel vasculitis are Wegener’s granulomatosis (WG) and microscopic polyangiitis (MPA), and these diseases are associated strongly with anti-neutrophil cytoplasm antibodies (ANCA). The main target of ANCA in WG is proteinase 3 (PR3). PR3 is an intracellular serine protease produced during the development of neutrophils and monocytes. It was described originally as an enzyme which degrades elastin and belongs to the family of neutrophil serine proteases [1–4].
Intriguingly, there are also several observations linking PR3 to ANCA-associated systemic vasculitis (AASV); (i) AASV patients have increased levels of circulating PR3 in the plasma [5]; (ii) the proportion of neutrophils expressing PR3 on their plasma membrane is increased among AASV patients [6]; (iii) circulating leucocytes from patients with AASV display up-regulated transcription of the PR3 gene [7,8]; (iv) deficiency of alpha1-antitrypsin, the main inhibitor of PR3, seems to predispose for PR3–AASV [9,10]; and (v) a single nucleotide polymorphism in the promotor region of the PR3 gene have been found to be associated with WG [11].
Increased circulating levels of PR3 was first described by Henshaw et al. [12] and was later explored in our group by Baslund et al. [13] and in more detail by Ohlsson and coworkers [5]. It was shown that AASV patients had significantly higher levels of plasma PR3 compared to healthy blood donors as well as disease controls; this difference was independent of disease activity or ANCA type. The high plasma PR3 levels could not be explained by increased general inflammatory activity or decreased renal function and could not be connected to neutrophil degranulation [5].
In addition to azurophilic granules, PR3 is localized in specific granules and secretory vesicles [14]. It has also been found on the membrane of resting neutrophils [15]. Intriguingly, PR3 can be detected on the membrane of either the total neutrophil population or on a subset of neutrophils (bimodal expression) [16]. The proportion of mPR3-positive (mPR3+) neutrophils varies between individuals, but is highly stable over prolonged periods of time in a given individual, suggesting a genetic background for this phenomenon [16]. This suggestion was reinforced by observations in two families and twin studies [6,17].
Witko-Sarsat et al. reported that the vasculitis patients were skewed toward the mPR3high phenotype. Considering the stability over time and the absence of relation to disease activity, they proposed the mPR3high phenotype to be a genetic risk factor for vasculitis [6]. In contrast to these findings, Harper et al. reported that the proportion of mPR3+ neutrophils is higher in patients with acute vasculitis and sepsis and lower in patients with vasculitis in remission and healthy controls [18]. Results in the same direction were presented by Muller Kobold et al., who observed that the total level of mPR3 expression on neutrophils, measured as an expression index, was increased during active WG, while during remission the values decrease to levels comparable to those of healthy controls [19]. Supporting the French results, Rarok et al. showed that the mPR3+ proportion indeed is a stable feature in a given individual but, on the other hand, they reported that the total level of mPR3 expression is significantly associated with the incidence and rate of relapse in WG [20]. Taken together, mPR3 seems to be associated with AASV, although the mechanisms underlying this association have not yet been completely elucidated.
Studies by Gencik et al. revealed 10 polymorphisms in the PR3 gene but only one of them was found to be associated with WG. This was a single nucleotide polymorphism (SNP) in the promotor region of the PR3 gene (− 564 A/G). Allele frequency revealed a strong preponderance for the G allele in WG patients (49·2%) compared with the control group (34·4%, P < 0·01, odds ratio = 0·5) [11]. The −564 G allele of this polymorphism results in a GC-box element, which is the potential binding site for the transcription factor SP1 that could result in increased transcription of the gene and subsequently increased expression of the protein. Recent in vitro experiments did not exhibit any differences in promotor activity between G and A allele-containing reporter constructs [21].
In this study, we have investigated whether the level of mPR3 on isolated neutrophils and the level of PR3 in the plasma have a common origin and if that is the described polymorphism in the promotor region of the PR3 gene. This has been conducted by measuring the mPR3, plasma PR3 levels and ANCA in the same sample and correlating these parameters to the genotype as well as to each other.
Materials and methods
Patients
Patients with systemic vasculitis were recruited from the departments of nephrology at Lund University Hospital and Malmö University Hospital. The distinction between WG and MPA was made according to Chapel Hill Consensus Conference nomenclature [22]. Samples for DNA analysis were collected between 1996 and 2004, while all samples for surface expression and plasma concentrations were drawn during 2004. Most patients were in stable remission at the time of sampling. Healthy blood donors from the Blood Center Skåne were included as a control group. The study was approved by the local ethical committee at the Faculty of Medicine, Lund University and informed consent was obtained from all subjects participated in the study.
Blood sampling and separation
Approximately 6 ml of peripheral blood was collected from each patient or donor in ethylenediamine tetraacetic acid (EDTA)-anti-coagulated tubes and then leucocytes were freshly isolated from whole blood by centrifugation on Polymorphprep™ according to the manufacturer’s instructions (Axis-Shield, Oslo, Norway). After centrifugation, two bands were formed; the upper band contains mononuclear cells and the lower band contains polymorphonuclear cells. The contaminating red blood cells among polymorphonuclear bands were lysed using 0·83% NH4 Cl 10 mm Hepes pH 7·0 for 7 min at 37°C. The plasma layer, on top of the mononuclear band, was used to measure PR3 level in the plasma and ANCA level. The mononuclear band was used to extract DNA for studies on the PR3 gene and the polymorphonuclear band was used to study membrane PR3.
DNA isolation
DNA was extracted as described by Miller et al. [23]. The DNA was quantified by spectrophotometer; the 260/280 ratios were consistently 1·8–2·0.
Gene typing
The SNP-specific polymerase chain reaction (PCR) primers and fluorogenic probes were designed using Primer Express (version 1·5; Applied Biosystems, Foster City, CA, USA) following Applied Biosystems’ guidelines as the following; −564-forward primer: 5′-GGCCTCCACCCACTCCAT-3′, −564-reverse primer: 5′-AGGATTCTCAATCAAGAGGTGA TTCT-3′. The fluorogenic probes were labelled with a reporter dye (either FAM or VIC) and are specific for one of the two possible bases (− 564 G or A) in the PR3 promoter region; −564 A-Taqman probe: FAM- AGACCTCACCC AGGGT-MGB, −564G-Taqman probe: VIC- ACCTCGCCC AGGGT-MGB. A MGB quencher probe was utilized on the 3′ end by a linker arm. TaqMan Universal PCR Master Mix (Applied Biosystems) was used to prepare the PCR. Primers, probes and genomic DNA were added to the final concentrations of 300 nM, 100 nM and 0·5–2·5 ng/µl, respectively. Controls (no DNA template) and reference control DNA were run in each 96-well plate to ensure that there was no amplification of contaminating DNA and that signals from both probes was achieved. All PCR reactions were made in triplicate (25 µl per reaction) in optical 96-well plates using the ABI Prism 7000 Sequence Detection System (Applied Biosystems) with two initial hold steps (50°C for 2 min, followed by 95°C for 10 min) and 40 cycles of a two-step PCR (95°C for 15 s, 60°C for 1 min). The −564 nucleotide was determined by the fluorescence ratio of the two SNP-specific fluorogenic probes.
Determination of surface PR3 expression by fluorescence activated cell sorter (FACS) analysis
Membrane PR3 expression on neutrophils was measured using flow cytometry as described previously [6]. In brief, isolated cells were treated with 0·5 mg/ml heat-aggregated rabbit immunoglobulin (IgG; Sigma, St Louis, MO, USA) for 30 min. After washing, cells were incubated with murine monoclonal anti-human PR3 antibodies (4A5; Wieslab, Lund, Sweden) or with an isotype-matched murine control antibody (IgG1; Sigma Biosciences) for 30 min followed by a 30-min incubation with fluorescein isothiocyanate (FITC)-conjugated (Fab′)2 fragments of rabbit anti-mouse antibodies (Dako Cytomation, Glostrup, Denmark). Labelled neutrophils were fixed with 1% paraformaldehyde for 10 min.
Fluorescence was analysed on an EPICS XL-MCL flow cytometer (Beckman Coulter Inc., Miami, FL, USA), and fluorescence intensity was standardized using Flow-Set Fluorospheres (Beckman Coulter Inc., Fullerton, CA, USA). The cytometer can show the percentage of mPR3+ neutrophils as well as mean fluorescence intensity (MFI).
The expression index of mPR3 was calculated as described previously by Rarok et al. the MFI was corrected for the non-specific binding (NSB) of an isotype-matched irrelevant antibody and multiplied by the percentage of mPR3+ neutrophils; expression index = (MFI–NSB) × % mPR3+ neutrophils, and expressed in arbitrary units (AU) [20]. The individuals were divided into three mPR3 phenotypes, as described previously by Witko-Sarsat et al. according to their percentage of mPR3+ neutrophils corresponding, respectively, to 0–20% of mPR3+ neutrophils (mPR3low phenotype), 21–58% of mPR3+ neutrophils (mPR3intermediate phenotype) and 59–100% of mPR3+ neutrophils (mPR3high phenotype) [6].
Enzyme-linked immunosorbent assays (ELISAs) of plasma PR3 and ANCA
Plasma PR3 level was detected as described previously [5]. Briefly, a microtitre plate was coated overnight with a purified mixture of two monoclonal PR3 antibodies (4A3 and 4A5, 3 µg/ml each). Plasma samples diluted to 1/20 and 1/40 in sample buffer were added and the plates were incubated for 2 h. After washing, bound PR3 was detected by incubation for 2 h with affinity-purified rabbit anti-PR3 diluted to 1/300 in sample buffer. Washing was followed by the addition of the conjugate (alkaline phosphatase-labelled swine anti-rabbit IgG from Dako Cytomation), diluted to 1/1000 in sample buffer and then incubated for 1 h. ANCA was detected by standard direct ELISA using the Wielisa® PR3–ANCA kit.
Statistical analyses
Differences in continuous variables between two groups were analysed using the Mann–Whitney U-test; some data sets that did not follow Gaussian distribution were transformed and then analysed by unpaired t-test. For data sets that follow Gaussian distribution, a t-test was used and results are given as mean ±standard deviation (s.d.). All other results are given as median, interquartile range (IQR).
One-way anova with Bonferroni’s post-test was used for comparisons between more than two groups. Correlations were analysed using Pearson’s rank test. Proportions between groups were compared with the χ2 test. A two-sided P < 0·05 was considered to be statistically significant.
Results
Genotype
DNA purified from peripheral blood of 189 blood donors and 132 patients with AASV (76 with WG and 56 with MPA) was subjected to genotyping using allelic discrimination-real time PCR. No significant differences were seen between any group of patients regarding gene or allele frequencies. Figure 1 shows the gene frequencies of patients and controls of the −564 A/G polymorphism in the promotor region of the PR3 gene. The allele frequencies in the patients were 36% for the A allele and 64% for the G allele compared to 31% and 69% for healthy controls. When limiting the analysis to patients with a clinical diagnosis of WG, we found an allele frequency of 40% for the A allele and 60% for the G allele; the corresponding figures for MPA patients were 30% and 70%. Thus, we could not verify the previous findings of an increased frequency of the G allele among WG patients.
Fig. 1.
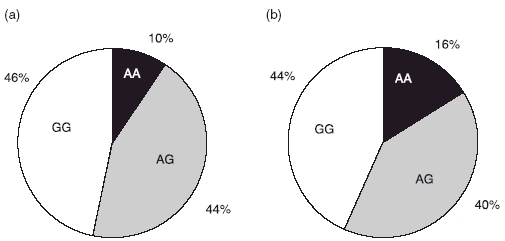
Distribution of the −564 A/G polymorphism in the promotor region of the proteinase 3 gene. Black colour represents individuals homozygous for the A allele, white colour represents individuals homozygous for the G allele and grey colour represents heterozygotes. The results of 189 healthy blood donors are shown in (a) and 136 anti-neutrophil cytoplasm antibodies-associated systemic vasculitis patients are shown in (b).
Membrane PR3
Flow cytometry analysis of mPR3 on isolated neutrophils was performed on 107 healthy blood donors and 58 patients with AASV. Thirty-one of these patients were men and 27 were women. Their mean age (at sampling) was 63·2 ± 16·4 years ranging from 17·8 to 86·5 years. A clinical diagnosis of WG was made for 35 patients (31 were PR3–ANCA-positive, three MPO–ANCA-positive and one ANCA-negative) and 23 patients were diagnosed as having MPA (20 MPO–ANCA-positive, three PR3–ANCA-positive). In total, 34 patients were PR3–ANCA-positive, 23 patients were MPO–ANCA-positive at diagnosis and one patient never exhibited any positive ANCA test.
The percentage of mPR3+ neutrophils as shown in Fig. 2a was significantly higher in vasculitis patients (60 ± 27%) compared to healthy blood donors (42 ± 22; P < 0·0001). This difference was independent of diagnosis as the MPA group had 62 ± 24% PR3+ cells and the WG group had 58 ± 29% (P = 0·0002 and P = 0·0007, respectively). Similar results were observed when the patients were divided according to ANCA serology.
Fig. 2.
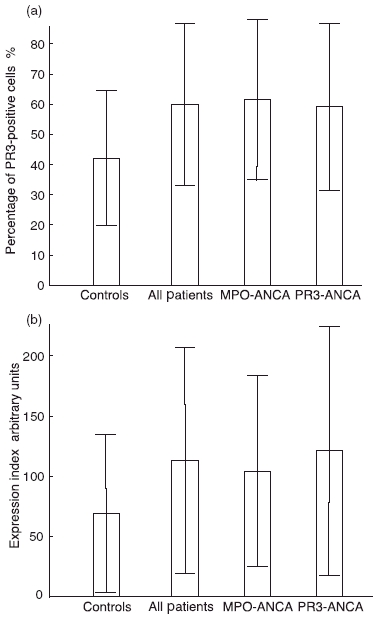
Membrane expression of proteinase 3 (PR3) on neutrophils. Neutrophils stained with anti-PR3 murine monoclonal antibodies and followed by fluorescein isothiocyanate-conjugated anti-mouse antibodies were analysed by flow cytometry. (a) Shows the percentage of membrane-PR3+ neutrophils in 107 healthy blood donors, 58 patients with anti-neutrophil cytoplasm antibodies (ANCA)-associated systemic vasculitis (AASV) and two subsets of the same patients (23 having myeloperoxidase–ANCA and 34 having PR3–ANCA). (b) Shows the expression index of mPR3 on neutrophils measured by arbitrary units (AU) for the same groups as in (a). All results are given as mean values ± s.d.
When the patients were divided into the three predefined mPR3 phenotypes [6], the distribution of the vasculitis patients were skewed toward the mPR3high phenotype, as shown in Fig. 3. This stands in contrast to the control group that exhibited an equal distribution between the high and low phenotype groups (27% high, 50% intermediate, and 23% low). This difference between the two distributions was significant (χ2 = 13·47, P = 0·0012).
Fig. 3.
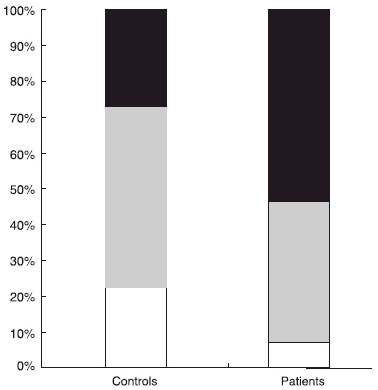
Phenotype distribution of membrane-proteinase 3 (mPR3) on neutrophils. Individuals divided into three predefined groups, high (black)/intermediate (grey)/low (white), according to their percentage of mPR3+ neutrophils [6]. The distribution of these three groups is shown in 58 patients with anti-neutrophil cytoplasm antibodies-associated systemic vasculitis compared to 107 healthy blood donors.
Also when comparing the MFI of mPR3, we found higher values for the vasculitis patients (median 1·43, IQR 1·03–2·12) compared to healthy blood donors (1·19, 0·915–1·58). However, the differences were relatively small and only statistically significant, according to the Mann–Whitney U-test, when comparing all patients or the PR3–ANCA-positive subgroup with the controls (P = 0·04 and 0·03, respectively).
Consequently, when comparing the expression index (EI) of mPR3, we found higher values for the AASV patients (median 89·3, IQR 43·6–163 units) compared to the group of controls (53·1, 25·2–87·8 units, P = 0·001, Fig. 2b). The median expression index was significantly higher for all subgroups compared to healthy blood donors. There were no significant differences between the subgroups, either based on diagnosis or on serology.
Plasma PR3 and ANCA
Plasma PR3 was significantly elevated in the patients (mean ± s.d. 224 ± 128 µg/l, n = 63) compared to healthy blood donors (155 ± 52 µg/l, n = 130) (unpaired t-test, P < 0·0001). When dividing the AASV patients based on their clinical diagnosis, we found that the MPA patients had significantly higher PR3 concentrations (256 ± 162 µg/l, n = 26) than healthy blood donors (P < 0·0001). Similarly, but to a lesser extent, WG patients had higher PR3 concentrations (202 ± 95 µg/l, n = 37) compared to healthy blood donors (P = 0·0029), as shown in Fig. 4. Similar results were found when we divided the AASV patients into two subgroups based on their ANCA serology.
Fig. 4.
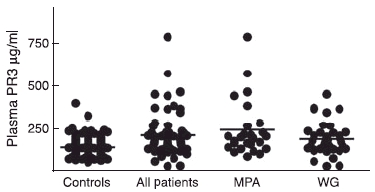
Concentration of proteinase 3 in the plasma measured by enzyme-linked immunosorbent assay; 130 healthy blood donors are compared with 63 patients with anti-neutrophil cytoplasm antibodies-associated systemic vasculitis and two subsets of the same patients (26 with myeloperoxidase and 37 with Wegener’s granulomatosis.
ANCA level in the patient plasma was also tested; 13 patients were PR3–ANCA-positive at the time of sampling of the 35 who were PR3–ANCA-positive at the time of diagnosis. Regarding MPO–ANCA, 10 patients were MPO–ANCA-positive at the time of sampling of the 26 who were MPO–ANCA-positive at the time of diagnosis.
Genotype–phenotype correlations
There was no significant difference between the three promotor genotypes regarding any of the three mPR3 parameters (% of mPR3+ cells, MFI and EI) in the healthy blood donors (χ2 test). Similarly, there was no difference between the three promotor genotypes regarding their mPR3 expression in the patients (Table 1).
Table 1.
Genotype–phenotype correlation. Comparison table showing the correlation between the three genotypes of the −564 A/G promotor polymorphism in the proteinase 3 (PR3) gene and the four PR3 parameters, % of membrane-PR3 (mPR3)-positive cells, mean fluorescence intensity (MFI), expression index (EI) and plasma PR3 (median). (a) Shows the results of healthy blood donors. (b) Shows the results of patients with anti-neutrophil cytoplasm antibodies-associated systemic vasculitis.
| Genotype | % of positive cells | MFI | EI | Plasma PR3 |
|---|---|---|---|---|
| (a) | ||||
| AA | 45 | 1·61 | 54·8 | 185 |
| AG | 40 | 1·13 | 53·3 | 167 |
| GG | 45 | 1·13 | 50·3 | 130 |
| P | 0·98 | 0·57 | 0·79 | 0·0002 |
| n | 83 | 83 | 83 | 110 |
| (b) | ||||
| AA | 71 | 1·52 | 100 | 223 |
| AG | 65 | 1·42 | 109 | 199 |
| GG | 52 | 1·01 | 64·8 | 154 |
| P | 0·28 | 0·07 | 0·17 | 0·082 |
| n | 52 | 52 | 52 | 57 |
When correlating the three promotor genotypes with the plasma PR3 in the healthy blood donors, there was a significant difference between the three genotypes (P = 0·0002). The GG genotype had lower levels, which is opposite to the expected. A similar difference was observed in the patient group, but it was not significant (P = 0·08), Table 1.
Phenotype–phenotype correlations
There was no correlation between plasma PR3 and percentage of mPR3+ neutrophils in either controls or AASV patients. There was, however, a weak but significant correlation between plasma PR3 and MFI in healthy controls (r = 0·24, P = 0·015). A similar correlation was found in the MPO–ANCA-positive subgroup of AASV patients (r = 0·52, P = 0·011), while no correlation was found in the PR3–ANCA subgroup (Fig. 5). On the other hand, we did observe a significant negative correlation between plasma ANCA levels and plasma PR3 levels in the subgroup of PR3–ANCA patients (r = − 0·486, P = 0·0031), while MPO–ANCA levels did not correlate with plasma concentrations of PR3.
Fig. 5.
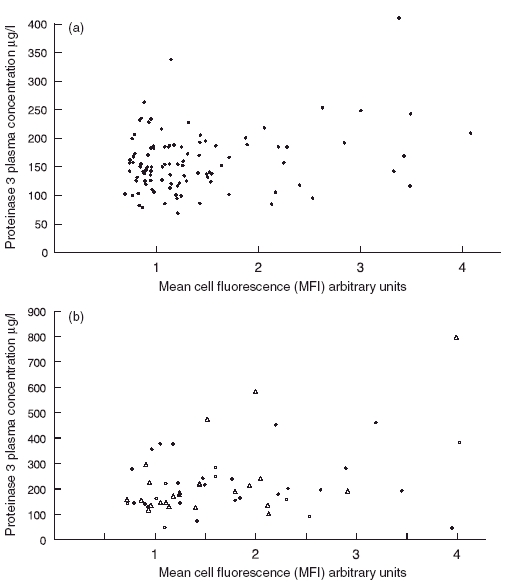
Scatter diagrams showing the correlation between the mean fluorescence intensity of membrane proteinase 3 (mPR3) on neutrophils and plasma PR3 concentrations. (a) Shows the results of 102 healthy blood donors. (b) Shows the results of 58 patients with anti-neutrophil cytoplasm antibodies (ANCA)-associated systemic vasculitis. Circles indicate 23 myeloperoxidase–ANCA- positive patients and triangles 34 PR3–ANCA-positive patients.
Discussion
The aim of this study was to shed light on the possible relationship between different features of the PR3 protein linked previously to AASV. To this end, we have analysed all these parameters in the same sample from a new cohort of AASV patients. In this study, we confirm that AASV patients have more PR3 on the surface of isolated neutrophils compared to healthy blood donors. This was due primarily to an increased number of mPR3+ cells, which is in accordance with studies suggesting that a high percentage of mPR3+ cells is a risk factor for vasculitis [6]. In addition to the high percentage, we also observed that our AASV patients had slightly increased mPR3 expression per cell (MFI) compared to healthy controls. This observation is compatible with the notion that MFI is a variable feature that correlates with disease activity and a possible marker of disease activity [19]. The slightly elevated MFI levels could be caused by low-grade inflammation, and our earlier studies have shown that AASV patients also have increased levels of circulating cytokines during remission [24]. Moreover, we found no significant differences regarding mPR3 expression (mPR3+ proportion or MFI) in vasculitis patients according to ANCA status.
In contrast to the mPR3 case, we were not able to confirm the findings from Gencik et al. regarding the −564 A/G polymorphism. In our cohort, there was no skewing of this polymorphism towards the G allele (60% for WG patients versus 69% for healthy controls). The main discrepancy between our results and theirs was a lower percentage among their healthy controls (34%), a difference that could be explained by a genetic heterogeneity in the background populations [11]. As no skewing was observed, it is not surprising that the mPR3+ high phenotype did not correlate to the GG genotype. This, together with our previous finding that the −564 A/G SNP in the promoter region of proteinase 3 does not affect the promoter activity in vitro, we conclude that this SNP is not associated with increased mPR3 expression [21].
In this study, we confirm our previous finding that vasculitis patients have elevated plasma levels of PR3 compared to healthy controls (224 versus 155, P < 0·0001) [5]. We also found a significant correlation between plasma PR3 and the −564 A/G polymorphism in the healthy controls (P < 0·0002). This argues for a genetic component of plasma PR3 levels. However, the high plasma PR3 cannot be explained by the binding of the SP1 transcription factor to the G allele, as the highest levels were found among those with the AA genotype (185 for AA versus 130 for GG). A more plausible explanation is that the A allele is in linkage disequilibrium with an allele at another locus that is actually associated with the high plasma phenotype. However, the existence of such gene locus could not explain the difference in plasma levels between patients and controls, as patients exhibited a similar difference in plasma levels with regard to genotypes (223 for AA versus 154 for GG).
Our earlier studies did not show any correlation between plasma PR3 and NGAL, a marker of secondary granules, arguing strongly against increased degranulation being the source for high plasma PR3 levels [5]. The present study shows a weak but significant correlation between plasma PR3 and mPR3–MFI among controls and among the MPO–ANCA-positive patients. The existence of such a correlation leads us to suggest that at least part of the plasma PR3 comes from the shedding of PR3 from the membrane of neutrophils. The absence of correlation in PR3–ANCA patients could be explained by interference of the autoantibodies. PR3–ANCA may enhance the clearance of plasma PR3 from the circulation or may act as a blocking agent for PR3, preventing its detection by ELISA. Supporting this notion, we found a significant negative correlation between plasma ANCA levels and plasma PR3 levels in the subgroup of PR3–ANCA patients, but not among those with MPO–ANCA.
This study shows increased mPR3 and plasma PR3 levels among AASV patients but fails to reveal which precedes the other; nor can we answer if either of them is directly implicated in the pathogenesis of vasculitis as a risk factor or activity marker. As these questions might be fundamental for the understanding of the underlying mechanisms of the disease, they deserve further study. In order to resolve these questions, more knowledge is needed regarding the origin of the plasma PR3 and the nature of the association of PR3 with the plasma membrane.
In conclusion, this study demonstrates that the elevated mPR3 expression on the membrane of neutrophils and the elevated plasma PR3 are associated with vasculitis. In addition, our data show that the elevated mPR3 expression and elevated plasma PR3 are correlated to each other. According to our results, these elevated PR3 levels found in AASV patients are not a consequence of the −564 A/G polymorphism in the PR3 gene and further studies are needed to reveal their origin, as it may be a fundamental predisposing factor for the generation of PR3–ANCA.
Acknowledgments
This study was supported by grants from the Swedish Research Council (71X-15152 and 73X-09487), the Crafoord Foundation and the Renal Foundation. We would like to thank Blood Center Skåne for providing blood samples, Wieslab AB for measuring plasma ANCA levels and Annika Andreasson for her assistance in FACS measurements.
References
- 1.Kallenberg CG, Brouwer E, Weening JJ, Tervaert JW. Anti-neutrophil cytoplasmic antibodies: current diagnostic and pathophysiological potential. Kidney Int. 1994;46:1–15. doi: 10.1038/ki.1994.239. [DOI] [PubMed] [Google Scholar]
- 2.Niles JL, McCluskey RT, Ahmad MF, Arnaout MA. Wegener’s granulomatosis autoantigen is a novel neutrophil serine proteinase. Blood. 1989;74:1888–93. [PubMed] [Google Scholar]
- 3.Rao NV, Wehner NG, Marshall BC, Gray WR, Gray BH, Hoidal JR. Characterization of proteinase-3 (PR-3), a neutrophil serine proteinase. Structural and functional properties. J Biol Chem. 1991;266:9540–8. [PubMed] [Google Scholar]
- 4.Campanelli D, Melchior M, Fu Y, et al. Cloning of cDNA for proteinase 3: a serine protease, antibiotic, and autoantigen from human neutrophils. J Exp Med. 1990;172:1709–15. doi: 10.1084/jem.172.6.1709. [DOI] [PMC free article] [PubMed] [Google Scholar]
- 5.Ohlsson S, Wieslander J, Segelmark M. Increased circulating levels of proteinase 3 in patients with anti-neutrophilic cytoplasmic autoantibodies-associated systemic vasculitis in remission. Clin Exp Immunol. 2003;131:528–35. doi: 10.1046/j.1365-2249.2003.02083.x. [DOI] [PMC free article] [PubMed] [Google Scholar]
- 6.Witko-Sarsat V, Lesavre P, Lopez S, et al. A large subset of neutrophils expressing membrane proteinase 3 is a risk factor for vasculitis and rheumatoid arthritis. J Am Soc Nephrol. 1999;10:1224–33. doi: 10.1681/ASN.V1061224. [DOI] [PubMed] [Google Scholar]
- 7.Yang JJ, Pendergraft WF, Alcorta DA, et al. Circumvention of normal constraints on granule protein gene expression in peripheral blood neutrophils and monocytes of patients with antineutrophil cytoplasmic autoantibody-associated glomerulonephritis. J Am Soc Nephrol. 2004;15:2103–14. doi: 10.1097/01.ASN.0000135058.46193.72. [DOI] [PubMed] [Google Scholar]
- 8.Ohlsson S, Hellmark T, Pieters K, Sturfelt G, Wieslander J, Segelmark M. Increased monocyte transcription of the proteinase 3 gene in small vessel vasculitis. Clin Exp Immunol. 2005;141:174–82. doi: 10.1111/j.1365-2249.2005.02819.x. [DOI] [PMC free article] [PubMed] [Google Scholar]
- 9.Esnault VL, Testa A, Audrain M, et al. Alpha 1-antitrypsin genetic polymorphism in ANCA-positive systemic vasculitis. Kidney Int. 1993;43:1329–32. doi: 10.1038/ki.1993.186. [DOI] [PubMed] [Google Scholar]
- 10.Elzouki AN, Segelmark M, Wieslander J, Eriksson S. Strong link between the alpha 1-antitrypsin PiZ allele and Wegener’s granulomatosis. J Intern Med. 1994;236:543–8. doi: 10.1111/j.1365-2796.1994.tb00842.x. [DOI] [PubMed] [Google Scholar]
- 11.Gencik M, Meller S, Borgmann S, Fricke H. Proteinase 3 gene polymorphisms and Wegener’s granulomatosis. Kidney Int. 2000;58:2473–7. doi: 10.1046/j.1523-1755.2000.00430.x. [DOI] [PubMed] [Google Scholar]
- 12.Henshaw TJ, Malone CC, Gabay JE, Williams RC., Jr Elevations of neutrophil proteinase 3 in serum of patients with Wegener’s granulomatosis and polyarteritis nodosa. Arthritis Rheum. 1994;37:104–12. doi: 10.1002/art.1780370116. [DOI] [PubMed] [Google Scholar]
- 13.Baslund B, Petersen J, Permin H, Wiik A, Wieslander J. Measurements of proteinase 3 and its complexes with alpha 1-proteinase inhibitor and anti-neutrophil cytoplasm antibodies (ANCA) in plasma. J Immunol Meth. 1994;175:215–25. doi: 10.1016/0022-1759(94)90364-6. [DOI] [PubMed] [Google Scholar]
- 14.Witko-Sarsat V, Cramer EM, Hieblot C, et al. Presence of proteinase 3 in secretory vesicles: evidence of a novel, highly mobilizable intracellular pool distinct from azurophil granules. Blood. 1999;94:2487–96. [PubMed] [Google Scholar]
- 15.Csernok E, Ernst M, Schmitt W, Bainton DF, Gross WL. Activated neutrophils express proteinase 3 on their plasma membrane in vitro and in vivo. Clin Exp Immunol. 1994;95:244–50. doi: 10.1111/j.1365-2249.1994.tb06518.x. [DOI] [PMC free article] [PubMed] [Google Scholar]
- 16.Halbwachs-Mecarelli L, Bessou G, Lesavre P, Lopez S, Witko-Sarsat V. Bimodal distribution of proteinase 3 (PR3) surface expression reflects a constitutive heterogeneity in the polymorphonuclear neutrophil pool. FEBS Lett. 1995;374:29–33. doi: 10.1016/0014-5793(95)01073-n. [DOI] [PubMed] [Google Scholar]
- 17.Schreiber A, Busjahn A, Luft FC, Kettritz R. Membrane expression of proteinase 3 is genetically determined. J Am Soc Nephrol. 2003;14:68–75. doi: 10.1097/01.asn.0000040751.83734.d1. [DOI] [PubMed] [Google Scholar]
- 18.Harper L, Cockwell P, Adu D, Savage CO. Neutrophil priming and apoptosis in anti-neutrophil cytoplasmic autoantibody-associated vasculitis. Kidney Int. 2001;59:1729–38. doi: 10.1046/j.1523-1755.2001.0590051729.x. [DOI] [PubMed] [Google Scholar]
- 19.Muller Kobold AC, Kallenberg CG, Tervaert JW. Leucocyte membrane expression of proteinase 3 correlates with disease activity in patients with Wegener’s granulomatosis. Br J Rheumatol. 1998;37:901–7. doi: 10.1093/rheumatology/37.8.901. [DOI] [PubMed] [Google Scholar]
- 20.Rarok AA, Stegeman CA, Limburg PC, Kallenberg CG. Neutrophil membrane expression of proteinase 3 (PR3) is related to relapse in PR3–ANCA-associated vasculitis. J Am Soc Nephrol. 2002;13:2232–8. doi: 10.1097/01.asn.0000028642.26222.00. [DOI] [PubMed] [Google Scholar]
- 21.Pieters K, Pettersson A, Gullberg U, Hellmark T. 64 A/G polymorphism in the promoter region of the proteinase 3 gene associated with Wegener’s granulomatosis does not increase the promoter activity. Clin Exp Immunol. 2004;138:266–70. doi: 10.1111/j.1365-2249.2004.02608.x. The − 5. [DOI] [PMC free article] [PubMed] [Google Scholar]
- 22.Jennette JC, Falk RJ, Andrassy K, et al. Nomenclature of systemic vasculitides. Proposal of an international consensus conference. Arthritis Rheum. 1994;37:187–92. doi: 10.1002/art.1780370206. [DOI] [PubMed] [Google Scholar]
- 23.Miller SA, Dykes DD, Polesky HF. A simple salting out procedure for extracting DNA from human nucleated cells. Nucl Acids Res. 1988;16:1215. doi: 10.1093/nar/16.3.1215. [DOI] [PMC free article] [PubMed] [Google Scholar]
- 24.Ohlsson S, Wieslander J, Segelmark M. Circulating cytokine profile in anti-neutrophilic cytoplasmatic autoantibody-associated vasculitis: prediction of outcome? Med Inflamm. 2004;13:275–83. doi: 10.1080/09629350400003100. [DOI] [PMC free article] [PubMed] [Google Scholar]