

Abstract
During the effector phase of graft-versus-host disease (GvHD) response, donor T cells play an essential role and they are believed to change the expression of activation and co-stimulatory markers associated with functional alloreactivity. We analysed the expression of CD25, CD69, HLA-DR, CD154 and CD134 on CD4+ and CD8+ T cells by flow cytometry during acute GvHD (aGvHD) in 24 patients receiving human leucocyte antigen (HLA)-identical stem cell transplants. Expression of these molecules in nine patients with stages I–IV aGvHD was compared with 15 patients without aGvHD (n = 15). Serial analysis showed that peripheral blood of aGvHD patients presented a significant increase of CD4+ CD25+ cells (P < 0·03), CD4+ CD69+ (P < 0·04) and CD4+ CD134+ cells (P < 0·01). Additionally, there was a significant increase in CD8+ cells expressing CD134 (P = 0·007) and CD154 (P = 0·02). After resolution of aGvHD, the increased expression of these molecules returned to values comparable to patients without aGvHD. Only two of the 15 patients without clinical signs of aGvHD presented activated T cells that could not be attributed to development of aGvHD. In summary, our data show that multiple activation molecules are preferentially up-regulated on CD4+ and CD8+ T cells from patients with aGvHD. These patients had a significant increase in the expression of the co-stimulatory molecules CD134 and CD154.
Keywords: activation, CD4+ lymphocytes, CD8+ lymphocytes, GvHD, phenotype
Introduction
Allogeneic stem cell transplantation (SCT) undoubtedly represents a major advance in the treatment of many malignant diseases, but unfortunately acute graft-versus-host disease (aGvHD) remains a serious complication. During the development of this process, donor lymphocytes play a pivotal role in recognizing host major histocompatibility complex (MHC) class I and class II and minor antigens as well as initiating a cascade of signalling events that direct and regulate T cell activation. Co-stimulatory signals and cytokines also shape the outcome of the immune response [1].
Because the T cell subset mediating aGvHD remains unclear [2–4], most preventive therapies target all T cells by physical or immunological means, regardless of their specificity. These strategies lead to prolonged post-transplantation immunodeficiency [5,6], recommending the exploration of selective depletion strategies to target T cells actively involved in allorecognition, without inhibiting the entire T cell repertoire. Accordingly, antibodies against CD25, which is up-regulated on activated T cells, are being used clinically as part of aGvHD treatment [7].
Co-stimulatory molecules also play a major role in activation of the effector T cells involved in aGvHD. Studies in animal models have suggested that the blockade of co-stimulatory molecules is a promising therapeutic approach for aGvHD. The administration of anti-CD134L monoclonal antibody (MoAb) successfully ameliorated lethal aGvHD in mice after bone marrow transplantation with induction of hyporesponsiveness to host alloantigen [8]. Furthermore, the blockade of CD40–CD154 interaction ameliorated murine acute and chronic GvHD [9,10]. Although these results indicate clearly that the interaction between co-stimulatory markers and their respective ligands intervenes in the pathogenesis of GvHD, there are discrepancies in identifying molecules that could be utilized as markers for aGvHD.
The development of successful strategies for GvHD prevention and therapy relies on a complete understanding of the mechanisms involved in allogeneic stimulation. It is therefore of interest to determine the levels of expression of activation and co-stimulatory markers on T lymphocytes as a measure of the immune reactivity during GvHD development. Using multi-parameter flow cytometry, we monitored activation markers and co-stimulatory molecules (CD25, CD69, DR, CD154, CD134) on CD4+ and CD8+ T cells from allogeneic SCT recipients during the critical first 3 months post-transplantation. Our results showed significant elevated percentages of CD25+, CD69+ and CD134+ CD4+ lymphocytes as well as CD69+, CD134+ and CD154+ CD8+ lymphocytes at the moment of GvHD development.
Materials and methods
Patient selection and blood sample collection
Twenty-four patients who underwent an allogeneic haemopoietic SCT at the Clinical Hematology Service of the Hospital Sant Pau between February 2002 and October 2002 were included in this study. All patients gave informed consent approved by the ethics committee of the institution before the procedure. Patients received an SCT from related donors (n = 21) or unrelated donors (n = 3) who were allele-matched for human leucocyte antigen (HLA)-A, -B, -C, -DRB1 and -DQB1. Details regarding demographic data, diagnoses, conditioning regimens, graft composition and post-transplant immunosuppression are listed in Table 1. Three patients received bone marrow and 21 received mobilized granulocyte–colony-stimulating factor (G-CSF) peripheral blood products as the stem cells source. Samples of control non-GvHD patients were obtained at the same time as the samples from GvHD patients. Also, additional samples from 15 healthy controls were included in the study.
Table 1.
Clinical features of patients.
| Recipient age, mean (range) | 36·5 (20–64) |
| Recipient sex, M/F | 19/5 |
| Donor sex, M/F | 14/10 |
| Diagnosis | |
| Acute myeloid leukaemia | 6 |
| Acute lymphoid leukaemia | 1 |
| Non-Hodgkin lymphoma | 2 |
| Hodgkin disease | 4 |
| Multiple myeloma | 5 |
| Other | 6 |
| Conditioning regimen | |
| Fludarabine/melphalan | 13 |
| Fludarabine/busulfan | 1 |
| Cyclophosphamide/TBI | 5 |
| Other | 5 |
| Graft characteristics, mean (range) | |
| CD34 × 106/kg | 5·3 (2·8–13) |
| CD3 × 108/kg | 2·3 (0·28–3) |
| CD3 × 105/kg* (n = 3) | 3 |
| GvHD prophylaxis | |
| Cyclosporine + methotrexate | 20 |
| Cyclosporine | 3 |
| Cyclosporine + micophenolate | 1 |
| Acute GHVD (n = 9) | |
| Skin | 8 |
| Liver | 3 |
| Intestine | 4 |
CD34+ selected grafts.
Preparative regimens
Patients in the reduced-intensity conditioning regimen group received fludarabine (30 mg/m2 body surface area for 5 consecutive days) in combination with busulphan (10 mg/kg total dose in 3 days) (n = 1) or melphalan (70 mg/m2 body surface area for 2 consecutive days) (n = 13). Patients in the myeloablative group (n = 10) received cyclophosphamide in combination with fractionated total body irradiation or busulphan. In two of the 24 cases, anti-thymocyte immunoglobulin (Imtix-Sangstat, Lyon, France; 2·5 mg/kg/day for 4 consecutive days) was added to the regimen.
GvHD prophylaxis, grading and treatment
Cyclosporine and a short course of methotrexate were used as GvHD prophylaxis in the majority of cases. Other regimens used were cyclosporin alone (n = 3) and cyclosporin combined with mycophenolate mophetil in one patient. T cell depletion by means of CD34+ cell selection was carried out in three patients. Diagnosis and grading of aGvHD were performed according to established criteria [11]. Initial treatment consisted of prednisone (2 mg/kg per day). Steroid-refractory aGvHD was treated with either an anti-interleukin (IL)-2 receptor monoclonal antibody (Leukotac, Madaus, Barcelona, Spain) or anti-thymocyte Ig (Imtix-Sangstat).
Flow cytometric immunophenotyping
Peripheral blood samples for immunophenotyping were collected in ACD-A anti-coagulant. Whole blood aliquots of 100 µl were labelled with MoAbs to activation markers and co-stimulatory molecules, followed by erythrocyte lysis using an automatic device (TQ-prep Coulter, Beckman-Coulter, Hialeah, FL, USA), as described previously [12]. The following MoAbs were used: CD3-PC5, CD4-ECD (Coulter), CD8-fluorescein isothiocyanate (FITC) (Caltag-Burlingame, CA, USA), CD25-phycoerythrin (PE), human leucocyte antigen-D-related (HLA-DR), CD69-PE, CD134-FITC and CD154-FITC (BD Bioscience, San Jose, CA, USA). The expression of cell surface antigens was assessed using three-colour flow cytometry (Coulter Epics XL). At least 5000 gated CD3+ events were collected. CD4+ and CD8+ subpopulations in the lymphocyte forward- versus side-scatter gate were quantified and expressed as a percentage of the total CD4+ or CD8+ population, respectively.
Chimerism analysis
Chimerism was assessed by polymerase chain reaction (PCR) of short tandem repeat DNA sequences [13] from peripheral blood samples, obtained at different time-points post-transplant, starting at day +15. When mixed chimerism was detected, analysis was performed in T cells and granulocytes purified with specific monoclonal antibodies coupled to magnetic beads (Dynal, Oslo, Norway).
Statistical analysis
Analysis of differences between groups was performed using a parametric test (Student’s t-test). Values are expressed as percentages for lymphocyte subsets [means ± standard deviation (s.d.)]. Pearson’s correlation was performed by spss (SPSS, Inc., Chicago, IL, USA) with samples from group I. P-values < 0·05 were considered significant.
Results
Clinical data and chimerism
Of nine patients who developed aGvHD, three had grades 1–2 skin, three had involvement of skin and intestine, two had involvement of skin plus liver and one patient developed grade 3 liver and intestine aGvHD. Details on treatment and clinical outcome of these patients are shown in Table 2. All patients except one had complete donor chimerism during the entire period of the study. Only one patient with acute myeloid leukaemia and who received unrelated bone marrow transplantation had a mixed chimera, with 30% of T cells from recipient origin.
Table 2.
Characteristics and treatment of patients with acute graft-versus-host disease (aGvHD).
| pa | GvHD (global grade) | Organ | Treatment | Infections before GvHD treatment | T cell chimerism (%)b | Outcome |
|---|---|---|---|---|---|---|
| 1 | II | Skin, intestine | PDN, Leukotac | Staphylococcus epidermidis | NR | 100 |
| 2 | II | Skin, intestine | PDN, Leukotac | Noc | PR | 70 |
| 3 | III | Liver, intestine | PDN, MMF, Leukotac, ATG | Candida albicans, Streptococcus viridans | NR | 100 |
| 4 | II | Skin | PDN | No | CR | 100 |
| 5 | II | Skin, liver | PDN | Staphylococcus epidermidis | CR | 100 |
| 6 | I | Skin | PDN | Enterococcus faecium | CR | 100 |
| 7 | I | Skin | CsA, PDN, MMF | No | CR | 100 |
| 8 | II | Skin, liver | PDN, Leukotac, ATG | Staphylococcus aureus | NR | 100 |
| 9 | II | Skin, intestine | PDN | No | CR | 100 |
ATG: anti-thymocyte immunoglobulin; CR: complete response; CsA: cyclosporin A; MMF: micophenolate mophetil; NR: non-response; PDN: prednisone; PR: partial response
patient number
chimerism at the time of aGvHD
without infections.
One hundred and five peripheral blood samples were collected from 24 patients during the 100 days after transplantation. The median number of samples per patient was four (range 2–9). Forty-three samples were from nine patients who developed aGvHD after the transplant and they were classified as: (a) group I: samples that were taken approximately 11 days before GvHD symptoms (n = 11); group II: samples taken at GvHD onset prior to treatment (n = 9); and group III: samples taken a mean of 14 days after the detection of GvHD (n = 23 samples from the nine patients with GvHD treated as shown in Table 3). In addition, 62 samples were collected from the 15 patients who did not show clinical manifestations of aGvHD (22 samples during the first 30 days; 27 between days 31 and 62; and 13 between days 63 and 100).
Table 3.
Frequencies of T cell subsets in the different groups of samples.
| Subset | Group I | Group II | Group III | Non-GvHD | Controls |
|---|---|---|---|---|---|
| CD3+ | 67·1 ± 30a | 67·2 ± 15 | 72·1 ± 13 | 62·0 ± 19 | 72·5 ± 8 |
| CD4+ | 36·2 ± 23 | 30·1 ± 12 | 32·1 ± 13 | 24·3 ± 11 | 48·0 ± 7 |
| CD8+ | 30·5 ± 21 | 36·6 ± 22 | 40·6 ± 21 | 37·1 ± 21 | 25·1 ± 5 |
| Ratio CD4+/CD8+ | 1·18 | 0·82 | 0·79 | 0·65 | 1·91 |
Values are shown as mean percentages ± s.d.; GvHD: graft-versus-host disease.
T cell phenotype
Before determining the changes in the activation phenotype of T lymphocytes, we first compared the mean of CD3+ T cell percentages in non-GvHD patient samples (62 ± 19) with the aGvHD samples from groups I (67 ± 30), II (67 ± 15) and III (72 ± 13) (Table 3). No significant difference was observed between any of the three GvHD groups and the non-GvHD samples, nor between samples from patients and non-transplanted healthy controls (72 ± 8).
To analyse the expression of activation markers on different subsets of CD3+, it was necessary to evaluate the proportion of CD4+ and CD8+ in the GvHD and non-GvHD groups of samples (Table 3). The percentages of CD4+ and CD8+ cells were heterogeneous among individual transplanted patients. As expected, the CD4+/CD8+ ratio in the patients was always below healthy control values (2·01 ± 0·55). There was a predominance of CD4+ cells over CD8+ in the samples from group I, consistent with previous reports indicating that the CD4+/CD8+ ratio in allotransplanted individuals was close to normal values at very early periods after transplant [14]. Conversely, the CD4+/CD8+ ratios in groups II and III and in non-GvHD patients were inverted as a result of the delayed CD4+ T cell recovery after transplantation [15].
Phenotypic expression of activation markers and co-stimulatory molecules on CD4+ T cells
A general trend in the flow cytometry analysis was the increased expression of CD25 and CD69 (Fig. 1) on the CD4+ cells from GvHD patients compared to samples from non-GvHD patients and healthy controls. However, the up-regulation of each activation marker was of different magnitude. The most obvious was the increased percentage of CD25+ on CD4+ cells. This was 4·3 ± 1·2 in peripheral blood from healthy controls and 25·6 ± 13 in samples from non-GvHD patients, but even higher in group II (41·4 ± 12) and group III (30·9 ± 13) GvHD samples. Frequencies of CD25+ cells among T cells from the four patients who received Leukotac as post-GvHD therapy were not included in the analysis. We were unable to differentiate a subpopulation of CD25bright+ cells after careful flow cytometry analysis of the samples from these transplanted patients.
Fig. 1.
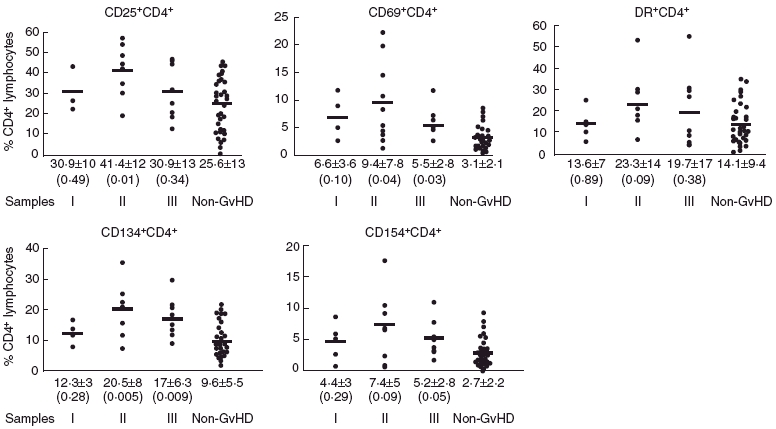
Phenotypic distribution of CD4+ cells from 105 samples of 24 patients. Samples were classified as acute graft-versus-host disease (aGvHD) (group I, group II and group III according to the time before, during and after the onset of GvHD, respectively) and non-aGvHD. CD25+, CD69+, DR+, CD134+ and CD154+ CD4+ cell subpopulations were quantified and expressed as percentage of CD4+ lymphocytes. The bar represents the mean of the percentage values for each group. The mean ± standard deviation is indicated under each group of samples. Differences between each group and the respective non-GvHD group were evaluated using t-test and the P-value indicated in parenthesis. P < 0·05 is considered statistically significant.
There was an increased percentage of CD4+ CD69+ in groups II (9·4 ± 7·8) and III (5·5 ± 2·8) GvHD samples when compared with non-GvHD patients (3·1 ± 2·1) and healthy controls (1·6 ± 1·4).
The percentage of CD4+ DR+ after transplantation in groups I (13·6 ± 7), II (23·3 ± 14) and III (19·7 ± 17) GvHD samples was not different from non-GvHD patients (14·1 ± 9·3) but significantly higher than healthy controls (2·1 ± 0·9, P < 0·01).
We next analysed the expression of T cell co-stimulatory molecules. Activated T lymphocytes can be measured by the expression of CD134 and CD154. The percentage of CD134+ cells on freshly isolated CD4+ cells in the groups II and III GvHD samples was higher than in non-GvHD patients (20·5 ± 8 and 17 ± 6·3 versus 9·6 ± 5·5, P = 0·005 and P = 0·009, respectively) or healthy controls (versus 2·1 ± 0·4, P < 0·001). On the other hand, no significant increase was observed in the percentage of CD154+ on CD4+ cells in the groups of samples I, II and III from GvHD patients (4·4 ± 3, 7·4 ± 5 and 5·2 ± 2·8, respectively) compared to non-GvHD patients (2·7 ± 2·2) but significantly higher than controls (0·1 ± 0·1, P < 0·05).
Similar results were obtained when all comparative analyses were repeated with the samples from non-GvHD patients classified into three groups according to the post-transplant period ( < 30 days, 31–61 days and 62–100 days) (data not shown). This result demonstrates that the differences observed in activation markers and co-stimulatory molecules between GvHD and non-GvHD samples were not related to the post-transplant time when samples were collected, but rather to the development of aGvHD itself.
During our individual analysis we observed that more than one activation marker was increased in the same patient during aGvHD. Although not all group II samples showed the same combination of up-regulated markers, it is notable that eight of nine aGvHD patients had three or more up-regulated markers on CD4+ T cells (Table 4). The statistical analysis of the surface markers on CD4+ T cells from the group I samples revealed significant correlations between the expression of CD25 and CD134 (0·771, P < 0·05), CD69 and CD134 (0·725, P < 0·05), CD69 and CD154 (0·941, P < 0·01) and CD134 and CD154 (0·745, P < 0·05).
Table 4.
Activated phenotype of T lymphocytes during graft-versus-host disease (GvHD) (samples group II).
| CD4 | CD8 | ||||||||||
|---|---|---|---|---|---|---|---|---|---|---|---|
| GvHD Pa | Days post-transplant | CD25+ | CD69+ | DR+ | CD134+ | CD154+ | CD25+ | CD69+ | DR+ | CD134+ | CD154+ |
| 1 | 64 | n.d.b | 2·5 | 29·9 | 11·4 | 0·7 | 8·4 | 2·42 | 12·0 | 2·58 | 0·46 |
| 2 | 27 | 54·4c | 14·6 | 21·5 | 35·9 | 9·2 | 12·9 | 15·1 | 3·41 | 7·03 | 3·79 |
| 3 | 14 | 44·7 | 10·9 | 15·8 | 25·4 | 10·5 | 9·53 | 9·81 | 1·54 | 6·54 | 3·96 |
| 4 | 70 | 19·0 | 3·9 | 7·2 | 7·3 | 2·2 | 9·4 | 6·47 | 1·21 | 2·66 | 1·28 |
| 5 | 11 | 57·0 | 20·0 | 7·3 | 21·0 | 0·8 | 19·4 | 24·4 | 17·1 | 12·2 | n.d. |
| 6 | 14 | 48·6 | 1·28 | 18·0 | 15·2 | 17·8 | 42·0 | 2·44 | 23·0 | 9·7 | 2·56 |
| 7 | 45 | 42·5 | 22·2 | 28·8 | 25·3 | 6·8 | 12·1 | 13·5 | 35·2 | 10·2 | 6·71 |
| 8 | 28 | 35·0 | 4·6 | 53·1 | 21·0 | n.d. | 17·0 | 6·37 | 68·3 | 4·7 | 2·45 |
| 9 | 18 | 30·0 | 5·4 | 29·0 | 22·6 | 6·6 | 5·88 | 25·7 | 20·0 | 11·8 | 11·8 |
| Healthy donorsd | 4·3 ± 1·2 | 1·6 ± 1·4 | 2·1 ± 0·9 | 2·1 ± 0·4 | 0·1 ± 0·1 | 2·12 +1·6 | 2·29 +2·1 | 0·3 +0·09 | 0·6 ± 0·4 | 0·11 ± 0·2 | |
Patient numbers correspond to the numbers shown inTable 2
n.d. not determined
data are shown as percentage. Bold numbers indicated those percentages higher than 2 (mean ± s.d.) values of healthy donors
values are shown as mean ± s.d. of 15 healthy donors.
Expression of activation markers and co-stimulatory molecules on CD8+ T cells
We determined the proportion of activated cells within the CD8+ subset (Fig. 2). Interestingly, the activation markers that were up-regulated in CD8+ were not the same in CD4+ cells. Group I samples from GvHD patients did not show any distinguishing activation marker or co-stimulatory molecules that could be interpreted as predictive of the onset of GvHD. Within CD8+ cells, the percentages of CD25+ and DR+ cells in any group of aGvHD samples were comparable to non-GvHD patients, although there was a significant difference with healthy controls (2·12 ± 1·52 and 0·30 ± 0·08, respectively). The CD8+ cells from group II GvHD samples presented a higher proportion of CD69+ cells (12·8 ± 10·8, P < 0·03). There was also a significant proportion of CD8+ cells in groups II and III samples that expressed CD134 and CD154 (6·7 ± 3·3 and 2·7 ± 1·8, respectively, in group II, and 4·9 ± 2·5 and 3·0 ± 3·2, respectively, in group III), compared with non-GvHD patients or healthy controls (2·8 ± 2·2 and 0·98 ± 0·9, respectively, in non-GvHD and 0·6 ± 0·4 and 0·11 ± 0·22, respectively, in controls). Furthermore, a high correlation was established between the percentages of CD8+ that expressed CD134 and CD154 (Pearson’s correlation 0·814, P < 0·01). In the individual analysis of group II, all patients except one presented a high percentage of CD8+ T cells expressing four or five studied activation/co-stimulatory markers (Table 4). No significant change in the expression of any activation marker or co-stimulatory molecule was observed in the CD8+ subset of non-GvHD samples when they were classified according to < 30 days, from 31 to 61 days and from 62 to 100 days (data not shown).
Fig. 2.
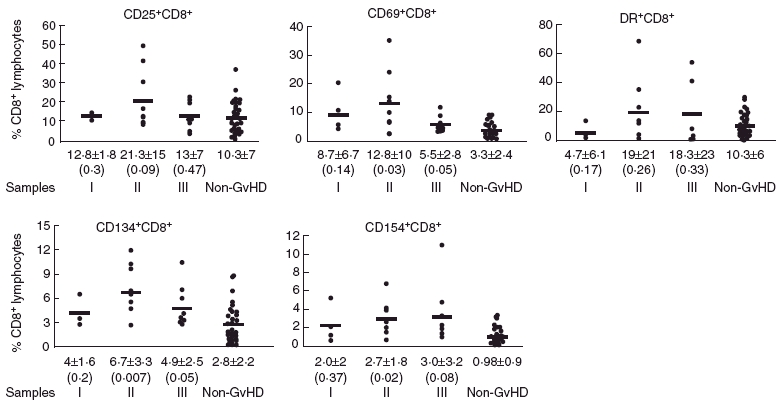
Phenotypic distribution of CD8+ T cells from 105 samples from 24 patients. Samples were classified as acute graft-versus-host disease (aGvHD) (group I, group II and group III according to the time before, during and after the onset of GvHD, respectively) and non-aGvHD. CD25+, CD69+, DR+, CD134+ and CD154+ CD8+ cell subpopulations were quantified and expressed as percentage of CD8+ lymphocytes. The bar represents the mean of the percentage values for each group. The mean ± standard deviation is indicated under each group of samples. Differences between each group and the respective non-GvHD group were evaluated using t-test and the P-value indicated in parenthesis. P < 0·05 is considered statistically significant.
Discussion
After evaluating the expression of CD25, CD69, DR, CD134 and CD154 on the surface of T cells from SCT patients, a significant percentage of activated CD4+ and CD8+ T cells was found in those patients undergoing GvHD. Cytometry analysis showed that peripheral blood from patients with aGvHD presented a two- to threefold increase of CD4+ DR+ and CD4+ CD25+ as well as CD4+ CD134+ cells. Additionally, there was a significant increase of CD8+ cells expressing CD69 and the co-stimulatory molecules CD134 and CD154. As a result of the complete level of chimerism detected in all patients except one, we can conclude that the majority of activated T cells were of donor origin.
It is reasonable to speculate that, after the exposure to host classes I and II and minor antigens, donor T cells undergo changes in the expression of activation markers. Analysis of activation markers at the cellular level could provide useful information for detection of functional alloreactivity related to a GvH response. Interestingly, in our patient cohort there was not only one phenotype as a marker indicator of GvHD. The differences observed in the array of activation markers and in the level of up-regulation may be a consequence of the nature or persistence of the stimulation signal in each patient [16].
Because the cytometry performed was limited to three simultaneous surface antigens (Table 2), we cannot determine whether several activation markers were concurrently up-regulated on the same cell. This does not necessarily seem the case, as the expression of CD25, CD69 and DR was expressed only partially on CD3+ CD134+ cells from chronic GvHD patients [17], and on the other hand each analysed molecule had different kinetics of expression on activated T cells. Nevertheless, each up-regulated marker will confer unique properties to activated T cells. The increase of CD25+ on CD4+ T cells during aGvHD in our patient cohort is consistent with the crucial role of IL-2 in the pathogenesis of aGvHD through enhancing cell proliferation [18]. Moreover, the increased expression of CD69 on CD8+ T cells and DR on CD4+ T cells during aGvHD reflects that cells have been activated but do not necessarily go on to proliferate [19]. In addition, the up-regulation of CD134 or CD154 could result in the production of cytokines, up-regulation of anti-apoptotic proteins, clonal expansion and development into memory cells [20,21].
Previous studies indicate that markers not contemplated in this study could also be useful for monitoring the alloreactivity of donor CD4+ and CD8+ cells. A marker list should include potent regulators of CD4+ and CD8+ T cell-mediated allogeneic responses in vivo such as 4–1BB [22], molecules involved in the interaction Fas/FasL, that are up-regulated in a murine model of aGvHD [23], and markers induced following T cell activation (i.e. CTLA4) [24]. No less important are molecules whose blockade could prevent the development of GvHD by reducing the activation of donor T cells (CTLA4, leucocyte function antigen (LFA)-1 and lymphotoxin like, exhibits inducible expression and competes with HSV glycoprotein D for HVEM (LIGHT) [25–27].
There have been several attempts at monitoring activation molecules during GvHD but conclusions are limited. One recent report associated the increased frequencies of CD25+ T cells in donor grafts with an increased risk for GvHD [28], whereas another study detected a high proportion of CD8+ CD69+ in children with GvHD [29].
Experimental preclinical studies have suggested the importance of co-stimulation molecules on the pathogenesis of aGvHD. Increased numbers of CD4+ CD134+ T cells were detected in peripheral blood before the earliest sign of disease in a haplo-identical rat model, running parallel to the development of GvHD [30]. However, efforts to translate these data to the clinic have provided controversial results as a consequence of the low number of patients and major differences in the selection of patients and samples. While some reports described a lack of correlation between CD134 expression on T cells and GvHD [31], Weinberg et al. reported a 10–40% increase in CD4+ CD134+ cells in a small group of patients, which correlated with the onset of clinical symptoms of GvHD [32]. In addition, data from four bone marrow-transplanted patients who developed severe GvHD indicated that an increased CD4+ CD134+ population may be associated with increased severity of GvHD [33]. Our findings, that were consistent with the up-regulation of CD134 during GvHD, also revealed the up-regulation of other activation and co-stimulatory markers, and a remarkable CD8 activation not described previously in GvHD.
The aim of this study was the identification of molecules as potential targets in the post-GvHD therapy rather than finding predictive markers of GvHD or monitoring post-GvHD treatments. Therefore, all grades of GvHD were included, and the analysis of those factors influencing the susceptibility or incidence of GvHD had no implications in the final results. For the general purpose of this study, it seemed appropriate to compare patients with and without GvHD, regardless of the triggering cause of the GvHD or the source of haematopoyetic precursors (related or non-related donors, and bone marrow or mobilized G-CSF peripheral blood). The time-matched samples from patients without GvHD were considered the most advantageous control samples. As this was a prospective study, samples from non-GvHD patients matched the times of samples from groups I, II and III GvHD patients.
Intentionally, the study was based on the comparison of the percentages of positive cells for each activation marker instead of comparing the absolute number of positive cells. Because the levels of reconstitution depend on the source of haematopoietic precursors, the absolute numbers for each marker would have added gratuitous variability and masked information about the marker differences due to the development of GvHD.
For the validation of our results, it is also important to mention that both GvHD and non-GvHD patients received comparable conditioning treatments prior to the GvHD onset, and have thus been exposed similarly to non-GVHD-related complications, stressing the relevance of the non-GVHD group as the control for this study. As a few patients without clinical signs of aGvHD occasionally presented a significant percentage of activated T cells, we cannot exclude the possibility that activation could also track the response to other stimuli such as opportunistic infections in non-GvHD patients. A general trend of our results is the transient up-regulation of activation/co-stimulation markers. Once the clinical signs of GvHD were evident, the percentage of activated T cells in group III samples declined slightly but did not reach the levels of non-GvHD samples. According to our classification, group III included samples not only from patients with resolved GvHD symptoms but also from patients under treatment and, more importantly, with residual alloreactivity associated with GvHD. Further studies are needed to assess carefully the results of the samples taken after the initiation of GvHD treatment (group III).
Our results demonstrate that the expression analysis of multiple activation markers is an enlightening methodology to study the activation of individual T cell subsets. A subset of these markers seems to be activated preferentially in patients with GvHD, making these molecules an attractive target for future therapeutic intervention.
Acknowledgments
The authors wish to thank Carolyn Newey for editorial assistance. S. V. was supported by Fondo Investigaciones Sanitarias and participant of the Program for Stabilization of Investigators of the Direcció d’Estrategia i Coordinació del Department Salut de la Generalitat de Catalunya.
References
- 1.Tanaka J, Asaka M, Imamura M. T cell co-signalling molecules in graft-versus-host disease. Ann Hematol. 2000;79:283–90. doi: 10.1007/s002779900134. [DOI] [PubMed] [Google Scholar]
- 2.Dumont-Girard F, Roux E, van Lier RA, et al. Reconstitution of the T cell compartment after bone marrow transplantation: restoration of the repertoire by thymic emigrants. Blood. 1998;92:4464–71. [PubMed] [Google Scholar]
- 3.Herrera C, Torres A, Garcia-Castellano JM, et al. Prevention of graft-versus-host disease in high risk patients by depletion of CD4+ and reduction of CD8+ lymphocytes in the marrow graft. Bone Marrow Transplant. 1999;23:443–50. doi: 10.1038/sj.bmt.1701493. [DOI] [PubMed] [Google Scholar]
- 4.Nagler A, Condiotti R, Nabet C, et al. Selective CD4+ T cell depletion does not prevent graft-versus-host disease. Transplantation. 1998;66:138–41. doi: 10.1097/00007890-199807150-00025. [DOI] [PubMed] [Google Scholar]
- 5.Hale G, Bright S, Chumbley G, et al. Removal of T cells from bone marrow for transplantation: a monoclonal antilymphocyte antibody that fixes human complement. Blood. 1983;62:873–82. [PubMed] [Google Scholar]
- 6.Marmont AM, Gale RP, Butturini A, et al. T cell depletion in allogeneic bone marrow transplantation: progress and problems. Haematologica. 1989;74:235–48. [PubMed] [Google Scholar]
- 7.Ho VT, Zahrieh D, Hochberg E, et al. Safety and efficacy of denileukin diftitox in patients with steroid-refractory acute graft-versus-host disease after allogeneic hematopoietic stem cell transplantation. Blood. 2004;104:1224–6. doi: 10.1182/blood-2004-01-0028. [DOI] [PubMed] [Google Scholar]
- 8.Tsukada N, Akiba H, Kobata T, et al. Blockade of CD134 (OX40)–CD134L interaction ameliorates lethal acute graft-versus-host disease in a murine model of allogeneic bone marrow transplantation. Blood. 2000;95:2434–9. [PubMed] [Google Scholar]
- 9.Blazar BR, Taylor PA, Panoskaltsis-Mortari A, et al. Blockade of CD40 ligand–CD40 interaction impairs CD4+ T cell-mediated alloreactivity by inhibiting mature donor T cell expansion and function after bone marrow transplantation. J Immunol. 1997;158:29–39. [PubMed] [Google Scholar]
- 10.Durie FH, Aruffo A, Ledbetter J, et al. Antibody to the ligand of CD40, gp39, blocks the occurrence of the acute and chronic forms of graft-vs-host disease. J Clin Invest. 1994;94:1333–8. doi: 10.1172/JCI117453. [DOI] [PMC free article] [PubMed] [Google Scholar]
- 11.Przepiorka D, Weisdorf D, Martin P, et al. 1994 Consensus conference on acute GVHD grading. Bone Marrow Transplant. 1995;15:825–8. [PubMed] [Google Scholar]
- 12.Canto E, Rodriguez-Sanchez JL, Vidal S. Distinctive response of naive lymphocytes from cord blood to primary activation via TCR. J Leukoc Biol. 2003;74:998–1007. doi: 10.1189/jlb.0303098. [DOI] [PubMed] [Google Scholar]
- 13.Briones J, Urbano-Ispizua A, Lawler M, et al. High frequency of donor chimerism after allogeneic transplantation of CD34+-selected peripheral blood cells. Exp Hematol. 1998;26:415–20. [PubMed] [Google Scholar]
- 14.Kalwak K, Gorczynska E, Toporski J, et al. Immune reconstitution after haematopoietic cell transplantation in children: immunophenotype analysis with regard to factors affecting the speed of recovery. Br J Haematol. 2002;118:74–89. doi: 10.1046/j.1365-2141.2002.03560.x. [DOI] [PubMed] [Google Scholar]
- 15.Peggs KS. Immune reconstitution following stem cell transplantation. Leuk Lymphoma. 2004;45:1093–101. doi: 10.1080/10428190310001641260. [DOI] [PubMed] [Google Scholar]
- 16.Caruso A, Licenziati S, Corulli M, et al. Flow cytometric analysis of activation markers on stimulated T cells and their correlation with cell proliferation. Cytometry. 1997;27:71–6. doi: 10.1002/(sici)1097-0320(19970101)27:1<71::aid-cyto9>3.0.co;2-o. [DOI] [PubMed] [Google Scholar]
- 17.Kotani A, Ishikawa T, Matsumura Y, et al. Correlation of peripheral blood OX40+ (CD134+) T cells with chronic graft-versus-host disease in patients who underwent allogeneic hematopoietic stem cell transplantation. Blood. 2001;98:3162–4. doi: 10.1182/blood.v98.10.3162. [DOI] [PubMed] [Google Scholar]
- 18.Petersen SL, Sidorov IA, Russell CA, Dickmeiss E, Vindelov LL. Limiting dilution analysis of interleukin-2 producing helper T cell frequencies as a tool in allogeneic hematopoietic cell transplantation. Transplantation. 2005;80:573–81. doi: 10.1097/01.tp.0000173390.31035.10. [DOI] [PubMed] [Google Scholar]
- 19.Simms PEE, Ilis TM. Utility of flow cytometric detection of CD69 expression as a rapid method for determining poly- and oligoclonal lymphocyte activation. Clin Diagn Lab Immunol. 1996;3:301–4. doi: 10.1128/cdli.3.3.301-304.1996. [DOI] [PMC free article] [PubMed] [Google Scholar]
- 20.Blair PJ, Riley JL, Harlan DM, et al. CD40 ligand (CD154) triggers a short-term CD4(+) T cell activation response that results in secretion of immunomodulatory cytokines and apoptosis. J Exp Med. 2000;191:651–60. doi: 10.1084/jem.191.4.651. [DOI] [PMC free article] [PubMed] [Google Scholar]
- 21.Weinberg AD, Evans DE, Thalhofer C, Shi T, Prell RA. The generation of T cell memory: a review describing the molecular and cellular events following OX40 (CD134) engagement. J Leukoc Biol. 2004;75:962–72. doi: 10.1189/jlb.1103586. [DOI] [PubMed] [Google Scholar]
- 22.Blazar BR, Kwon BS, Panoskaltsis-Mortari A, et al. Ligation of 4–1BB (CDw137) regulates graft-versus-host disease, graft-versus-leukemia, and graft rejection in allogeneic bone marrow transplant recipients. J Immunol. 2001;166:3174–83. doi: 10.4049/jimmunol.166.5.3174. [DOI] [PubMed] [Google Scholar]
- 23.Shustov A, Nguyen P, Finkelman F, Elkon KB, Via CS. Differential expression of Fas and Fas ligand in acute and chronic graft-versus-host disease: up-regulation of Fas and Fas ligand requires CD8+ T cell activation and IFN-gamma production. J Immunol. 1998;161:2848–55. [PubMed] [Google Scholar]
- 24.Linsley PS, Greene JL, Tan P, et al. Coexpression and functional cooperation of CTLA-4 and CD28 on activated T lymphocytes. J Exp Med. 1992;176:1595–604. doi: 10.1084/jem.176.6.1595. [DOI] [PMC free article] [PubMed] [Google Scholar]
- 25.Via CS, Rus V, Nguyen P, Linsley P, Gause WC. Differential effect of CTLA4Ig on murine graft-versus-host disease (GVHD) development: CTLA4Ig prevents both acute and chronic GVHD development but reverses only chronic GVHD. J Immunol. 1996;157:4258–67. [PubMed] [Google Scholar]
- 26.Harning R, Pelletier J, Lubbe K, Takei F, Merluzzi VJ. Reduction in the severity of graft-versus-host disease and increased survival in allogenic mice by treatment with monoclonal antibodies to cell adhesion antigens LFA-1 alpha and MALA-2. Transplantation. 1991;52:842–5. doi: 10.1097/00007890-199111000-00017. [DOI] [PubMed] [Google Scholar]
- 27.Morel Y, Truneh A, Costello RT, Olive D. LIGHT, a new TNF superfamily member, is essential for memory T helper cell-mediated activation of dendritic cells. Eur J Immunol. 2003;33:3213–9. doi: 10.1002/eji.200324410. [DOI] [PubMed] [Google Scholar]
- 28.Stanzani M, Martins SL, Saliba RM, et al. CD25 expression on donor CD4+ or CD8+ T cells is associated with an increased risk for graft-versus-host disease after HLA-identical stem cell transplantation in humans. Blood. 2004;103:1140–6. doi: 10.1182/blood-2003-06-2085. [DOI] [PubMed] [Google Scholar]
- 29.Kalwak K, Turkiewicz D, Ussowicz M, et al. Clinical value of the flow cytometric method for measuring lymphocyte subset activation: spontaneous activation of T cell subpopulations is associated with acute GvHD. Transplant Proc. 2003;35:1559–62. doi: 10.1016/s0041-1345(03)00512-8. [DOI] [PubMed] [Google Scholar]
- 30.Tittle TV, Weinberg AD, Steinkeler CN, Maziarz RT. Expression of the T cell activation antigen, OX-40, identifies alloreactive T cells in acute graft-versus-host disease. Blood. 1997;89:4652–8. [PubMed] [Google Scholar]
- 31.Gadisseur AP, Gratama JW, Lamers C, et al. Expression of T cell activation antigen CD134 (OX40) has no predictive value for the occurrence or response to therapy of acute graft-versus-host disease in partial T cell-depleted bone marrow transplantation. Bone Marrow Transplant. 1999;23:1013–7. doi: 10.1038/sj.bmt.1701755. [DOI] [PubMed] [Google Scholar]
- 32.Weinberg AD, Bourdette DN, Sullivan TJ, et al. Selective depletion of myelin-reactive T cells with the anti-OX-40 antibody ameliorates autoimmune encephalomyelitis. Nat Med. 1996;2:183–9. doi: 10.1038/nm0296-183. [DOI] [PubMed] [Google Scholar]
- 33.Lamb LS, Jr, Abhyankar SA, Hazlett L, et al. Expression of CD134 (0X-40) on T cells during the first 100 days following allogeneic bone marrow transplantation as a marker for lymphocyte activation and therapy-resistant graft-versus-host disease. Cytometry. 1999;38:238–43. doi: 10.1002/(sici)1097-0320(19991015)38:5<238::aid-cyto6>3.0.co;2-o. [DOI] [PubMed] [Google Scholar]