

Abstract
Mannose-binding lectin (MBL) is a component of innate immunity and thus particularly important in neonates in whom adaptive immunity is not yet completely developed. Promoter polymorphisms and structural exon-1 mutations in the MBL2 gene cause reduced or deficient MBL plasma concentrations. The aim of our study was to determine the prevalence of MBL deficiency in neonates admitted to the neonatal intensive care unit (NICU). Eighty-five NICU patients (69 premature) were included in the study. We measured MBL concentrations in umbilical cord and neonatal blood within 24 h after birth by ELISA technique. MBL2 genotypes (n = 67) were determined by Taqman analysis. MBL concentrations were measured longitudinally during three weeks in 26 premature neonates. The association between pre- and intra-partum clinical data and MBL concentrations was investigated. At birth, 29 (42%) premature and six (38%) term neonates had MBL plasma concentrations ≤ 0·7 µg/ml which was regarded as deficient. Twenty-one (38%) premature and four (36%) term neonates had variant MBL2 haplotypes, corresponding to exon-1 mutations and the LXPA haplotype. MBL concentrations increased over time in neonates with wild-type MBL2 haplotypes, but not in neonates with variant haplotypes. Low MBL plasma concentrations were related to lower gestational age and variant MBL2 haplotypes. Umbilical cord and neonatal MBL plasma concentrations appeared to be similar. In conclusion, almost half of our NICU patients, especially the premature ones, were MBL-deficient at birth. These infants may be at increased risk of neonatal infections. MBL concentration can reliably be measured in umbilical cord blood and it is positively correlated with gestational and postnatal age.
Keywords: innate immunity, mannose-binding lectin, neonate, prematurity, deficiency
Introduction
Mannose-binding lectin (MBL) is a collagenous protein that plays a role in innate immunity [1]. After binding to carbohydrate structures on the surface of various pathogens, the lectin pathway of the complement system is activated leading to enhanced phagocytosis [2,3]. Circulating MBL concentrations and functional activity are correlated with common genetic variants in the MBL2 gene. Three single nucleotide polymorphisms (SNPs) in codons 52, 54 and 57 (D, B and C variants, respectively) of exon-1 lead to reduced functional plasma MBL concentrations [1,4]. The normal allele is called A and the common designation for the variant alleles is O. Three promoter polymorphisms (H/L, X/Y and P/Q at codons −550, −221 and +4, respectively) are in linkage disequilibrium with the three dominantly inherited exon-1 SNPs, resulting in seven possible haplotypes: HYPA, HYPD, LYPA, LYPB, LYQA, LYQC and LXPA [5]. Each individual expresses two of these haplotypes. Exon-1 mutations and the LXPA haplotype cause reduced or deficient plasma concentrations [6]. Therefore, MBL2 haplotypes can be used to discriminate three categories as described previously [5,7–9], i.e. high (YA/YA and YA/XA haplotypes), medium (XA/XA and YA/O) and low (XA/O and O/O) MBL expression groups. Recently, we measured MBL concentrations in 194 healthy adult Dutch Caucasians. Median MBL concentrations were 1·65 µg/ml in the high expression group, 0·52 µg/ml in the medium expression group and 0·04 µg/ml in the low expression group [9]. Variant MBL2 haplotypes and deficient MBL concentrations are seen in approximately one third of the European Caucasian population [9,10].
MBL deficiency is associated with an opsonization defect and has been associated with recurrent infections, especially in immunocompromised individuals [11,12]. Neonates are considered to be immunocompromised because adaptive immunity has not yet been developed and their defence depends on maternal antibodies and innate immunity [13]. Therefore, neonates are prone to develop infections which are sometimes life-threatening, especially in premature patients admitted to the neonatal intensive care unit (NICU) [14].
So far, only a few studies on MBL in neonates have been published [15–21]. Cut-off plasma concentrations of 0·4 µg/ml in premature neonates and 0·7 µg/ml in term neonates were chosen to define MBL deficiency based on codon 54 mutations only [18]. Neonatal MBL concentration increases during the first weeks after birth, both in premature and term neonates [16,18–20]. Low MBL concentrations have been related to lower gestational age [18,19,21]. Therefore, low MBL concentrations may not only be explained by MBL2 gene mutations, but also by prematurity. However, no neonatal studies that have analysed all six known MBL2 SNPs (3 promoter polymorphisms and 3 exon-1 mutations) in combination with MBL concentrations and gestational age, have been reported.
Since blood sampling in neonates is difficult, measurement of MBL plasma concentrations in the umbilical cord might be a useful alternative. Previously, MBL deficiency has been determined by umbilical cord blood measurements [19–22]. However, paired MBL plasma concentrations in umbilical cord and neonatal blood have not been compared thus far. MBL has been shown to have acute phase properties and the possible influence of infection and stress at birth should be taken into account when analysing cut-off concentrations [23].
Considering the aforementioned clinical and methodological difficulties, the objectives of the present study were: to determine the prevalence of MBL deficiency at birth in neonates admitted to the NICU, to investigate whether the development of MBL concentrations during the first month is correlated with MBL2 genotype, to identify clinical characteristics that are associated with low neonatal MBL concentrations and to determine whether MBL deficiency can be diagnosed reliably in umbilical cord blood.
Materials and methods
Subjects and samples
Between July 2002 and June 2003, all neonates admitted to the NICU of the Academic Medical Centre of Amsterdam, the Netherlands, were eligible to be included in this study. In total, 87 neonates were consecutively included after informed consent was obtained. Two of these neonates were subsequently excluded because they had Down syndrome. Blood was obtained from 57 umbilical cords and 63 neonates (36 paired samples) within 24 h after birth; these are further described as ‘first day’ samples. Neonatal MBL plasma concentrations (n = 63) and, when missing, umbilical cord MBL concentrations (n = 21) were used as ‘first day’ MBL concentrations (n = 84) in further analysis (Table 1). One ‘first day’ sample was missing, but we obtained a blood sample from this neonate one week after birth. During admittance to the NICU, longitudinal samples were taken from 26 premature neonates on days 7, 14 and 21. The study protocol was approved by the local medical ethics committee.
Table 1.
Clinical characteristics (n = 85).
| Clinical characteristic | n (%) | Median (range) |
|---|---|---|
| Neonate characteristics | ||
| Birth weight (g) | 1585 (615–5120) | |
| Gestational age (weeks) | 32+2 (27+3−42+3) | |
| Male gender | 45 (53) | |
| Prematurity ( < 37 weeks) | 69 (81) | |
| Small for gestational age ( < P10) | 17 (20) | |
| First day samples: | ||
| Neonatal MBL concentration | 63 (74) | |
| also umbilical cord concentration | 36 (42) | |
| also longitudinal concentration | 25 (29) | |
| MBL2 genotype | 48 (56) | |
| Only umbilical cord concentration | 21 (25) | |
| MBL2 genotype | 18 (21) | |
| No first day, only longitudinal sample | 1 (1) | |
| MBL2 genotype | 1 (1) | |
| Delivery characteristics | ||
| Pregnancy-related disease: | 22 (26) | |
| Diabetes gravidarum | 1 (1) | |
| Hypertension | 1 (1) | |
| Preeclampsia | 20 (24) | |
| Mode of delivery: | ||
| Vaginal | 33 (39) | |
| Caesarean section | 52 (61) | |
| Maternal risk factors of infection: | 40 (47) | |
| Maternal fever | 24 (28) | |
| PROM | 23 (27) | |
| Drug treatment before delivery: | ||
| Antibiotics | 24 (28) | |
| Steroids | 37 (44) | |
| Condition of neonate: | ||
| Meconium stained amnion fluid | 13 (15) | |
| Fetal distress | 43 (51) | |
| Apgar < 7 at 5 min | 4 (5) | |
| Intubation at birth | 4 (5) | |
| Suspected infection | 54 (64) | |
PROM: Prolonged rupture of membranes > 24 h.
Clinical characteristics
Ante- and intra-partum clinical data were recorded for every neonate and comprised pregnancy-related diseases (i.e. hypertension, diabetes, preeclampsia), maternal fever (≥ 38 °C), prolonged rupture of membranes > 24 h (PROM), antibiotic or steroid exposure, fetal distress (i.e. abnormalities in intrapartum fetal heart monitoring) and mode of delivery. Birth weight, gestational age, Apgar score, need for intubation and reason for NICU admittance (i.e. for suspected infection versus no infection) were recorded prospectively. Prematurity was defined as gestational age < 37 weeks. Neonates ‘small for gestational age’ had birth weights < P10 for their gestational age.
Assays
MBL measurements were performed at Sanquin Research and the Landsteiner Laboratory, Academic Medical Centre, Amsterdam. MBL plasma concentrations were measured by ELISA technique as previously described [8]. Briefly, mannan was coated to the solid phase and after incubation with plasma, biotinylated mouse-anti-MBL IgG 5E12 (Sanquin, 10 µg/ml) was used as the detection antibody.
Genotyping of the promoter polymorphisms and exon-1 SNPs was performed using a Taqman assay with specific primers and minor groove binding probes for each SNP [8]. In this technique alleles with each of the coding polymorphisms are directly amplified using forward and reverse allele-specific primers. Genotyping was performed independently of the clinical data collection.
Statistical analysis
The optimal cut-off MBL plasma concentration for MBL deficiency was determined by a receiver-operator characteristic (ROC) curve. The area under the curve (AUC) represents how well MBL plasma concentrations are at discriminating patients with wild-type MBL2 haplotypes from those with variant MBL2 haplotypes. A value of 0·50 means that MBL plasma concentrations are no better than chance alone, a value of 1·0 means perfect discriminative accuracy. The course of MBL concentrations over time was studied by repeated measures analysis of variance. The mixed procedure of SPSS statistical software (version 12·0.1) with compound symmetry heterogeneous covariance structure and the restricted maximum likelihood estimation method were used.
Univariate associations between clinical characteristics and first day MBL concentrations were assessed by the Mann–Whitney U, Kruskal–Wallis or Spearman’s rank test. All clinical characteristics univariately associated (set at P ≤ 0·25) with MBL concentrations were subsequently studied with multiple linear regression (with a stepwise forward selection strategy), using the F-statistics with P = 0·05 on the criterion level for selection. To assess violations of necessary assumptions in multiple regression, normal plots of the residuals of the regression model were produced.
The possible agreement between neonatal and umbilical cord MBL concentrations was studied by the Spearman’s rank correlation test and a Bland-Altman plot in which the difference between the two measurements was plotted against their mean [24]. Vertical spread represents the degree of variation between both values.
Results
Clinical characteristics
Sixty-nine (81%) premature and 16 (29%) term neonates were included. Their clinical characteristics are presented in Table 1. The median (range) birth weight was 1585 (615–5120) grams. Three neonates appeared to have minor deformities, i.e. isolated hypospadia, polycystic kidneys and an extra digit, respectively. Of all children, 54 (64%) neonates were evaluated for suspected infection after birth, of which 40 were on maternal indication, i.e. due to maternal fever or PROM. Within four days after birth, a culture-proven infection was seen in only one patient. One premature neonate (genotype HYPA/HYPA) died of noninfectious complications during hospitalization.
MBL analysis
The median (range) first day MBL plasma concentration was 0·98 (0·01–4·16) µg/ml in the premature and 1·20 (0·10–3·69) µg/ml in the term neonates (P = 0·54). Due to insufficiently large blood samples, MBL2 genotypes could only be determined in 66 (79%) neonates with known first day values and in one neonate with only longitudinal measurements (Table 1). Patients were classified into three MBL genotype expression groups, i.e. high, medium and low, as described previously [5,7–9].
Table 2 shows that 35 (51%) premature neonates had high-expressing genotypes, while 13 (19%) had medium and 8 (12%) had low-expressing genotypes (13 genotypes were missing). In the term group, seven (44%) neonates had high-expressing genotypes, compared to 2 (12·5%) neonates with medium-expressing and 2 (12·5%) neonates with low-expressing genotypes (5 genotypes were missing). The distribution over the genotype expression groups did not differ between premature and term neonates (P = 0·71). These frequencies also correspond with those observed in 194 healthy adult Caucasians [9].
Table 2.
Overview of first day MBL concentrations and MBL2 genotype.
| Premature | Term | |||
|---|---|---|---|---|
| MBL deficiency groups | n (%) | MBL (µg/ml) Median (range) | n (%) | MBL (µg/ml) Median (range) |
| All subjects | 69 (100·0) | 0·98 (0·01–4·16)* | 16 (100·0) | 1·20 (0·10–3·69) |
| MBL2 genotype | ||||
| YA/YA | 22 | 1·64 (0·12–4·16)* | 6 | 1·75 (0·77–3·69) |
| YA/XA | 13 | 1·37 (0·39–2·84) | 1 | 1·89 |
| XA/XA | 1 | 2·79 | 0 | |
| YA/O | 12 | 0·33 (0·01–0·62) | 2 | 0·61 (0·56–0·65) |
| XA/O | 4 | 0·19 (0·05–1·10) | 1 | 0·10 |
| O/O | 4 | 0·08 (0·02–0·43) | 1 | 0·17 |
| Missing | 13 | 1·15 (0·18–3·63) | 5 | 0·71 (0·20–1·93) |
| MBL expression group | ||||
| High | 35 (50·8) | 1·54 (0·12–4·16)* | 7 (43·8) | 1·80 (0·77–3·69) |
| Medium | 13 (18·8) | 0·33 (0·01–2·79) | 2 (12·5) | 0·61 (0·56–0·65) |
| Low | 8 (11·6) | 0·09 (0·02–1·10) | 2 (12·5) | 0·14 (0·10–0·17) |
| Missing | 13 (18·8) | 1·15 (0·18–3·63) | 5 (31·2) | 0·71 (0·20–1·93) |
| MBL concentrations | ||||
| > 0·7 µg/ml | 40 (58·0)† | 10 (62·5) | ||
| ≤ 0·7 µg/ml | 29 (42·0) | 6 (37·5) | ||
n, number of subjects
First day MBL concentration of one neonate missing.
The neonate with the missing first day MBL concentration had a concentration of 2·63 µg/ml one week after birth and was therefore considered to have a MBL concentration of > 0·7 µg/ml.
Median first day MBL plasma concentrations were associated with the MBL genotype expression groups in the premature and term neonates (P < 0·001) (Fig. 1). The median (range) first day MBL concentrations in premature neonates in the high- (n = 34 due to one lacking first day value), medium- and low-expression groups were: 1·54 (0·12–4·16) µg/ml, 0·33 (0·01–2·79) µg/ml and 0·09 (0·02–1·10) µg/ml, respectively (Table 2). The median (range) MBL plasma concentration of term neonates with high-expressing genotypes was 1·20 (0·10–3·69) µg/ml. The two term neonates with medium-expressing genotypes had MBL plasma concentrations of 0·56 µg/ml and 0·65 µg/ml, while the two term neonates with low-expressing genotypes had MBL plasma concentrations of 0·10 µg/ml and 0·17 µg/ml. The MBL concentration range in the neonates (0·05–4·16 µg/ml) was smaller than the concentration range in the healthy adults (0–11 µg/ml) [9]. Furthermore, the concentrations were skewed to the lower values (data not shown). Median MBL concentrations were decreased in premature neonates compared to term neonates, especially in the high (P = 0·24) and medium (P = 0·11) expression groups.
Fig. 1.
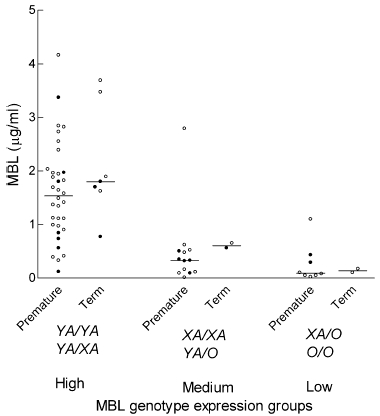
Scatterplot of first day MBL plasma concentrations in premature neonates (n = 55) and term neonates (n = 11), according to the high, medium and low MBL genotype expression groups (corresponding MBL2 haplotypes are shown). When available, neonatal concentrations are shown (○), when these were missing umbilical cord values are depicted (•). Median is illustrated (P < 0·001 between groups).
MBL deficiency
Of the neonates with known genotypes, 21 (38%) premature and 4 (36%) term neonates had variant MBL2 haplotypes (overall: 37%). For the premature and term neonates together (n = 66), ROC analysis yielded an optimal cut-off plasma concentration for MBL deficiency of 0·7 µg/ml; AUC (95% CI): 0·92 (0·82–0·97), sensitivity (95% CI): 0·92 (0·74–0·99) and specificity (95% CI): 0·88 (0·74–0·96). For the premature subgroup (n = 55), an optimal cut-off value of 0·6 µg/ml was calculated. The corresponding AUC, sensitivity and specificity (with 95% CI) were 0·91 (0·80–0·97), 0·91 (0·70–0·99) and 0·85 (0·69–0·95), respectively. Due to the small number of term neonates no reliable estimation of a cut-off value was possible. Twenty-nine (42%) premature neonates had first day MBL concentrations ≤ 0·6 µg/ml. Six (38%) term neonates had MBL concentrations ≤ 0·7 µg/ml (Table 2). The neonate (genotype HYPA/LYQA) without a first day value was considered MBL-sufficient due to a MBL concentration of 2·63 µg/ml one week after birth. In the total cohort, 35 out of 85 neonates (41%) had first day concentrations ≤ 0·7 µg/ml.
Discrepancies between MBL2 genotype and first day MBL plasma concentrations were observed in 7 premature neonates. Five neonates (gestational age range: 27+3−35+4) had low MBL plasma concentrations despite wild-type haplotypes. Two neonates with variant MBL2 haplotypes had MBL plasma concentrations > 0·7 µg/ml: 1·10 µg/ml (LXPA/O) and 2·79 µg/ml (LXPA/LXPA).
Longitudinal MBL concentrations
Genotypes were determined in 22 of 26 premature neonates (gestational age range 27+3−35+5) with longitudinal MBL blood samples. MBL plasma concentrations of neonates with high-expressing genotypes increased longitudinally over the first three weeks, especially during the first week (P < 0·001, Fig. 2). The estimated mean (95% CI) MBL concentrations were 1·25 (0·95–1·55) µg/ml, 2·83 (2·21–3·45) µg/ml, 3·59 (2·56–4·62) µg/ml and 3·44 (3·01–3·87) µg/ml on days 0, 7, 14 and 21, respectively. On the other hand, neonatal MBL plasma concentrations of four neonates in the medium group remained ≤ 0·7 µg/ml while the two neonates in the low group maintained MBL plasma concentrations ≤ 0·1 µg/ml. Three neonates (one HYPA/LYQA and two missing genotypes) had MBL-deficient concentrations on day 0 (0·68, 0·43 and 0·50 µg/ml, respectively), but achieved sufficient levels (3·81, 1·31 and 1·08 µg/ml, respectively) within a week.
Fig. 2.

Sequential changes in neonatal MBL plasma concentration during the first 3 weeks after birth, determined for neonates of the high (•, n = 16), medium (□, n = 3) and low (▵, n = 2) MBL expression group. Bold horizontal lines connect means of the high genotype expression group. P-values apply to the high genotype expression group.
MBL concentrations and clinical characteristics
First day MBL concentrations were univariately associated with variant MBL2 haplotypes (P < 0·001). Of the other clinical characteristics studied (Table 3) gestational age, pregnancy-related disease and maternal fever were introduced in a multivariate regression model, because they were univariately associated with P < 0·25. On a multivariate level only variant MBL2 haplotypes (P < 0·001) and gestational age (P = 0·004) appeared significantly associated with first day MBL concentrations (Table 3). Multivariate analysis with neonatal values (n = 63) yielded similar results.
Table 3.
Univariate and multivariate associations between clinical characteristics and first day MBL concentrations.
| Univariate analysis | Multivariate analysis | |||||||
|---|---|---|---|---|---|---|---|---|
| Clinical characteristics | n | MBL (µg/ml) Median (IQR) | R | P-value | B | 95% CI | R2 | P-value |
| Gestational age | 84 | 0·14 | 0·22 | 0·09 | 0·03–0·14 | 0·49 | 0·004 | |
| Birth weight | 84 | 0·06 | 0·62 | |||||
| MBL genotype group* | < 0·001 | 0·39 | ||||||
| High | 41 | 1·64 (0·98–2·00) | 1 | ; – | – | |||
| Medium | 15 | 0·35 (0·11–0·56) | −1·22 | −1·82–0·63 | < 0·001 | |||
| Low | 10 | 0·10 (0·05–0·33) | −1·92 | −2·56–1·28 | < 0·001 | |||
| Pregnancy-related disease | 0·21 | |||||||
| Yes | 22 | 0·66 (0·26–1·56) | ||||||
| No | 62 | 1·12 (0·38–1·94) | ||||||
| Mode of delivery | 0·43 | |||||||
| Vaginal | 33 | 0·77 (0·26–1·89) | ||||||
| Caesarean | 51 | 1·10 (0·43–1·89) | ||||||
| Maternal fever | 0·10 | |||||||
| Yes | 24 | 0·68 (0·16–1·67) | ||||||
| No | 60 | 1·12 (0·44–1·97) | ||||||
| PROM | 0·43 | |||||||
| Yes | 23 | 1·15 (0·47–1·97) | ||||||
| No | 61 | 0·77 (0·32–1·89) | ||||||
| Antenatal steroid exposure | 0·27 | |||||||
| Yes | 37 | 0·84 (0·37–1·64) | ||||||
| No | 47 | 0·99 (0·33–1·94) | ||||||
| Fetal distress | 0·29 | |||||||
| Yes | 42 | 0·79 (0·31–1·56) | ||||||
| No | 42 | 1·54 (0·42–1·93) | ||||||
MBL2 genotypes of 15 neonates were missing. PROM, prolonged rupture of membranes; IQR, interquartile range; R, Spearman’s rank correlation coefficient; B, regression coefficient; 95% CI, 95% confidence interval
R2, Adjusted cumulative explained variance.
Neonatal and umbilical cord MBL concentrations
The 36 paired neonatal and umbilical cord MBL concentrations appeared highly correlated (r = 0·95; P < 0·001, Fig. 3a). However, a Bland-Altman plot revealed that umbilical cord values were systematically higher than neonatal values (Fig. 3b). The difference increased with higher average MBL concentrations, but all neonates with neonatal values ≤ 0·7 µg/ml had umbilical cord MBL concentrations ≤ 0·7 µg/ml as well. In these neonates, the mean (standard deviation, SD) difference was 0·03 (0·15) µg/ml. This high SD was attributed to one outlier with a neonatal MBL concentration of 0·08 µg/ml and an umbilical cord concentration of 0·53 µg/ml. The mean (SD) difference was higher in neonates with concentrations > 0·7 µg/ml: 0·10 (0·58) µg/ml.
Fig. 3.

(a) Correlation (Spearman’s correlation coefficient = 0·95) of MBL plasma concentrations between 36 paired first day neonatal and umbilical cord blood samples. (b) Bland-Altman plot of difference between umbilical cord and neonatal MBL plasma concentration against their average value.
Discussion
The prevalence of both variant MBL2 haplotypes (37%) and MBL-deficient (≤ 0·7 µg/ml) plasma concentrations at birth (41%) was very high in this cohort, especially in the premature neonates. When low MBL concentrations are associated with increased infection susceptibility, possible adjustments in preventative and therapeutic antibiotic strategies will therefore apply to almost half of the NICU patients.
Despite more than a decade of research, there is no consensus on the definition of MBL deficiency. There is a high rate of haplotype variation between different ethnic groups and within these groups MBL concentrations vary considerably [6,10]. Therefore, studies in adults usually define MBL deficiency on MBL2 genotype. However, premature neonates can have low MBL concentrations despite wild-type haplotypes. Therefore, MBL deficiency at birth should be defined by decreased MBL concentrations and not by MBL2 genotype.
We confirmed that MBL plasma concentrations at birth can be decreased due to both variant MBL2 haplotypes and low gestational age [5,18,20,21]. The skewed concentration distribution in premature neonates compared to term neonates and adults confirms this observation. This observation indicates that a possible association between MBL deficiency and neonatal sepsis can best be studied in premature neonates. Probably, prematurity is associated with insufficient MBL production by the liver. Other liver proteins and complement factors have also been associated with gestational age [25–27]. We must note that the ethnic background of our cohort was heterogeneous, while the adult blood donors were all Caucasian. However, as the frequencies of the different exon-1 mutations were similar (data not shown) and all measurements were performed in the same laboratory, we believe that the cohorts can be compared in this regard.
We did not determine cut-off MBL plasma concentrations as a reference value for MBL deficiency in neonates. The ethnic background of our cohort was heterogeneous and we used a solid phase ELISA instead of a double antibody assay. However, by determining all known exon-1 mutations (D, B and C variants) and promoter polymorphisms (H/L, P/Q and X/Y) and correlating these with our ELISA results, we were able to describe the prevalence of MBL deficiency in neonates. Little is known about the minimal serum concentrations needed for binding to microorganisms and complement activation. Neth et al. [28] showed that binding of MBL to S. aureus was markedly impaired at concentrations < 0·6 µg/ml. Therefore, our cut-off concentrations might well have clinical importance with regard to the development of neonatal infections.
We showed that children initially able to produce MBL (corresponding with the wild-type MBL2 haplotypes) exhibited increasing MBL concentrations in the first weeks after birth, while those who had almost no initial production of MBL (corresponding with the variant MBL2 haplotypes) could not increase MBL concentrations (Fig. 2). This may be compatible with the observation that the liver is the main production site of circulating MBL and that there may be an increase of MBL concentration due to inflammation or growth of the liver, or both [29]. Mode of delivery does not seem to be the explanation.
No clinical characteristics other than MBL2 genotype and gestational age appeared to be associated with neonatal MBL plasma concentrations. Therefore, MBL plasma concentrations at birth are not likely to be influenced by an acute phase reaction. Since only one culture-proven infection was detected in our cohort, we assessed the impact of two maternal indicators of infection (i.e. maternal fever and PROM) on neonatal MBL concentrations. Neonates of mothers with maternal fever had lower median neonatal MBL concentrations due to variant MBL2 haplotypes.
Umbilical cord blood can be used to detect possible MBL deficiency in neonates because the differences between umbilical cord and neonatal plasma concentrations within 24 h after birth were negligible in the MBL-deficient neonates of our cohort. The relevance of this finding lies in that umbilical cord sampling is easier and less invasive than venapuncture in neonates. The relatively large difference in one MBL-deficient patient (outlier) might be explained by a misinterpretation of the ELISA results. We assume that the larger differences in neonates with MBL concentrations > 0·7 µg/ml will not lead to diagnostic difficulties, because they are all considered MBL-sufficient. The systematically higher umbilical cord values might be explained by the previously reported detection of MBL mRNA in placenta, umbilical cord cells as well as amniotic fluid [22,29,30].
In conclusion, low MBL plasma concentrations are very common in premature neonates. MBL deficiency at birth should be determined by MBL plasma concentrations; these can reliably be measured in umbilical cord blood. Since almost half of the NICU patients appears to be MBL-deficient, a possible relation of low MBL levels with neonatal infections might have widespread clinical and therapeutic implications.
Acknowledgments
We would like to thank Charlotte Dorrepaal and Natasha van Eijkelenburg for collecting clinical data and plasma samples and Joris van der Post for helpful discussion. The study was financially supported by the Landsteiner Foundation Blood Research (grant number L.S.B.R. 02·07).
References
- 1.Turner MW. Mannose-binding lectin: the pluripotent molecule of the innate immune system. Immunol Today. 1996;17:532–40. doi: 10.1016/0167-5699(96)10062-1. [DOI] [PubMed] [Google Scholar]
- 2.Holmskov U, Thiel S, Jensenius JC. Collections and ficolins: humoral lectins of the innate immune defense. Annu Rev Immunol. 2003;21:547–78. doi: 10.1146/annurev.immunol.21.120601.140954. [DOI] [PubMed] [Google Scholar]
- 3.Jack DL, Klein NJ, Turner MW. Mannose-binding lectin: targeting the microbial world for complement attack and opsonophagocytosis. Immunol Rev. 2001;180:86–99. doi: 10.1034/j.1600-065x.2001.1800108.x. [DOI] [PubMed] [Google Scholar]
- 4.Madsen HO, Garred P, Kurtzhals JA, et al. A new frequent allele is the missing link in the structural polymorphism of the human mannan-binding protein. Immunogenetics. 1994;40:37–44. doi: 10.1007/BF00163962. [DOI] [PubMed] [Google Scholar]
- 5.Madsen HO, Garred P, Thiel S, et al. Interplay between promoter and structural gene variants control basal serum level of mannan-binding protein. J Immunol. 1995;155:3013–20. [PubMed] [Google Scholar]
- 6.Madsen HO, Satz ML, Hogh B, Svejgaard A, Garred P. Different molecular events result in low protein levels of mannan-binding lectin in populations from southeast Africa and South America. J Immunol. 1998;161:3169–75. [PubMed] [Google Scholar]
- 7.Biezeveld MH, Kuipers IM, Geissler J, et al. Association of mannose-binding lectin genotype with cardiovascular abnormalities in Kawasaki disease. Lancet. 2003;361:1268–70. doi: 10.1016/S0140-6736(03)12985-6. [DOI] [PubMed] [Google Scholar]
- 8.Frakking FN, Van de Wetering MD, Brouwer N, et al. The role of Mannose-binding Lectin (MBL) in paediatric oncology patients with febrile neutropenia. Eur J Cancer. 2006 doi: 10.1016/j.ejca.2005.10.027. [Epub ahead of print] [DOI] [PubMed] [Google Scholar]
- 9.Brouwer N, Dolman KM, Van Zwieten R, et al. Mannan-binding lectin (MBL) -mediated opsonization is enhanced by the alternative pathway amplification loop. MolImmunol. 2006;43:2051–60. doi: 10.1016/j.molimm.2006.01.003. [DOI] [PubMed] [Google Scholar]
- 10.Crosdale DJ, Ollier WE, Thomson W, et al. Mannose binding lectin (MBL) genotype distributions with relation to serum levels in UK Caucasoids. Eur J Immunogenet. 2000;27:111–7. doi: 10.1046/j.1365-2370.2000.00211.x. [DOI] [PubMed] [Google Scholar]
- 11.Super M, Thiel S, Lu J, Levinsky RJ, Turner MW. Association of low levels of mannan-binding protein with a common defect of opsonisation. Lancet. 1989;2:1236–9. doi: 10.1016/s0140-6736(89)91849-7. [DOI] [PubMed] [Google Scholar]
- 12.Turner MW. The role of mannose-binding lectin in health and disease. Mol Immunol. 2003;40:423–9. doi: 10.1016/s0161-5890(03)00155-x. [DOI] [PubMed] [Google Scholar]
- 13.Mussi-Pinhata MM, Rego MA. Immunological peculiarities of extremely preterm infants: a challenge for the prevention of nosocomial sepsis. J Pediatr (Rio J. 2005;81:S59–S68. doi: 10.2223/1301. [DOI] [PubMed] [Google Scholar]
- 14.Baltimore RS. Neonatal sepsis: epidemiology and management. Paediatr Drugs. 2003;5:723–40. doi: 10.2165/00148581-200305110-00002. [DOI] [PubMed] [Google Scholar]
- 15.Ahrens P, Kattner E, Kohler B, et al. Mutations of genes involved in the innate immune system as predictors of sepsis in very low birth weight infants. Pediatr Res. 2004;55:652–6. doi: 10.1203/01.PDR.0000112100.61253.85. [DOI] [PubMed] [Google Scholar]
- 16.Aittoniemi J, Miettinen A, Laippala P, et al. Age-dependent variation in the serum concentration of mannan-binding protein. Acta Paediatr. 1996;85:906–9. doi: 10.1111/j.1651-2227.1996.tb14182.x. [DOI] [PubMed] [Google Scholar]
- 17.Kielgast S, Thiel S, Henriksen TB, Bjerke T, Olsen J, Jensenius JC. Umbilical cord mannan-binding lectin and infections in early childhood. Scand J Immunol. 2003;57:167–72. doi: 10.1046/j.1365-3083.2003.01202.x. [DOI] [PubMed] [Google Scholar]
- 18.Lau YL, Chan SY, Turner MW, Fong J, Karlberg J. Mannose-binding protein in preterm infants: developmental profile and clinical significance. Clin Exp Immunol. 1995;102:649–54. doi: 10.1111/j.1365-2249.1995.tb03866.x. [DOI] [PMC free article] [PubMed] [Google Scholar]
- 19.Terai I, Kobayashi K. Perinatal changes in serum mannose-binding protein (MBP) levels. Immunol Lett. 1993;38:185–7. doi: 10.1016/0165-2478(93)90004-l. [DOI] [PubMed] [Google Scholar]
- 20.Thiel S, Bjerke T, Hansen D, Poulsen LK, Schiotz PO, Jensenius JC. Ontogeny of human mannan-binding protein, a lectin of the innate immune system. Pediatr Allergy Immunol. 1995;6:20–3. doi: 10.1111/j.1399-3038.1995.tb00252.x. [DOI] [PubMed] [Google Scholar]
- 21.Hilgendorff A, Schmidt R, Bohnert A, Merz C, Bein G, Gortner L. Host defence lectins in preterm neonates. Acta Paediatr. 2005;94:794–9. doi: 10.1111/j.1651-2227.2005.tb01987.x. [DOI] [PubMed] [Google Scholar]
- 22.Kilpatrick DC, Liston WA, Midgley PC. Mannan-binding protein in human umbilical cord blood. Nat Immun. 1996;15:234–40. [PubMed] [Google Scholar]
- 23.Thiel S, Holmskov U, Hviid L, Laursen SB, Jensenius JC. The concentration of the C-type lectin, mannan-binding protein, in human plasma increases during an acute phase response. Clin Exp Immunol. 1992;90:31–5. doi: 10.1111/j.1365-2249.1992.tb05827.x. [DOI] [PMC free article] [PubMed] [Google Scholar]
- 24.Bland JM, Altman DG. Applying the right statistics: analyses of measurement studies. Ultrasound Obstet Gynecol. 2003;22:85–93. doi: 10.1002/uog.122. [DOI] [PubMed] [Google Scholar]
- 25.Kanakoudi F, Drossou V, Tzimouli V, et al. Serum concentrations of 10 acute-phase proteins in healthy term and preterm infants from birth to age 6 months. Clin Chem. 1995;41:605–8. [PubMed] [Google Scholar]
- 26.Polberger SK, Fex G, Raiha NC. Concentration of twelve plasma proteins at birth in very low birthweight and in term infants. Acta Paediatr Scand. 1990;79:729–36. doi: 10.1111/j.1651-2227.1990.tb11547.x. [DOI] [PubMed] [Google Scholar]
- 27.Wolach B, Dolfin T, Regev R, Gilboa S, Schlesinger M. The development of the complement system after 28 weeks’ gestation. Acta Paediatr. 1997;86:523–7. doi: 10.1111/j.1651-2227.1997.tb08924.x. [DOI] [PubMed] [Google Scholar]
- 28.Neth O, Jack DL, Dodds AW, Holzel H, Klein NJ, Turner MW. Mannose-binding lectin binds to a range of clinically relevant microorganisms and promotes complement deposition. Infect Immun. 2000;68:688–93. doi: 10.1128/iai.68.2.688-693.2000. [DOI] [PMC free article] [PubMed] [Google Scholar]
- 29.Seyfarth J, Garred P, Madsen HO. Extra-hepatic transcription of the human mannose-binding lectin gene (mbl2) and the MBL-associated serine protease 1–3 genes. Mol Immunol. 2006;43:962–71. doi: 10.1016/j.molimm.2005.06.033. [DOI] [PubMed] [Google Scholar]
- 30.Malhotra R, Willis AC, Lopez BA, Thiel S, Sim RB. Mannan-binding protein levels in human amniotic fluid during gestation and its interaction with collectin receptor from amnion cells. Immunology. 1994;82:439–44. [PMC free article] [PubMed] [Google Scholar]