

Abstract
The cholesterol-fed rabbit is a model of atherosclerosis and has been proposed as an animal model of Alzheimer's disease. Feeding rabbits cholesterol has been shown to increase the number of beta amyloid immunoreactive neurons in the cortex. Addition of copper to the drinking water of cholesterol-fed rabbits can increase this number still further and may lead to plaque-like structures. Classical conditioning of the nictitating membrane response in cholesterol-fed rabbits is retarded in the presence of these plaque-like structures but may be facilitated in their absence. In a factorial design, rabbits fed 2% cholesterol or a normal diet (0% cholesterol) for 8 weeks with or without copper added to the drinking water were given trace classical conditioning using a tone and periorbital electrodermal stimulation to study the effects of cholesterol and copper on classical conditioning of heart rate and the nictitating membrane response. Cholesterol-fed rabbits showed significant facilitation of heart rate conditioning and conditioning-specific modification of heart rate relative to normal diet controls. Consistent with previous research, cholesterol had minimal effects on classical conditioning of the nictitating membrane response when periorbital electrodermal stimulation was used as the unconditioned stimulus. Immunohistochemical analysis showed a significant increase in the number of beta amyloid positive neurons in the cortex, hippocampus and amygdala of the cholesterol-fed rabbits. Supplementation of drinking water with copper increased the number of beta amyloid positive neurons in the cortex of cholesterol-fed rabbits but did not produce plaque-like structures or have a significant effect on heart rate conditioning. The data provide additional support for our finding that, in the absence of plaques, dietary cholesterol may facilitate learning and memory.
Cholesterol enhances rabbit heart rate conditioning
The cholesterol-fed rabbit has been used as an animal model of atherosclerosis since 1913 when Anitchkow first demonstrated that a cholesterol diet induced vascular lesions (Bocan, 1998; Fan & Watanabe, 2000; Finking & Hanke, 1997; Moghadasian, 2002). More recently, the cholesterol-fed rabbit has been proposed as an animal model of Alzheimer's disease (Ghribi, Larsen, Schrag, & Herman, 2006; Sjogren, Mielke, Gustafson, Zandi, & Skoog, 2006; Sparks et al., 1994; Sparks, 1997; Sparks, Martin, Gross, & Hunsaker III, 2000; Zatta, Zambenedetti, Stella, & Licastro, 2002). Based on the observation that patients with heart disease had beta amyloid staining in the brain (Sparks, 1999; Streit & Sparks, 1997), Sparks found that rabbits fed cholesterol to induce heart disease also had beta amyloid staining in the brain (Sparks et al., 1994; Sparks, 1997).
Initial studies examining the ability of cholesterol-fed rabbits to learn found that although a cholesterol diet elevated the number of beta amyloid labeled neurons, it actually improved classical conditioning of the nictitating membrane response (Schreurs, Smith-Bell, Lochhead, & Sparks, 2003). It was only when cholesterol-fed rabbits displayed beta amyloid plaque-like structures induced by adding copper to the drinking water that classical conditioning of the nictitating membrane response (NMR) was retarded (Sparks & Schreurs, 2003). The addition of copper to the drinking water was based on the finding that copper was the critical component in tap water that increased the number of beta amyloid immunoreactive neurons in cholesterol-fed rabbits (Sparks et al., 2006; Sparks, Lochhead, Horstman, Wagoner, & Martin, 2002; Sparks & Schreurs, 2003). If plaque-like structures are not induced by supplementation with copper, cholesterol-fed rabbits show classical conditioning of the NMR at levels as high as or higher than controls (Schreurs et al., 2007, in press). The purpose of the present experiment was to determine the effects of cholesterol and copper on another form of learning – rabbit heart rate (HR) conditioning and HR conditioning-specific reflex modification (Schreurs, Crum, Wang, & Smith-Bell, 2005).
Method
Subjects
Forty one male, New Zealand white rabbits (Oryctolagus cuniculus) supplied by Harlan (Indianapolis, IN) weighed approximately 2.0-2.2 kg upon arrival. Animals were housed in individual cages, given free access to food and ultra pure water (18 MΩ, Millipore Academic) and maintained on a 12-hour light/dark cycle. Rabbits were assigned to four groups comprising a 2×2 factorial design with cholesterol-supplemented rabbit chow and copper-supplemented drinking water as the factors. The four groups consisted of cholesterol chow and copper water (cholesterol + copper, n = 11), cholesterol chow and normal water (cholesterol, n = 10), normal chow and copper water (copper, n = 10), and normal chow and normal water (control, n =10). One rabbit from the control group showed excessively high levels of spontaneous blinking that precluded behavioral assessment and was only used for histological analysis.
Cholesterol-fed rabbits received 2% cholesterol incorporated into Purina rabbit chow (Dyets Inc., Bethlehem, PA) for 8 weeks prior to behavioral experiments and normal chow control rabbits received standard Purina rabbit chow (0% added cholesterol). Rabbits supplemented with copper had 0.12 PPM copper as copper sulfate added to the drinking water. Rabbits were kept on their respective diets throughout the course of the behavioral experiments and maintained in accordance with guidelines issued by the National Institutes of Health. The research was approved by the West Virginia University Animal Care and Use Committee.
Apparatus
The apparatus has been detailed by Schreurs and Alkon (1990) who modeled their apparatus after those described by Gormezano (Coleman & Gormezano, 1971; Gormezano, 1966). In brief, each subject was restrained in a Plexiglas box and trained in a sound-attenuating, ventilated chamber (Coulbourn Instruments, Allentown, PA; Model E10-20). A stimulus panel containing a speaker and a house light (10-W, 120-V incandescent lamp) was mounted at a 45° angle, 15 cm anterior to and 15 cm above the subject's head. An 82-dB tone conditioned stimulus (CS) was presented in each chamber through the speaker and an ambient noise level of 65 dB was provided by an exhaust fan. Periorbital electrical stimulation served as the unconditioned stimulus (US) and was delivered by a programmable two-pole stimulator (Coulbourn Instruments, Model E13-35) via stainless steel Autoclip (Stoelting, Wood Dale, IL) wound clips positioned 10 mm below and 10 mm posterior to the dorsal canthus of the right eye.
The apparatus and procedures for measuring the rabbit electrocardiogram (ECG) have been detailed previously (Schreurs et al., 2005; Schreurs & Smith-Bell, 2005). Briefly, the ECG was recorded from three wound clips coupled to a custom amplifier. Two clips were placed into shaved skin on either side of the breast bone [20 mm lateral of the apex] and one on a shaved area on the right shoulder. Individual amplifier circuitry for each rabbit provided 10,000-fold amplification of the ECG signal which was routed to a 12-bit analog-to-digital converter (1-ms sampling rate) and stored on a trial-by-trial basis for subsequent inspection and analysis. A custom circuit isolated the US from the ECG amplifier during US presentations to prevent high-voltage artifacts and subsequent electronic “ringing” from saturating the system (Schreurs et al., 2005).
Details of transducing nictitating membrane (NM) movements have been reported previously (Gormezano & Gibbs, 1988; Schreurs & Alkon, 1990). In short, a hook connected to an L-shaped lever containing a freely moving ball and socket joint was attached to a 6-0 nylon loop sutured into, but not through, the NM. The other end of the lever was attached to a rotary encoder (Vernitron Corp., St Petersburg, FL; Model VOE05-256) or potentiometer (Novotechnik US Inc., Southborough, MA; Model P2201) that, in turn, was connected to a 12-bit analog-to-digital converter (5-ms sampling rate; 0.05-mm resolution). Individual analog-to-digital outputs were stored on a trial-by-trial basis for subsequent analysis. Data collection, analysis and stimulus delivery were accomplished using a LabVIEW system (National Instruments, Austin, TX).
Procedure
All rabbits received one day of adaptation, one 80-trial session of US testing (Pretest), two daily sessions of paired CS-US presentations (Paired), followed by another 80-trial session of US testing (Post Test 1), then six additional daily sessions of paired CS-US presentations and a final 80-trial session of US testing (Post Test 2). Post Test 1 was designed to assess conditioning-specific reflex modification (CRM) of HR (Schreurs et al., 2005) and was timed to coincide with the maximum level of HR conditioning (Powell & Levine-Bryce, 1988; Schneiderman, 1972). HR CRM refers to the finding that, following high levels of HR conditioning, responding to the US changes from an unconditioned increase in HR to a decrease in HR reminiscent of the conditioned HR response (Schreurs et al., 2005). Previous research has shown that HR conditioning asymptotes after a relatively small number of CS-US pairings and then decreases with additional pairings (Powell & Levine-Bryce, 1988; Schneiderman, 1972). By assessing HR CRM after two days of CS-US pairings we were able to assess HR CRM at the point of maximal HR conditioning (Schreurs et al., 2005). Post Test 2 was designed to assess CRM of the NMR and was timed to coincide with the maximum level of NMR conditioning (Schreurs, Gonzales-Joekes, & Smith-Bell, 2006). NMR CRM refers to the finding that the amplitude, peak latency and area of an unconditioned NMR to a periorbital electrodermal US increases as a result of NMR conditioning (Gruart & Yeo, 1995; Schreurs, Oh, Hirashima, & Alkon, 1995). Previous experiments have shown that CRM is a function of the strength of NMR conditioning (Buck, Seager, & Schreurs, 2001; Schreurs et al., 1995) and CRM does not occur until there are significant levels of NMR conditioning (Schreurs et al., 1995). By assessing NMR CRM after eight days of CS-US pairings, we were able to assess NMR CRM at the point of maximal NMR conditioning (Schreurs et al., 1995). Previous NMR and HR conditioning experiments from our laboratory (Schreurs et al., 2005; Schreurs et al., 1995; Schreurs, Shi, Pineda, & Buck, 2000) have shown that there is no CRM in unpaired controls so the unpaired control condition was not added to this already relatively complex experimental design.
On adaptation day, the rabbits were prepared for electrodermal stimulation and recording of both NM movement and ECG (Schreurs et al., 2005) and then adapted to the chambers for the same amount of time as subsequent recording sessions (80 min). On US Pretest and both Post Test 1 and Post Test 2, subjects received a total of 80 trials of the electrical stimulation US presented at an average intertrial interval (ITI) of 60 s (50-70 s range). Each trial involved the presentation of 1 of 20 possible combinations of stimulus intensity (0.1, 0.25, 0.5, 1.0, or 2.0 mA) and duration (10, 25, 50, or 100 ms). Four separately randomized sequences of the 20 stimulus combinations were presented on each testing day, with the restriction that the same intensity or duration could not occur on more than three consecutive trials.
The first paired session contained 30 CS-alone trials to habituate the HR orienting response to the CS prior to 45 CS-US paired trials and 5 interspersed CS-alone test trials presented following every 9th CS-US paired trial. The CS was a 100-ms, 1-KHz, 82-dB tone and the US was a 100-ms, 60-Hz, 2-mA electrodermal stimulus. On paired trials, the CS occurred 1,000-ms before the US (i.e., there was a 900-ms trace). The second and subsequent paired sessions consisted of 72 CS-US paired trials and 8 interspersed CS-alone test trials presented following every 9th CS-US paired trial. Trials were presented, on average, every 60 s. These parameters were chosen to induce robust heart rate conditioning as well as a modest level of NMR conditioning (Powell & Levine-Bryce, 1988; Schneiderman, 1972; Schreurs et al., 2005).
Data Collection
Measurement of HR classical conditioning and the HR changes used to index conditioned fear usually involves the measurement of the number of beats per minute or the interbeat interval (heart period). There continues to be considerable debate in the psychophysiology literature about the appropriate measurement of HR change and it has been argued that the interbeat interval (IBI) is a more appropriate measure of HR variability than HR per se (Berntson et al., 1997; Berntson, Cacioppo, & Quigley, 1995). Although we will use the term HR conditioning and HR CRM descriptively, the change in IBI to a stimulus from a pre-stimulus baseline is the measurement reported in the present paper because it is more accurate and it is consistent with a good deal of the rabbit HR conditioning literature (McEchron et al., 1991; Powell et al., 1988; Supple, Jr. et al., 1993). Where rabbit HR has been reported in beats per minute, it has often been converted from IBI (Ayers & Powell, 2002; McEchron, Cheng, & Gilmartin, 2004).
All IBI data reported in the present experiment were based on the ECG records collected over a 4,000-ms interval comprised of a 2,000-ms pre-stimulus baseline and a 2,000-ms interval following stimulus onset on CS-alone trials and on US test trials. Rabbit ECG data were collected as described previously (Schreurs et al., 2005). Briefly, filtered ECGs were used to detect individual heart beats using a waveform template matching algorithm created in LabVIEW. Visual inspection of the ECG ensured that heart beats missed by the waveform algorithm (false negatives) were included and those erroneously included as a result of artifacts such as movement (false positives) were eliminated. Heart beats that were missed by the algorithm typically occurred during or immediately after the US. Data were expressed as a change in IBI to the CS from the two second pre-stimulus baseline on CS-alone test trials and to the US from the two second pre-stimulus baseline during US testing (Schreurs et al., 2005; Schreurs & Smith-Bell, 2005). Heart beat detection was relatively straightforward because the “R” component of the PQRST waveform in the ECG recording had amplitudes approaching 1.0 mV which were typically ten to twenty times greater than the noise level. In contrast, the P component of the PQRST waveform had amplitudes of 20 to 40 μV. One implication of this lower signal-to-noise ratio for the P component was that although the peak amplitude could be resolved routinely, the exact onset could not. The PQ interval was most reliably measured by a peak detection algorithm (Origin Software, Northampton, MA) as the distance between the peaks of the P and Q components of the 4,000-ms ECG recording - a measure that has been used previously in the analysis of animal ECG data (Hayes, Pugsley, Penz, Adaikan, & Walker, 1994; Nijsen et al., 1998; Schreurs et al., 2005). The PQ interval was measured in the present experiment as an index of central nervous system parasympathetic control of HR because the PQ interval is modulated in large part by inputs from the motor nucleus of the vagus that receive inputs from the amygdala (Nijsen et al., 1998; Schreurs et al., 2005). We have shown previously that the PQ interval is sensitive to the level of HR conditioning and HR CRM (Schreurs et al., 2005).
All NMR data reported in the present experiment were based on NM movement recorded over a 2,000-ms interval comprised of a 200-ms pre-stimulus baseline and a 1,800-ms interval following stimulus onset on CS-alone trials and on US test trials. An NM conditioned response (CR) on CS-alone trials was defined as any extension of the NM exceeding 0.5 mm that was initiated within 1,800 ms of CS onset. A NM unconditioned response (UR) was defined as any extension of the NM exceeding 0.5 mm that occurred within 300 ms of US onset (Schreurs et al., 2000). In order to overcome the statistical limitations of empty data cells produced by subthreshold US intensities without introducing the potential biases of data imputation, we used dependent variable measures of magnitude of the NMR and magnitude of the NMR area. These measures included all amplitudes and areas above the baseline regardless of whether or not a NMR met the 0.5-mm criterion (Gracia, Mauk, Weidemann, & Kehoe, 2003). NMR topographies for each of the US intensities were averaged across subjects and US durations and examined for differences by comparing the shape of the averaged response (Schreurs et al., 2006; Seager, Smith-Bell, & Schreurs, 2003).
To provide a statistical measure of the shape of an averaged NMR, we analyzed for symmetry (skew) and tail size (kurtosis). Significant positive skew values indicate there is a peak toward the beginning of the NMR, and significant negative values indicate there is a peak more toward the end of the NMR. A significant positive kurtosis value indicates the NMR has a long tail, and a significant negative value indicates the NMR has a short tail. A skew coefficient is considered significant if the absolute value of skew divided by the standard error of skew is greater than 2, and a kurtosis coefficient is considered significant if the absolute value of kurtosis divided by the standard error of kurtosis is greater than 2 (Systat 8.0, SSI, Point Richmond, CA). Our previous research indicated that NM URs on pretest reached their peak just after US onset with a long tail to the right. Such response topographies would yield high, significant, positive values for both skew and kurtosis. However, following CS- US pairings, NM URs tend to have peaks that are larger and shifted to the right, yielding lower and even significant negative values for both skew and kurtosis (Schreurs et al., 2006; Seager et al., 2003).
Histology
In order to determine the effects of the cholesterol diet on the brain, rabbits were anesthetized deeply with a cocktail of Ketamine (640 mg/kg)/Xylazine (130 mg/kg), and perfused transcardially with 0.5% paraformaldehyde. Brains were extracted and post-fixed for fourteen days in 4% paraformaldehyde. Fifty micron vibratome sections of the hippocampus and surrounding cortex as well as the area surrounding the amygdala were immunostained with an antibody to beta amyloid (10D5; provided by Dr. Dale Schenk of Elan Pharmaceuticals) using published peroxidase-antiperoxidase immunohistochemical methods (Sparks et al., 1994). The cells stained for the10D5 antibody within a 0.5 × 0.5 mm square grid were counted in at least four randomly selected areas and averaged for the temporal cortex, hippocampus and the amygdala. Counts were made by a researcher who was blinded to the rabbits' treatment conditions.
Results
Body Weight
At the beginning of the behavioral experiments rabbits in the cholesterol + copper group weighed 2.97kg ±0.05 kg (Mean ± SEM), rabbits in the cholesterol group weighed 2.80kg ±0.08 kg, rabbits in the copper group weighed 3.31kg ±0.1kg and rabbits in the control group weighed 3.34 kg ±0.06kg. There was a significant main effect of cholesterol on body weight, F(1,36) = 37.83, p < .001, but no main effect of copper or interaction of cholesterol and copper (largest F < 1.89).
Behavior
HR Conditioning
Figure 1 shows the mean (± SEM) change in IBI to the CS from the pre-stimulus baseline for rabbits in the four groups during CS-alone Habituation trials on Day 1 and during CS-alone test trials on Days 1 and 2 as well as on Days 3-8 following Post Test 1. The figure shows very clear HR conditioning in all four groups evidenced by significantly elevated changes in mean IBI from baseline on CS-alone test trials during CS-US pairings relative to the mean IBIs on CS-alone trials during Habituation. In addition, the figure shows that the highest levels of HR conditioning were reached by the second day of CS-US pairings and subsequently began to decrease across the course of further CS-US pairings. A comparison of the four groups indicates that cholesterol-fed rabbits showed higher levels of HR conditioning than the copper or control group particularly on Day 2 when rabbits showed their highest level of HR conditioning. Among the cholesterol groups there appears to be a higher level of HR conditioning in the cholesterol group than in the cholesterol + copper group.
Figure 1.
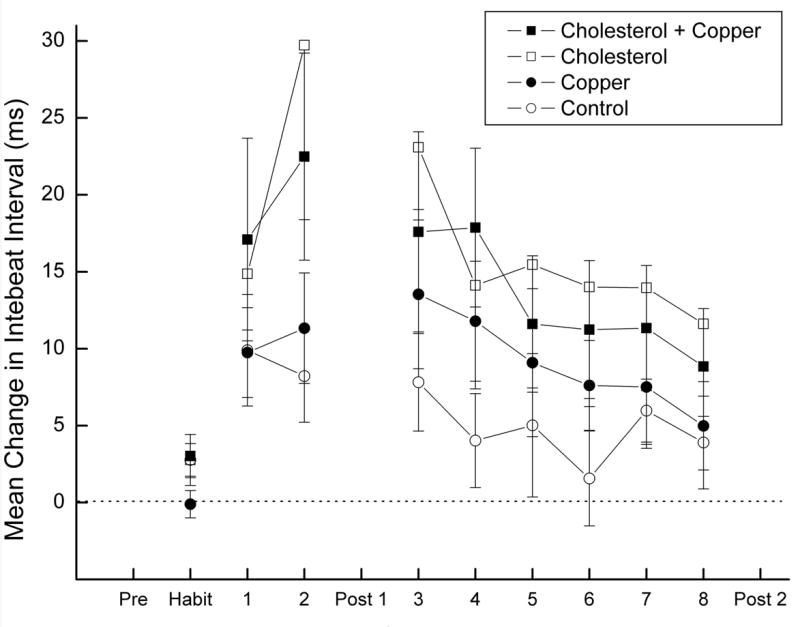
Mean (± SEM) change in interbeat interval (IBI) to the conditioned stimulus (CS) from the average pre-stimulus baseline IBI for rabbits in the cholesterol + copper, cholesterol, copper and control groups during CS-alone Habituation trials on Day 1 and during CS-alone test trials on Days 1 and 2 and on Days 3-8 following Post Test 1. Baseline IBIs are derived from the electrocardiogram (ECG) recorded 2,000 ms before CS-onset and IBIs to the CS are derived from the ECG recorded for 2,000 ms after CS onset.
Analysis of variance of mean change in IBI from baseline on CS-alone trials during Habituation revealed no significant differences between the groups, largest F < 1.58. Analysis of mean change in IBI from baseline on CS-alone trials during Habituation compared to mean change in IBI from baseline on CS-alone trials during the CS-US pairings phase of Day 1 revealed a main effect of pairings, F(1,36) = 27.75, p < .001, but no main effect or interaction of cholesterol or copper, F's < 1.26. In contrast, analysis of mean change in IBI from baseline on CS-alone trials during Habituation compared to CS-alone trials during CS-US pairings on Day 2 revealed main effects of cholesterol, F(1,36) = 5.76, p < .05, and pairings, F(1,36) = 20.91, p < .001, as well as an interaction of pairings and cholesterol, F(1,36) = 4.55, p < .05. Across each of the remaining days of CS-US pairings following Post Test 1 there was a significant level of HR conditioning, smallest F = 6.96, p < .05, but there was only a main effect of cholesterol on Day 3, F(1,36) = 4.40, p < .05, and no further main effects or interactions on any of the remaining days, largest F(1,36) = 3.29 p > .07. In sum, rabbits showed HR conditioning and, at asymptote, cholesterol-fed rabbits produced higher levels of HR conditioning than controls.
HR CRM
Examination of mean change in IBI to the US from baseline on the first 20 trials of Pretest and Post Test 1 confirmed previous HR CRM research showing that there was little change from baseline in the rabbit IBI to US intensities below 1 mA (Schreurs et al., 2005). Consequently, Figure 2 depicts mean change in IBI from baseline to 1- and 2-mA US intensities collapsed across US durations on Pretest and Post Test 1 for the four groups. The figure shows that there was a modest decrease in the IBI from baseline to the US on Pretest indicating an increase in HR and an increase in the IBI from baseline for the cholesterol group on the Post Test 1 indicating a decrease in HR. This was confirmed by main effects of test (Pretest vs. Post Test 1), F(1,36) = 7.17, p < .05, and cholesterol, F(1,36) = 5.122, p < .05, and an interaction of US intensity and test, F(1,36) = 4.81, p < .05. The effects are more clearly illustrated in the four panels and inset of Figure 3 in which the average topographies of the change in IBI from baseline for each group on Pretest (dotted line) and Post Test 1 (solid line) to the 2-mA US values in Figure 2 are shown as a function of time. In particular, all four panels show that on Pretest there is a decrease in mean IBI to the US from baseline (HR acceleration). However, only rabbits in the cholesterol group (top right panel) had a strong initial increase in IBI from baseline to the US on Post Test 1 indicating strong HR CRM previously reported by Schreurs et al. (2005). This strong increase in IBI from baseline is illustrated in the inset of Figure 3 which shows the ECG records for a single trial to a 2-mA US on Pretest (top) and Post Test 1 (bottom) for a rabbit in the cholesterol group. There is an unmistakable increase in the IBI following the US on Post Test 1 (i.e., HR CRM), particularly on the first two heart beats after the US where the change in IBI is almost double the Pretest and Post Test 1 baseline intervals. It is interesting to note that this facilitative effect of cholesterol on HR CRM is absent in the cholesterol + copper group.
Figure 2.
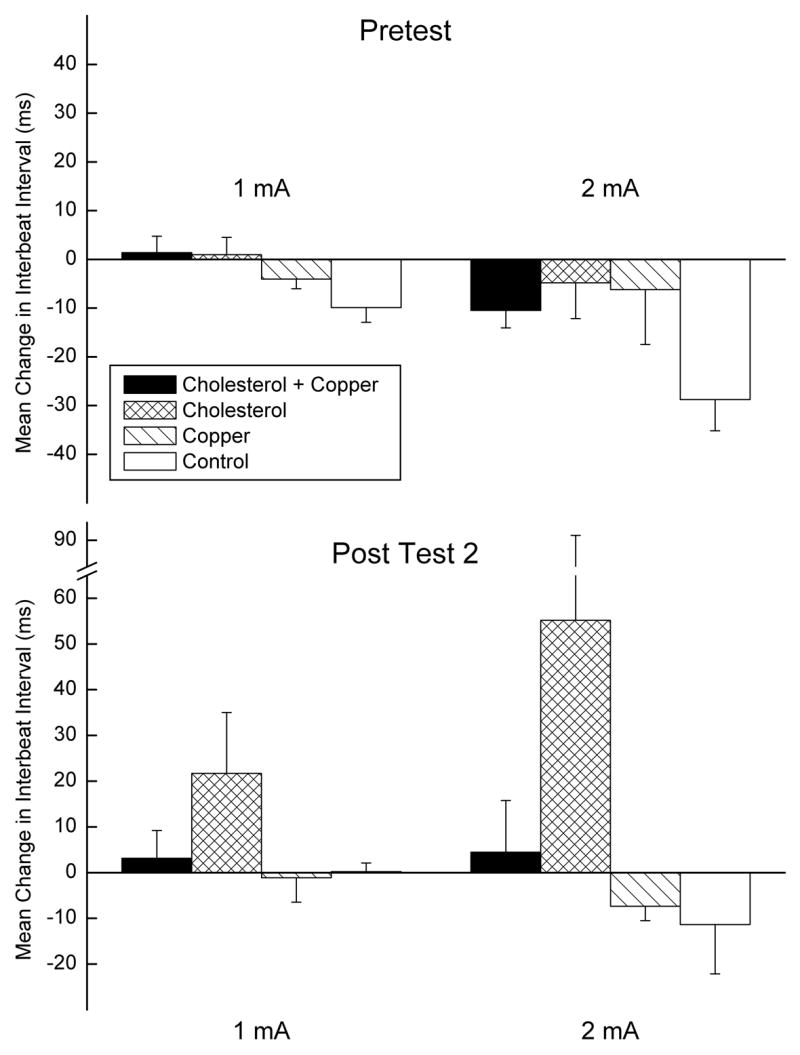
Mean (± SEM) change in interbeat interval (IBI) from the average pre-stimulus baseline IBI to the 1- and 2-mA unconditioned stimulus (US) values on the first twenty trials of Pretest and the first twenty trials of Post Test 1 for the cholesterol + copper, cholesterol, copper and control groups. Baseline IBIs are derived from the electrocardiogram (ECG) recorded 2,000 ms before US-onset and IBIs to the US are derived from the ECG recorded for 2,000 ms after US onset.
Figure 3.
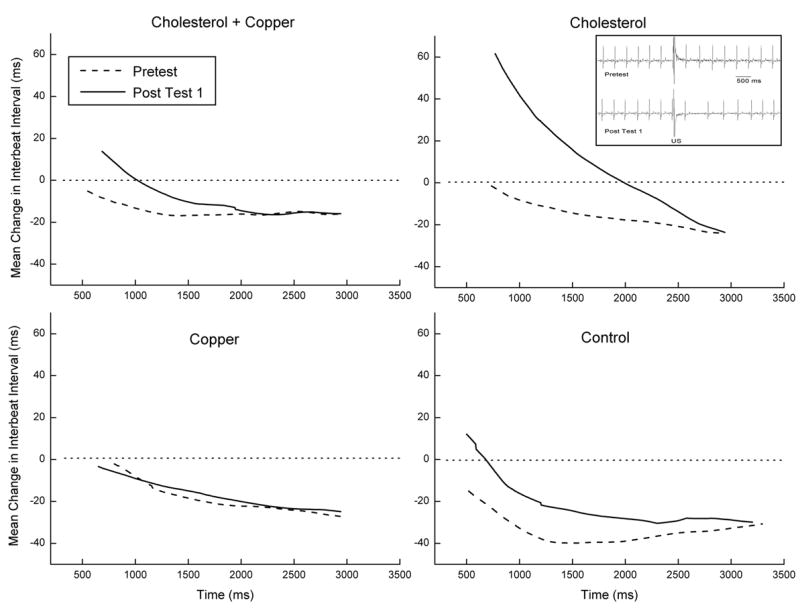
Average topographies of the change in interbeat interval (IBI) from the pre-stimulus baseline IBI for the cholesterol + copper, cholesterol, copper and control groups on Pretest (dotted line) and Post Test 1 (solid line) to the 2-mA unconditioned stimulus (US) values in Figure 2 are shown as a function time. The inset shows ECG records for a single trial to a 2-mA US on Pretest (top) and Post Test 1 (bottom) for a rabbit in the cholesterol group.
Figure 4 depicts the mean change in PQ interval from baseline following US presentation on Pretest and Post Test 1 at the 1- and 2-mA US intensities collapsed across US duration for rabbits in the four groups. The figure shows that there was an increase in the PQ interval for rabbits in the cholesterol group that corresponds to the increase in IBI from baseline seen in Figure 2. Although there were no overall significant effects of PQ interval as a function of cholesterol or copper (largest F = 3.88, p < .06), there was a significant difference in PQ interval between Pretest and Post Test 1 for the cholesterol group (p < .05). We have shown previously that PQ interval is highly correlated with the strength of HR CRM (Schreurs et al., 2005), and the present increase in PQ interval for the cholesterol group suggests the strongest HR CRM occurred in the cholesterol group. We have also shown that CRM is a function of the strength of conditioning (Schreurs et al., 1995; Seager et al., 2003), and the significant HR CRM and increased PQ interval provide indirect evidence that the strongest HR conditioning occurred in the cholesterol group. In fact, the data suggest that the addition of copper to the cholesterol diet may have weakened the facilitating effect of cholesterol on HR CRM.
Figure 4.
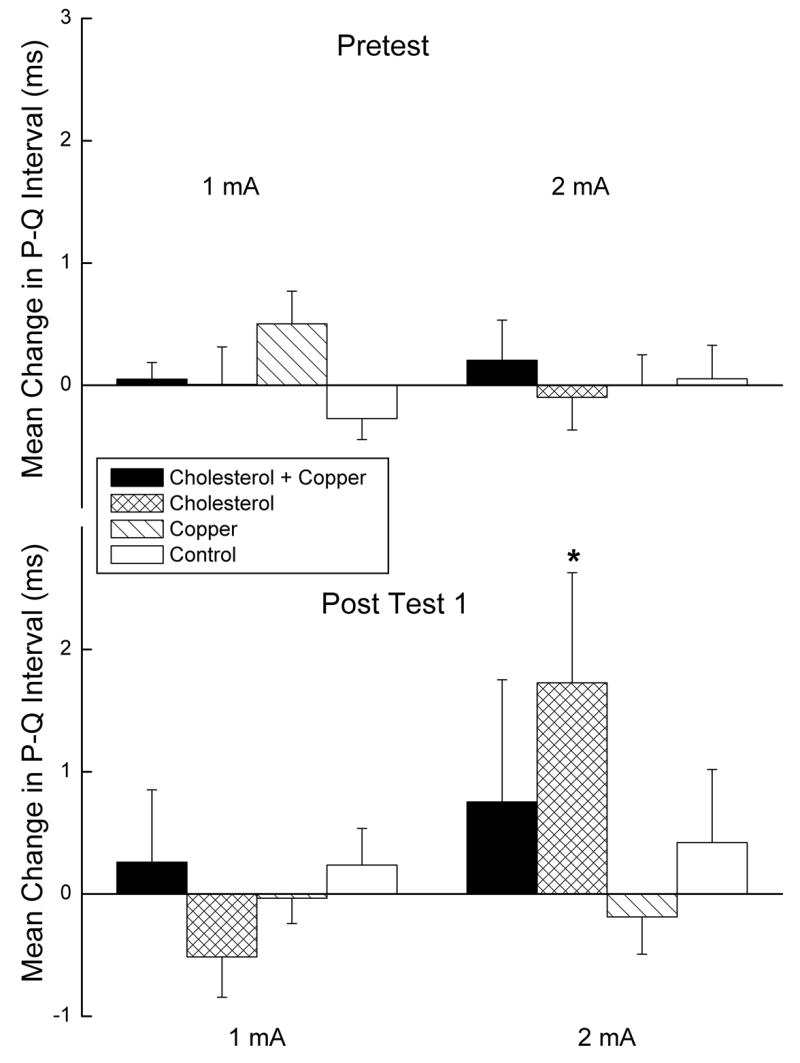
Mean change in PQ interval from the pres-stimulus baseline PQ interval following unconditioned stimulus (US) presentation for the first twenty trials of Pretest and Post Test 1 at the 1- and 2-mA US intensities collapsed across US duration for rabbits in the cholesterol + copper, cholesterol, copper and control groups. PQ intervals are derived from the PQRST waveforms in the electrocardiogram recorded from 2,000 ms before US-onset to 2,000 ms after US onset.
In contrast to the data in Figure 3, where a significant difference in IBI from baseline between Pretest and Post Test 1 is of the order of 60 ms (cholesterol group), examination of mean change in IBI from baseline between the first 20 trials of Pretest and Post Test 2 revealed that the largest difference for any group was less than 11 ms (data not shown). This minimal Post Test 2 change in IBI from baseline shows that there was no evidence of HR CRM after the levels of HR conditioning decreased across the final days of CS-US pairings, and thus lends further support to other observations that CRM is a function of the strength of conditioning (Schreurs et al., 1995; Seager et al., 2003).
NMR Conditioning
Figure 5 shows mean percent conditioned NMRs (CRs) to the CS for rabbits in the four groups during CS-alone Habituation trials on Day 1 and during CS-alone test trials on Days 1 and 2 and on Days 3-8 following Post Test 1. The figure shows very clear acquisition of NMR conditioning in all four groups as a function of days with the copper group showing higher levels of responding than the remaining groups. In fact, the copper group appears to show higher levels of responding across all phases of the experiment. Analysis of mean percent CRs during Habituation revealed significant main effects of copper, F(1,36) = 5.72, p < .05, and cholesterol, F(1,36) = 4.64, p < .05, and an interaction of copper and cholesterol, F(1,36) = 5.71, p < .05. There was a suggestion of a main effect of cholesterol on Days 1 and 2, F(1,36) = 4.03, p < .06, but no other main effects or interactions, F's < 1. In contrast, as CS-US pairings continued on Days 3-8, a main effect of cholesterol emerged, F(1,36) = 4.61, p < .05, as well as an effect of days, F(5,180) = 28.64, p < .001, confirming the lower level of conditioning in the two cholesterol groups relative to the copper group. Indeed, there was a main effect of copper on Day 3, F(1,36) = 6.49, p < .05, confirming the higher level of CR acquisition by rabbits in the copper group.
Figure 5.
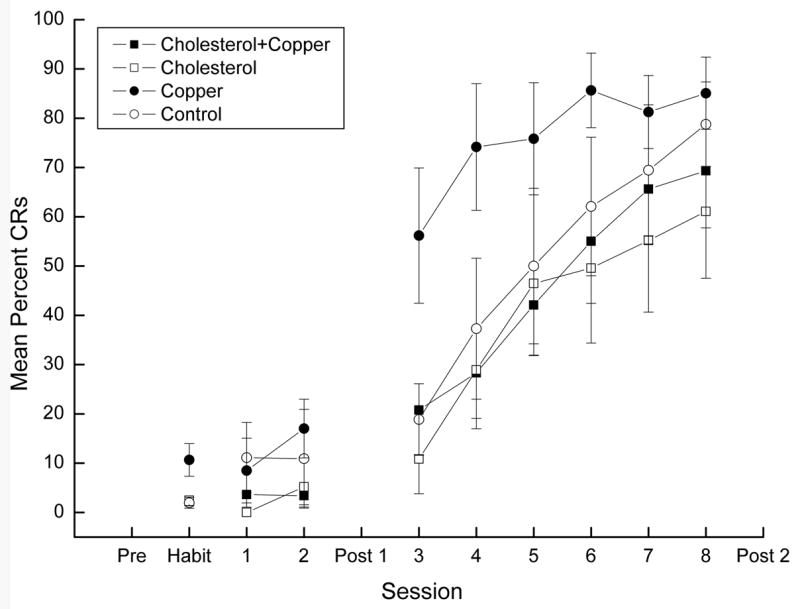
Mean percent conditioned nictitating membrane responding (CRs) to the conditioned stimulus (CS) for rabbits in the cholesterol + copper, cholesterol, copper and control groups during CS-alone Habituation trials on Day 1 and during CS-alone test trials on Days 1 and 2 and on Days 3-8 following the Post Test 1. Nictitating membrane responding was recorded over a 2,000-ms interval comprised of a 200-ms pre-stimulus baseline and a 1,800-ms interval after CS-onset.
NMR CRM
Figure 6 shows averaged NMR topographies and Figure 7 shows average NM UR frequency, magnitude and magnitude of the area for the four groups on the first 20 trials of Pretest and on the first 20 trials of Post Test 2 across five US intensities collapsed across US duration. Examination of the figures shows two main findings. First, NMRs on Pretest were generally smaller in the cholesterol groups than in the copper and control groups. Second, there was an increase in the size of responses following eight days of CS-US pairings in the cholesterol groups suggestive of NMR CRM (Schreurs, 2003) and a decrease in the size of responses in the copper and control groups particularly at the higher US intensities of 1 and 2 mA. These observations were corroborated by analyses of NM UR magnitude and magnitude of the UR area. Analysis of UR magnitude yielded a significant main effect of cholesterol, F(1,36) = 5.81, p <.05, and US intensity, F(4,144) = 206.67, p <.001, as well as interactions of US intensity and test, F(4,144) = 4.97, p < .01, and cholesterol with US intensity and test, F(4,144) = 6.77, p < .001. Analysis of magnitude of the UR area yielded significant main effects of cholesterol, F(1,36) = 7.22, p < .05, copper, F(1,36) = 4.77, p < .05, and US intensity, F(4,144) = 42.21, p < .001 as well as interactions of US intensity and copper, F(4,144) = 2.80, p < .05, US intensity and test, F(4, 144) = 3.92, p < .01, and cholesterol with US intensity and test, F(4, 144) = 3.64, p < .01. Finally, analysis of UR frequency yielded main effects of US intensity, F(4,144) = 370.76, p < .001, and test (Pretest vs. Post Test 2), F(1,36) = 6.22, p < .05, and an interaction of US intensity and test, F(4,144) = 2.97, p < .05.
Figures 6.
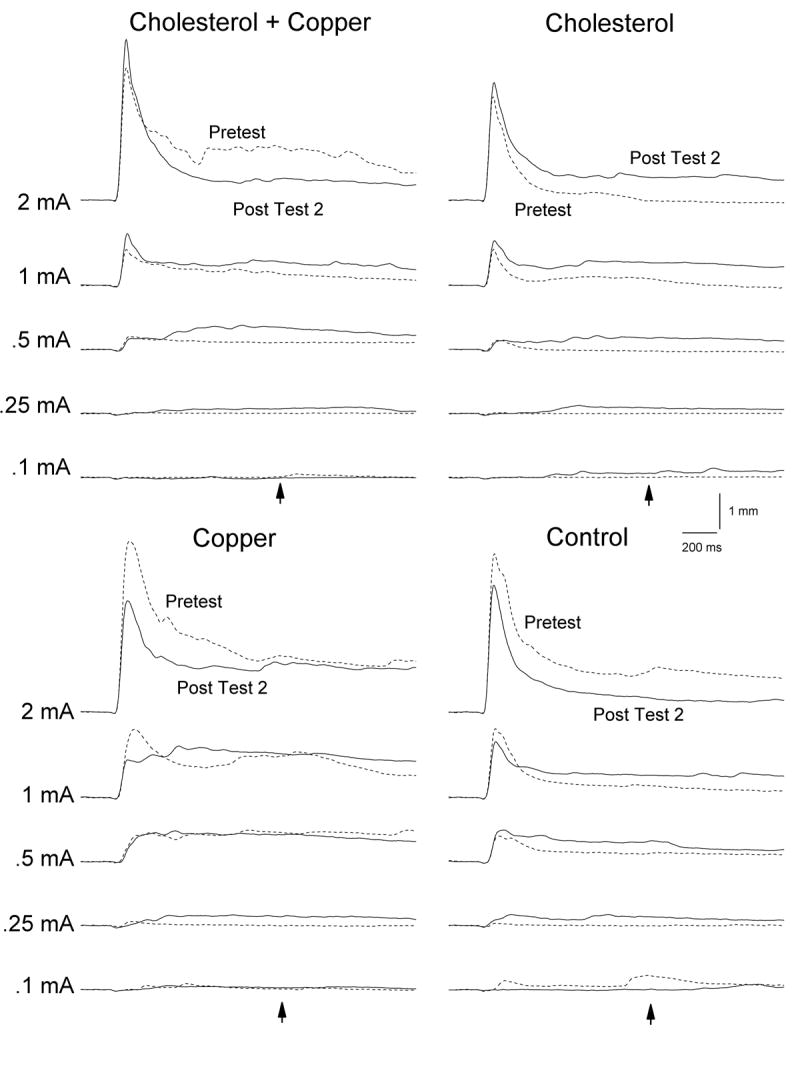
Average nictitating membrane response (NMR) topographies for the cholesterol + copper, cholesterol, copper and control groups on the first 20 trials of Pretest and on the first 20 trials of Post Test 2 across five unconditioned stimulus (US) intensities collapsed across US duration. The point in time when the US would have occurred had the US-alone test trial been a paired trial (1,000 ms from stimulus onset) is shown by the arrows. Nictitating membrane responding was recorded over a 2,000-ms interval comprised of a 200-ms pre-stimulus baseline and a 1,800-ms interval after US-onset.
Figure 7.
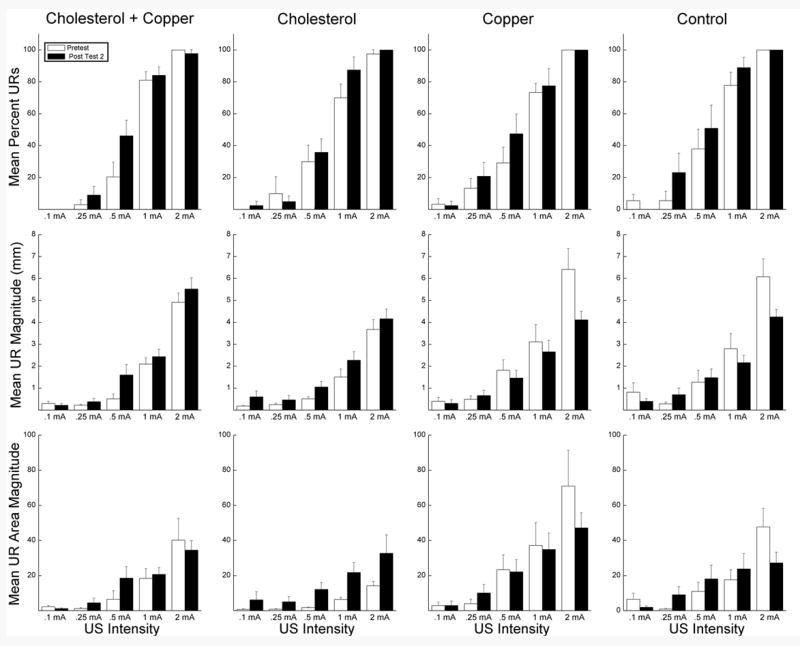
Average unconditioned nictitating membrane response (UR) frequency, magnitude and magnitude of the UR area on the first 20 trials of Pretest and on the first 20 trials of Post Test 2 across five unconditioned stimulus (US) intensities collapsed across US duration for the cholesterol + copper, cholesterol, copper and control groups. Nictitating membrane responding was recorded over a 2,000-ms interval comprised of a 200-ms pre-stimulus baseline and a 1,800-ms interval after US-onset.
Further examination of Figure 6 shows a significant shift in the topography of NMRs from Pretest to Post Test 2 across the four groups. At the intermediate US intensities, responses on Post Test 2 tended to be more complex than responses on Pretest with extension of the NM continuing well beyond US onset even to the point in time when the US would have occurred had the US-alone test trial been a paired trial (1,000 ms from stimulus onset, arrow). Analysis of skew and kurtosis of the averaged responses confirmed the general shift in the topography from Pretest to Post Test 2 with skew changing from generally positive values on Pretest to strongly negative values on Post Test 2 (Table 1). For example, although skew values for responses to US intensities between .25 and 1 mA for the cholesterol group and the control group in Figure 6 were as high as 20.6 on Pretest, they were uniformly negative on Post Test 2 ranging from -1.7 to -15.8. Kurtosis values were more variable but also showed a clear trend toward becoming smaller and even negative on Post Test 2. For example, kurtosis values for the cholesterol and control groups were as high as 29.2 on Pretest but decreased to values as negative as -3.9 on Post Test 2. In contrast, with the exception of skew at 0.25 mA and 0.1 mA, skew and kurtosis values for the copper group did not change a great deal from Pretest to Post Test 2.
Table 1.
Analyses of skew and kurtosis of NMR UR topographies on Pretest and Post Test 2.
| Skew | ||||||||
|---|---|---|---|---|---|---|---|---|
| Cholesterol + Copper | Cholesterol | Copper | Control | |||||
| Intensity | Pretest | Post Test 2 | Pretest | Post Test 2 | Pretest | Post Test 2 | Pretest | Post Test 2 |
| 2 | + | ++ | ++ | ++ | + | ++ | ++ | |
| 1 | + | − | ++ | − | − | − − | ++ | − |
| .5 | − | − | ++ | − | − − | − − | + | − |
| .25 | − − | − | − | ++ | − − | + | − | |
| .1 | + | − | − | + | − | + | ++ | |
|
| ||||||||
| Kurtosis | ||||||||
| 2 | ++ | + | ++ | ++ | + | ++ | ++ | ++ |
| 1 | ++ | + | ++ | + | + | + | ++ | ++ |
| .5 | + | ++ | + | + | + | + | ||
| .25 | − | ++ | ++ | − | ++ | + | ++ | + |
| .1 | + | ++ | − | + | + | |||
+ single and ++ double digit significant positive skew or kurtosis; − single and − − double digit significant negative skew or kurtosis.
Histology
Figure 8 shows mean number and Figure 9 shows representative examples of beta amyloid immunoreactive (labeled) cells in the cortex, hippocampus, and amygdala of rabbits for the four groups. Examination of Figure 8 shows the highest overall numbers of beta amyloid immunoreactive cells were in the cortex with lower numbers in the amygdala and hippocampus. More importantly, the figure shows a clear difference in the numbers of beta amyloid labeled cells between the two cholesterol groups and both the copper and control groups. In addition, there appears to be a marginal increase in the number of beta amyloid immunoreactive cells in the cholesterol group as a result of adding copper to the drinking water. Finally, there was no evidence of extracellular plaque-like structures in the cortex, hippocampus or amygdala.
Figure 8.
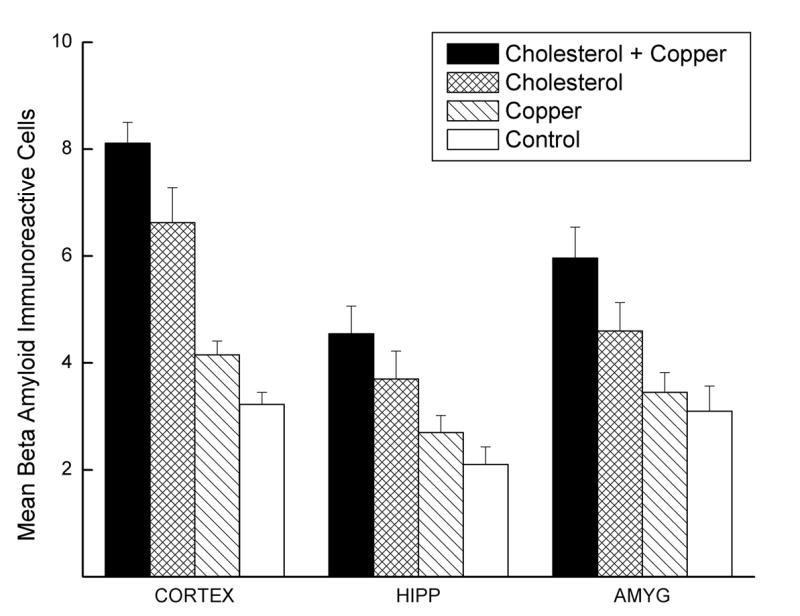
Mean number beta amyloid immunoreactive (labeled) cells in the cortex, hippocampus (HIPP), and amygdala (AMYG) of rabbits from the cholesterol + copper, cholesterol, copper and control groups. The numbers were based on an average of at least four separate counts of the number of cells in a 0.5 × 0.5 mm square grid. The cells were counted by an investigator (G.S.) who was blind to the treatment of the rabbits.
Figure 9.
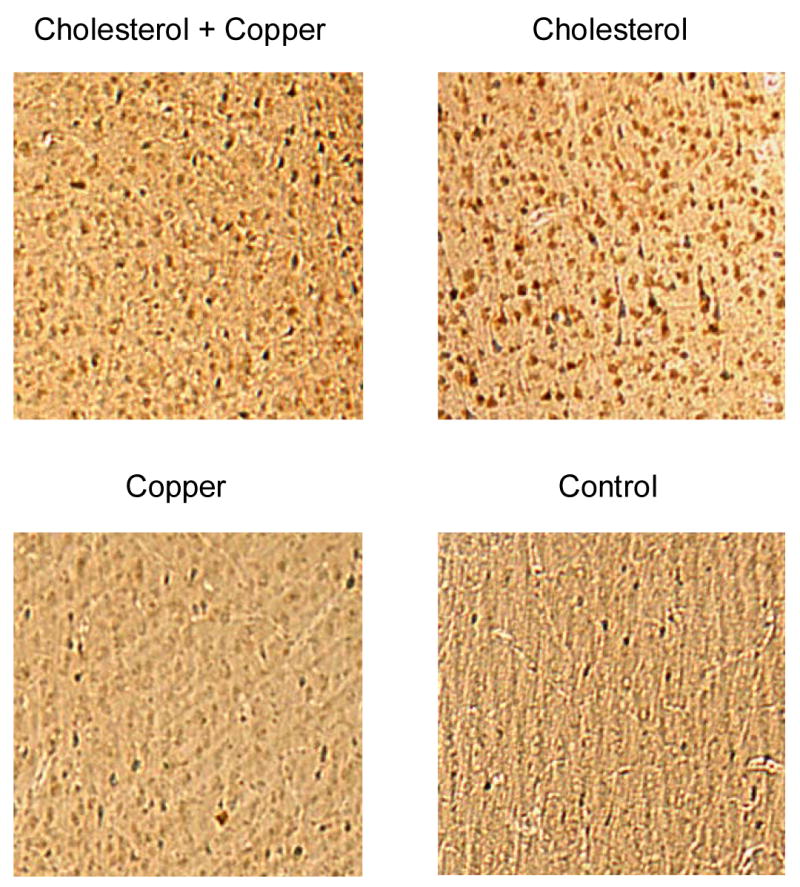
Low power photomicrographs of representative beta amyloid immunoreactive (labeled) cells in the cortex of a rabbit from the cholesterol + copper, cholesterol, copper and control groups. Each photomicrograph is 0.5 × 0.5 mm and depicts the size of the grid used to count the number of immunoreactive cells shown in Figure 8.
Analysis of the number of beta amyloid labeled cells revealed main effects of cholesterol, F(1,37) = 92.63, p < .001, copper, F(1,37) = 13.07, p < .01, and anatomical site F(2,74) = 31.70, p < .001, as well as an interaction of cholesterol and anatomical site, F(2,74) = 6.91, p < .01. Tukey LSD post hoc comparisons of the number of labeled cells in the cortex revealed that the number of labeled cells was higher in the two cholesterol groups than in the copper and control groups (p's ≤.001), marginally different between the cholesterol groups (p = .05), and no different between the copper and control groups (p = .37). The only significant between-group differences in labeled cells in the hippocampus and amygdala were between the cholesterol + copper group and the control group (p's < .05).
Discussion
The principal finding of the current experiment was that rabbits fed cholesterol showed facilitated HR conditioning and HR CRM. There was a suggestion that addition of 0.12 PPM copper to water given cholesterol-fed rabbits may have attenuated the facilitative effects of cholesterol on HR CRM. In contrast, although cholesterol did not affect classical conditioning of the NMR, it did facilitate NMR CRM. The cholesterol diet elevated the number of beta amyloid immunoreactive neurons in the cortex, hippocampus and amygdala, and the addition of copper to the cholesterol diet increased the number of beta amyloid immunoreactive neurons in the cortex still further but did not result in plaque-like structures.
We have previously shown that cholesterol can enhance NMR conditioning and CRM in the absence of plaque-like structures (Schreurs et al., 2003; Sparks & Schreurs, 2003), and the present results extend this finding to HR conditioning and HR CRM. Consequently, cholesterol has been shown to enhance learning and reflex facilitation in two different response systems – one skeletal and the other autonomic. A recent report has also shown that feeding cholesterol to young, normal rats improves learning in the Morris water maze (Dufour, Liu, Gusev, Alkon, & Atzori, 2006). Given that dietary cholesterol does not cross the blood brain barrier in any appreciable amount (Bjorkhem & Meaney, 2004; Dietschy & Turley, 2001; Dietschy & Turley, 2004; Tuma & Hubbard, 2003), it remains to be determined how heart rate conditioning, which is controlled in part by the amygdala via the dorsal motor nucleus of the vagus, was increased as a result of a cholesterol-rich diet. The same would be true for the effects of cholesterol on rat water maze learning (Dufour et al., 2006) and previous research showing that addition of cholesterol to the diet of animals deficient in cholesterol or animals that have cholesterol synthesis blocked reverses learning and memory deficits (Endo, Nishimura, & Kimura, 1996; O'Brien et al., 2002; Voikar, Rauvala, & Ikonen, 2002; Xu et al., 1998).
One possibility is that cholesterol metabolites that can cross the blood brain barrier, particularly 27-hydroxcholesterol, may have had some influence on learning (Heverin et al., 2005). There is some evidence, albeit indirect, for the involvement of 27-hydroxycholesterol in learning and memory because levels of this oxysterol are significantly reduced in patients with mild cognitive impairment, Alzheimer's disease and vascular dementia (Kolsch et al., 2004). Another possibility is that there are nervous system mechanisms that attempt to compensate for the deleterious effects of the cholesterol diet on the cardiovascular system (Bocan, 1998). For example, monkeys show a strong relationship between cholesterol-induced atherosclerosis and fear-elicited heart rate changes that are mediated at least in part by the sympathetic nervous system (Manuck, Kaplan, & Clarkson, 1983; Rozanski, Blumenthal, & Kaplan, 1999).
The addition of copper to elevated levels of cholesterol has been shown to increase the number and density of beta amyloid containing neurons in rabbits, beagles and transgenic mice (Sparks et al., 2006). Copper has been argued to alter the clearance of beta amyloid from the brain and may play a role in Alzheimer's disease (Bayer et al., 2006; Bush, Masters, & Tanzi, 2003; Cerpa, Varela-Nallar, Reyes, Minniti, & Inestrosa, 2005; Maynard, Bush, Masters, Cappai, & Li, 2005; Sparks et al., 2006). In fact, copper was found to be one of the constituents of beta amyloid plaques (Lovell, Robertson, Teesdale, Campbell, & Markesbery, 1998) and beta amyloid has been argued to sequester copper in the brain (Robinson & Bishop, 2002). Interestingly, it is only with the appearance of plaque-like structures that learning is retarded in classical conditioning of the rabbit NMR. Consequently, the presence of these plaque-like structures may be a necessary condition for the cholesterol-fed rabbit to serve as an animal model of Alzheimer's disease. The conditions required for the formation of plaque-like structures above and beyond the feeding of cholesterol and copper remain to be determined.
The significant increase in the number of beta amyloid immunoreactive neurons that resulted from the cholesterol diet suggests a role for intracellular beta amyloid in learning and memory. Indeed, there is good evidence for the normal function of beta amyloid in cellular processes (Plant, Boyle, Smith, Peers, & Pearson, 2003) and in fact, beta amyloid modulates potassium channels (Plant et al., 2005) – an important mediator of many forms of learning and memory (Giese et al., 1998; Nelson, Schreurs, & Alkon, 1999; Schrader, Anderson, Varga, Levy, & Sweatt, 2002; Schreurs, Gusev, Tomsic, Alkon, & Shi, 1998). It is certainly possible that by increasing the level of beta amyloid, the cholesterol diet facilitated HR conditioning by modulating cellular potassium channels and affecting neuronal excitability – a mechanism known to be involved in learning and memory (Johnston et al., 2003; Xu & Kang, 2005; Zhang & Linden, 2003).
On the other hand, there is considerable evidence that beta amyloid is correlated with deficits in learning and memory. Beta amyloid has been shown to retard learning both in plaque (Chen et al., 2000; Morgan, 2003; Sparks & Schreurs, 2003) and soluble form (Koistinaho et al., 2001). Triple knockout transgenic mice that develop beta amyloid plaques, neurofibrillary tangles and tau protein pathology show age-related deficits in spatial learning in the Morris water maze that correlate with accumulation of intraneuronal beta amyloid prior to the appearance of beta amyloid plaques or tangle pathology (Billings, Oddo, Green, McGaugh, & LeFerla, 2005). Ewers and colleagues have reported that in an amyloid precursor protein+presenilin1 double knockout mice, the level of eyeblink conditioning using an electrodermal US was no different from controls, but was inversely related to the beta amyloid burden (Ewers, Morgan, Gordon, & Woodruff-Pak, 2005).
The previously described facilitation of rabbit NMR conditioning as a result of a cholesterol diet occurred in a trace conditioning paradigm in which a 100-ms tone was presented 800 ms before an air puff US. The conditioning procedures used in the current experiment were somewhat different in that they involved a 100-ms tone presented 1,000 ms before an electrodermal US. In addition, there were 30 CS-alone habituation trials before the CS-US pairings – conditions designed to maximize the likelihood of observing HR conditioning but also known to yield only modest levels of NMR conditioning (Powell & Kazis, 1976; Schneiderman, 1972; Schreurs et al., 2005). The slow rate and less than maximal levels of NMR conditioning in the current experiment are the result of these suboptimal NMR conditioning parameters (Kehoe & Macrae, 2002) as well as a complex procedure involving additional CS-alone (Habituation and test trials) and US-alone (Post Test 1) trials. In fact, when electrodermal stimulation was used as the US in the Schreurs et al. (2003) study, there were also no differences in the rate or level of NMR conditioning between cholesterol-fed rabbits and controls. Nevertheless, cholesterol did seem to have facilitated NMR CRM in the present experiment. This is a finding of some interest because of the more modest levels of conditioning in the present experiment – levels that might not otherwise have yielded CRM (Schreurs et al., 1995; Seager et al., 2003).
A surprising finding in the NMR conditioning data was the significantly higher levels of conditioning that occurred in the copper group. This was certainly not the case with HR conditioning. Given the low but still significantly higher level of NMRs to the tone during habituation, it is possible that there may have been a nonassociative effect of copper when added to the drinking water. There is some precedent for other compounds having nonassociative effects on the rabbit NMR including 4-aminopyridine that was found to increase sensitivity to tone and air puff (Wang, Darwish, & Schreurs, 2006) and a serotonin antagonist that was found to reduce sensitivity to air puff (Welsh, Romano, & Harvey, 1998). The only animal model of altered copper levels in the brain is the Long-Evans Cinnamon rat that shares many of the pathological and biological characteristics of Wilson's disease, a genetic disorder of copper metabolism in which copper accumulates in the body. These rats show significantly elevated levels of locomotor activity and decreased habituation to startle consistent with the present results (Fujiwara et al., 2006).
Acknowledgments
This research was supported by funds from the National Institutes of Health AG023211 (BGS, DLS) and the Maier Foundation (BGS). We thank Roger Bell and Mark Chapman for help with the analysis of the PQ intervals.
Footnotes
Publisher's Disclaimer: This is a PDF file of an unedited manuscript that has been accepted for publication. As a service to our customers we are providing this early version of the manuscript. The manuscript will undergo copyediting, typesetting, and review of the resulting proof before it is published in its final citable form. Please note that during the production process errors may be discovered which could affect the content, and all legal disclaimers that apply to the journal pertain.
Reference List
- Ayers ED, Powell DA. Multiple response measures during classical conditioning. Journal of Neuroscience Methods. 2002;114:33–38. doi: 10.1016/s0165-0270(01)00505-2. [DOI] [PubMed] [Google Scholar]
- Bayer TA, Schafer S, Breyhan H, Wirths O, Treiber C, Multhaup G. A vicious circle: role of oxidative stress, intraneuronal Aβ and Cu in Alzheimer's disease. Clinical Neuropathology. 2006;25:163–171. [PubMed] [Google Scholar]
- Berntson GG, Bigger JT, Jr, Exkberg DL, Grossman P, Kaufmann PG, Malik M, et al. Heart rate variability: origins, methods, and interpretive caveats. Psychophysiology. 1997;34:623–648. doi: 10.1111/j.1469-8986.1997.tb02140.x. [DOI] [PubMed] [Google Scholar]
- Berntson GG, Cacioppo JT, Quigley KS. The metrics of cardiac chronotropism: biometric perspectives. Psychophysiology. 1995;32:162–171. doi: 10.1111/j.1469-8986.1995.tb03308.x. [DOI] [PubMed] [Google Scholar]
- Billings LM, Oddo S, Green KN, McGaugh JL, LeFerla FM. Intraneuronal Aβ causes the onset of early Alzheimer's disease-related cognitive deficits in transgenic mice. Neuron. 2005;45:675–688. doi: 10.1016/j.neuron.2005.01.040. [DOI] [PubMed] [Google Scholar]
- Bjorkhem I, Meaney S. Brain cholesterol: long secret life behind a barrier. Arteriosclerosis, Thrombosis and Vascular Biology. 2004;24:1–11. doi: 10.1161/01.ATV.0000120374.59826.1b. [DOI] [PubMed] [Google Scholar]
- Bocan TMA. Animal models of atherosclerosis and interpretation of drug intervention. Current Pharmaceutical Design. 1998;4:37–52. [PubMed] [Google Scholar]
- Buck DL, Seager MA, Schreurs BG. Conditioning-specific reflex modification of the rabbit (Oryctolagus cuniculus) nictitating membrane response: generality and nature of the phenomenon. Behavioral Neuroscience. 2001;115:1039–1047. [PubMed] [Google Scholar]
- Bush AI, Masters CL, Tanzi RE. Copper, β-amyloid, and Alzheimer's disease: tapping a sensitive connection. Proceedings of the National Academy of Sciences, USA. 2003;100:11193–11194. doi: 10.1073/pnas.2135061100. [DOI] [PMC free article] [PubMed] [Google Scholar]
- Cerpa W, Varela-Nallar L, Reyes AE, Minniti AN, Inestrosa NC. Is there a role for copper in neurodegenerative diseases? Molecular Aspects of Medicine. 2005;26:405–420. doi: 10.1016/j.mam.2005.07.011. [DOI] [PubMed] [Google Scholar]
- Chen G, Chen KS, Knox J, Inglis J, Bernard A, Martin SJ, et al. A learning deficit related to age and β-amyloid plaques in a mouse model of Alzheimer's disease. Nature. 2000;408:975–979. doi: 10.1038/35050103. [DOI] [PubMed] [Google Scholar]
- Coleman SR, Gormezano I. Classical conditioning of the rabbit's (Oryctolagus cuniculus) nictitating membrane response under symmetrical CS-US interval shifts. Journal of Comparative and Physiological Psychology. 1971;77:447–455. doi: 10.1037/h0031879. [DOI] [PubMed] [Google Scholar]
- Dietschy JM, Turley SD. Cholesterol metabolism in the brain. Current Opinion in Lipidology. 2001;12:105–112. doi: 10.1097/00041433-200104000-00003. [DOI] [PubMed] [Google Scholar]
- Dietschy JM, Turley SD. Cholesterol metabolism in the central nervous sytem during early development and in the mature animal. Journal of Lipid Research. 2004;45:1375–1397. doi: 10.1194/jlr.R400004-JLR200. [DOI] [PubMed] [Google Scholar]
- Dufour F, Liu QY, Gusev P, Alkon DL, Atzori M. Cholesterol-enriched diet affects spatial learning and synaptic function in hippocampal synapses. Brain Research. 2006;1103:88–98. doi: 10.1016/j.brainres.2006.05.086. [DOI] [PubMed] [Google Scholar]
- Endo Y, Nishimura JI, Kimura F. Impairment of maze learning in rats following long-term glucocorticoid treatments. Neuroscience Letters. 1996;203:199–202. doi: 10.1016/0304-3940(95)12296-6. [DOI] [PubMed] [Google Scholar]
- Ewers M, Morgan DG, Gordon MN, Woodruff-Pak DS. Associative and motor learning in 12-month-old transgenic APP+PS1 mice. Neurobiology of Aging. 2005:1–11. doi: 10.1016/j.neurobiolaging.2005.05.019. IN PRESS. [DOI] [PubMed] [Google Scholar]
- Fan J, Watanabe T. Cholesterol-fed and transgenic rabbit models for the study of atherosclerosis. Journal of Atherosclerosis and Thrombosis. 2000;7:26–32. doi: 10.5551/jat1994.7.26. [DOI] [PubMed] [Google Scholar]
- Finking G, Hanke H. Nikolaj Nicolajewisch Anitschkow (1885-1964) established the cholesterol-fed rabbit as a model for atherosclerosis research. Atherosclerosis. 1997;135:1–7. doi: 10.1016/s0021-9150(97)00161-5. [DOI] [PubMed] [Google Scholar]
- Fujiwara N, Iso H, Kitanaka N, Kitanaka J, Eguchi H, Ookawara T, et al. Effects of copper metabolism on neurological functions in Wistar and Wilson's disease models. Biochemical and Biophysical Research Communications. 2006;349:1079–1086. doi: 10.1016/j.bbrc.2006.08.139. [DOI] [PubMed] [Google Scholar]
- Ghribi O, Larsen B, Schrag M, Herman MM. High cholesterol content in neurons increases BAC, β-amyloid, and phosphorylated tau levels in rabbit hippocampus. Experimental Neurology. 2006;200:460–467. doi: 10.1016/j.expneurol.2006.03.019. [DOI] [PubMed] [Google Scholar]
- Giese KP, Storm JF, Reuter D, Fedorov NB, Shao LR, Leichter T, et al. Reduced K+ channel inactivation, spike broadening, and after-hyperpolarization in Kvβ1.1-deficient mice with impaired learning. Learning & Memory. 1998;5:257–273. [PMC free article] [PubMed] [Google Scholar]
- Gormezano I. Classical conditioning. In: Sidowski JB, editor. Experimental methods and instrumentation in psychology. New York: McGraw-Hill; 1966. pp. 385–420. [Google Scholar]
- Gormezano I, Gibbs CM. Transduction of the rabbit's nictitating membrane response. Behavior Research Methods, Instruments, & Computers. 1988;20:18–21. [Google Scholar]
- Gracia KS, Mauk MD, Weidemann G, Kehoe EJ. Covariation of alternative measures of responding in rabbit (Oryctolagus cuniculus) eyeblink conditioning during acquisition training and tone generalization. Behavioral Neuroscience. 2003;117:292–303. doi: 10.1037/0735-7044.117.2.292. [DOI] [PubMed] [Google Scholar]
- Gruart A, Yeo CH. Cerebellar cortex and eyeblink conditioning: bilateral regulation of conditioned responses. Experimental Brain Research. 1995;104:431–448. doi: 10.1007/BF00231978. [DOI] [PubMed] [Google Scholar]
- Hayes E, Pugsley MK, Penz WP, Adaikan G, Walker MJA. Relationship between QaT and RR intervals in rats, guinea pigs, rabbits, and primates. Journal of Pharmacological and Toxicological Methods. 1994;32:201–207. doi: 10.1016/1056-8719(94)90088-4. [DOI] [PubMed] [Google Scholar]
- Heverin M, Meaney S, Lutjohann D, Diczfalusy U, Wahren J, Bjorkhem I. Crossing the barrier: net flux of 27-hydroxycholesterol into the human brain. Journal of Lipid Research. 2005;46:1047–1052. doi: 10.1194/jlr.M500024-JLR200. [DOI] [PubMed] [Google Scholar]
- Johnston D, Christie BR, Frick A, Gray R, Hoffman DA, Schexnayder LK, et al. Active dendrites, potassium channels and synaptic plasticity. Philosophical Transactions of the Royal Society London B. 2003;358:667–674. doi: 10.1098/rstb.2002.1248. [DOI] [PMC free article] [PubMed] [Google Scholar]
- Kehoe EJ, Macrae M. Fundamental behavioral methods and findings in classical conditioning. In: Moore JW, editor. A neuroscientist's guide to classical conditioning. First. New York: Springer; 2002. pp. 171–231. [Google Scholar]
- Koistinaho M, Ort M, Cimadevilla JM, Vondrous R, Cordell B, Koistinaho J, et al. Specific spatial learning deficits become severe with age in β-amyloid precursor protein transgenic mice that harbor diffuse β–amyloid deposits but do not form plaques. Proceedings of the National Academy of Sciences, USA. 2001;98:14675–14680. doi: 10.1073/pnas.261562998. [DOI] [PMC free article] [PubMed] [Google Scholar]
- Kolsch H, Heun R, Kerksiek A, Bergmann Kv, Maier W, Lutjohann D. Altered levels of plasma 24S- and 27-hydroxycholesterol in demented patients. Neuroscience Letters. 2004;368:303–308. doi: 10.1016/j.neulet.2004.07.031. [DOI] [PubMed] [Google Scholar]
- Lovell MA, Robertson JD, Teesdale WJ, Campbell JL, Markesbery WR. Copper, iron and zinc in Alzheimer's disease senile plaques. Journal of Neurological Sciences. 1998;158:47–52. doi: 10.1016/s0022-510x(98)00092-6. [DOI] [PubMed] [Google Scholar]
- Manuck SB, Kaplan JR, Clarkson TB. Behaviorally induced heart rate reactivity and atherosclerosis in cynomologus monkeys. Psychosomatic Medicine. 1983;45:95–108. doi: 10.1097/00006842-198305000-00002. [DOI] [PubMed] [Google Scholar]
- Maynard CJ, Bush AI, Masters CL, Cappai R, Li QX. Metals and amyloid-β in Alzheimer's disease. International Journal of Experimental Pathology. 2005;86:147–159. doi: 10.1111/j.0959-9673.2005.00434.x. [DOI] [PMC free article] [PubMed] [Google Scholar]
- McEchron MD, Cheng AY, Gilmartin MR. Trace fear conditioning is reduced in the aging rat. Neurobiology of Learning and Memory. 2004;82:71–76. doi: 10.1016/j.nlm.2004.06.002. [DOI] [PubMed] [Google Scholar]
- Moghadasian MH. Experimental atherosclerosis. A historical overview. Life Sciences. 2002;70:855–865. doi: 10.1016/s0024-3205(01)01479-5. [DOI] [PubMed] [Google Scholar]
- Morgan D. Learning and memory deficits in APP transgenic mouse models of amyloid deposition. Neurochemical Research. 2003;28:1029–1034. doi: 10.1023/a:1023255106106. [DOI] [PubMed] [Google Scholar]
- Nelson TJ, Schreurs BG, Alkon DL. Memory storage mechanisms: GTP-binding proteins and conservation across species. In: Adelman G, Smith BH, editors. Elsevier's Encyclopedia of Neuroscience. 2. New York: Elsevier; 1999. pp. 1138–1141. [Google Scholar]
- Nijsen MJMA, Croiset G, Diamant M, Stam R, Delsing D, de Wied D, et al. Conditioned fear-induced tachycardia in the rat; vagal involvement. European Journal of Pharmacology. 1998;350:211–222. doi: 10.1016/s0014-2999(98)00261-1. [DOI] [PubMed] [Google Scholar]
- O'Brien WT, Xu G, Batta A, Tint GS, Salen G, Dyer CA, et al. Developmental sensitivity of associative learning to cholesterol synthesis inhibitors. Behavioural Brain Research. 2002;129:141–152. doi: 10.1016/s0166-4328(01)00342-4. [DOI] [PubMed] [Google Scholar]
- Plant LD, Boyle JP, Smith IF, Peers C, Pearson HA. The production of amyloid β peptide is a critical requirement for the viability of central neurons. Journal of Neuroscience. 2003;23:5531–5535. doi: 10.1523/JNEUROSCI.23-13-05531.2003. [DOI] [PMC free article] [PubMed] [Google Scholar]
- Plant LD, Webster NJ, Boyle JP, Ramsden M, Frier DB, Peers C, et al. Amyloid β peptide as a physiological modulator of neuronal “A”-type K+ current. Neurobiology of Aging. 2005;XX:1–11. doi: 10.1016/j.neurobiolaging.2005.09.038. [DOI] [PubMed] [Google Scholar]
- Powell DA, Kazis E. Blood pressure and heart rate changes accompanying classical eyeblink conditioning in the rabbit (Oryctolagus cuniculus) Psychophysiology. 1976;13:441–447. doi: 10.1111/j.1469-8986.1976.tb00858.x. [DOI] [PubMed] [Google Scholar]
- Powell DA, Levine-Bryce D. A comparison of two model systems of associative learning: heart rate and eyeblink conditioning in the rabbit. Psychophysiology. 1988;25:672–682. doi: 10.1111/j.1469-8986.1988.tb01906.x. [DOI] [PubMed] [Google Scholar]
- Robinson SR, Bishop GM. Aβ as a bioflocculant: implications for the amyloid hypothesis of Alzheimer's disease. Neurobiology of Aging. 2002;23:1051–1072. doi: 10.1016/s0197-4580(01)00342-6. [DOI] [PubMed] [Google Scholar]
- Rozanski A, Blumenthal JA, Kaplan J. Impact of psychological factors on the pathogensis of cardiovascular disease and implications for therapy. Circulation. 1999;99:2192–2217. doi: 10.1161/01.cir.99.16.2192. [DOI] [PubMed] [Google Scholar]
- Schneiderman N. Response system divergencies in aversive classical conditioning. In: Black AH, Prokasy WF, editors. Classical Conditioning II: Current Research and Theory. New York: Appleton-Century-Crofts; 1972. pp. 341–376. [Google Scholar]
- Schrader LA, Anderson AE, Varga AW, Levy M, Sweatt JD. The other half of Hebb: K+ channels and the regulation of neuronal excitability in the hippocampus. Molecular Neurobiology. 2002;25:51–66. doi: 10.1385/MN:25:1:051. [DOI] [PubMed] [Google Scholar]
- Schreurs BG. Classical conditioning and modification of the rabbit's (Oryctolagus cuniculus) unconditioned nictitating membrane response. Behavioral and Cognitive Neuroscience Reviews. 2003;2:83–96. doi: 10.1177/1534582303255014. [DOI] [PubMed] [Google Scholar]
- Schreurs BG, Alkon DL. US-US conditioning of the rabbit's nictitating membrane response: emergence of a conditioned response without alpha conditioning. Psychobiology. 1990;18:312–320. [Google Scholar]
- Schreurs BG, Crum JM, Wang D, Smith-Bell CA. Conditioning-specific reflex modification of rabbit (Oryctolagus cuniculus) heart rate. Behavioral Neuroscience. 2005;119:1484–1495. doi: 10.1037/0735-7044.119.6.1484. [DOI] [PubMed] [Google Scholar]
- Schreurs BG, Gonzales-Joekes J, Smith-Bell CA. Conditioning-specific reflex modification of the rabbit (Oryctolagus cuniculus) nictitating membrane response is sensitive to context. Learning & Behavior. 2006;34:315–324. doi: 10.3758/bf03192886. [DOI] [PubMed] [Google Scholar]
- Schreurs BG, Gusev PA, Tomsic D, Alkon DL, Shi T. Intracellular correlates of acquisition and long-term memory of classical conditioning in Purkinje cell dendrites in slices of rabbit cerebellar lobule HVI. Journal of Neuroscience. 1998;18:5498–5507. doi: 10.1523/JNEUROSCI.18-14-05498.1998. [DOI] [PMC free article] [PubMed] [Google Scholar]
- Schreurs BG, Oh MM, Hirashima C, Alkon DL. Conditioning-specific modification of the rabbit's unconditioned nictitating membrane response. Behavioral Neuroscience. 1995;109:24–33. doi: 10.1037//0735-7044.109.1.24. [DOI] [PubMed] [Google Scholar]
- Schreurs BG, Shi T, Pineda SI, Buck DL. Conditioning the unconditioned response: modification of the rabbit's (Oryctolagus cuniculus) unconditioned nictitating membrane response. Journal of Experimental Psychology: Animal Behavior Processes. 2000;26:144–156. doi: 10.1037//0097-7403.26.2.144. [DOI] [PubMed] [Google Scholar]
- Schreurs BG, Smith-Bell CA. Heart rate changes during conditioning-specific reflex modification of the rabbit's (Oryctolagus cuniculus) nictitating membrane response. Neurobiology of Learning and Memory. 2005;84:148–158. doi: 10.1016/j.nlm.2005.06.003. [DOI] [PubMed] [Google Scholar]
- Schreurs BG, Smith-Bell CA, Lochhead J, Sparks DL. Cholesterol modifies classical conditioning of the rabbit (Oryctolagus cuniculus) nictitating membrane response. Behavioral Neuroscience. 2003;117:1220–1232. doi: 10.1037/0735-7044.117.6.1220. [DOI] [PubMed] [Google Scholar]
- Seager MA, Smith-Bell CA, Schreurs BG. Conditioning-specific reflex modification of the rabbit (Oryctolagus cuniculus) nictitating membrane response: US intensity effects. Learning & Behavior. 2003;31:292–298. doi: 10.3758/bf03195990. [DOI] [PubMed] [Google Scholar]
- Sjogren M, Mielke M, Gustafson D, Zandi P, Skoog I. Cholesterol and Alzheimer's disease - is there a relation? Mechanisms of Ageing and Development. 2006;127:138–147. doi: 10.1016/j.mad.2005.09.020. [DOI] [PubMed] [Google Scholar]
- Sparks DL. Dietary cholesterol induces Alzheimer-like β-amyloid immunoreactivity in rabbit brain. Nutrition, Metabolism and Cardiovascular Diseases. 1997;7:255–266. [Google Scholar]
- Sparks DL. Neuropathologic links between Alzheimer's disease and vascular disease. In: Iqbal K, Swaab DF, Winblad B, Wisniewski HM, editors. Alzheimer's Disease and Related Disorders. New York: John Wiley and Sons Ltd; 1999. pp. 153–163. [Google Scholar]
- Sparks DL, Friedland R, Petanceska S, Schreurs BG, Shi J, Perry G, et al. Trace copper levels in the drinking water, but not zinc or aluminum influence CNS Alzheimer-like pathology. Journal of Nutrition, Health and Aging. 2006;10:247–254. [PMC free article] [PubMed] [Google Scholar]
- Sparks DL, Lochhead J, Horstman D, Wagoner T, Martin T. Water quality has a pronounced effect on cholesterol-induced accumulation of Alzheimer amyloid (aβ) in rabbit brain. Journal of Alzheimer's Disease. 2002;4:523–529. doi: 10.3233/jad-2002-4609. [DOI] [PubMed] [Google Scholar]
- Sparks DL, Martin TA, Gross DR, Hunsaker JC., III Link between heart disease, cholesterol and Alzheimer's disease: a review. Microscopy Research and Technique. 2000;50:287–290. doi: 10.1002/1097-0029(20000815)50:4<287::AID-JEMT7>3.0.CO;2-L. [DOI] [PubMed] [Google Scholar]
- Sparks DL, Scheff SW, Hunsaker JC, III, Liu H, Landers T, Gross DR. Induction of Alzheimer-like β-amyloid immunoreactivity in the brains of rabbits with dietary cholesterol. Experimental Neurology. 1994;126:88–94. doi: 10.1006/exnr.1994.1044. [DOI] [PubMed] [Google Scholar]
- Sparks DL, Schreurs BG. Trace amounts of copper in water induce β-amyloid plaques and learning deficits in a rabbit model of Alzheimer's disease. Proceedings of the National Academy of Sciences, USA. 2003;100:11065–11069. doi: 10.1073/pnas.1832769100. [DOI] [PMC free article] [PubMed] [Google Scholar]
- Streit WJ, Sparks DL. Activation of microglia in the brains of humans with heart disease and hypercholesterolemic rabbits. Journal of Molecular Medicine. 1997;72:130–138. doi: 10.1007/s001090050097. [DOI] [PubMed] [Google Scholar]
- Tuma PL, Hubbard AL. Transcytosis: crossing cellular barriers. Physiological Reviews. 2003;83:871–932. doi: 10.1152/physrev.00001.2003. [DOI] [PubMed] [Google Scholar]
- Voikar V, Rauvala H, Ikonen E. Cognitive deficit and development of motor impairment in a mouse model of Niemann-Pick type C disease. Behavioural Brain Research. 2002;132:1–10. doi: 10.1016/s0166-4328(01)00380-1. [DOI] [PubMed] [Google Scholar]
- Wang D, Darwish DS, Schreurs BG. Effects of 4-aminopyridine on classical conditioning of the rabbit (Oryctolagus cuniculus) nictitating membrane response. Behavioural Pharmacology. 2006;17:319–329. doi: 10.1097/01.fbp.0000224381.56121.15. [DOI] [PubMed] [Google Scholar]
- Welsh SE, Romano AG, Harvey JA. Effects of serotonin 5-HT2A/2C antagonists on associative learning in the rabbit. Psychopharmacology. 1998;137:157–163. doi: 10.1007/s002130050605. [DOI] [PubMed] [Google Scholar]
- Xu G, Servatius RJ, Shefer S, Tint GS, O'Brien WT, Batta AK, et al. Relationship between abnormal cholesterol synthesis and retarded learning in rats. Metabolism. 1998;47:878–882. doi: 10.1016/s0026-0495(98)90130-5. [DOI] [PubMed] [Google Scholar]
- Xu J, Kang J. The mechanisms and functions of activity-dependent long-term potentiation of intrinsic excitability. Reviews in the Neurosciences. 2005;16:311–323. doi: 10.1515/revneuro.2005.16.4.311. [DOI] [PubMed] [Google Scholar]
- Zatta P, Zambenedetti P, Stella MP, Licastro F. Astrocytosis, microgliosis, metallothionein-I-II and amyloid expression in high cholesterol-fed rabbits. Journal of Alzheimer's Disease. 2002;4:1–9. doi: 10.3233/jad-2002-4101. [DOI] [PubMed] [Google Scholar]
- Zhang W, Linden DJ. The other side of the engram: experience-driven changes in neuronal intrinsic excitability. Nature Reviews Neuroscience. 2003;4:885–900. doi: 10.1038/nrn1248. [DOI] [PubMed] [Google Scholar]