Abstract
Spectral changes were measured with femtosecond resolution following low-intensity, broad-band excitation of the peripheral antenna complex of the purple photosynthetic bacterium Rhodobacter sphaeroides. Absorption anisotropy decays also were measured. We identified a 35-fs relaxation of the absorption and emission spectra of the excited state, as well as a 20-fs anisotropy decay. We interpret these results as interlevel relaxation and dephasing, respectively, of extensively delocalized exciton states of the circular bacteriochlorophyll aggregate.
Photosynthetic organisms contain pigment–protein antenna complexes that absorb light and transfer energy rapidly to the reaction centers where charge separation occurs. The crystal structures of the peripheral light-harvesting complexes (LH2) from two species of photosynthetic purple bacteria have been determined recently by McDermott et al. (1) and Koepke et al. (2). With these structures in hand, it now is possible to evaluate the intermolecular interactions that give rise to the multiple excited states of an antenna complex and to explore the roles of these states in energy transfer. The LH2 complex of Rhodopseudomonas acidophila (1) contains 27 molecules of bacteriochlorophyll-a (BChl). Eighteen of these molecules are arranged in a ring with their Qy transition dipoles (N1–N3 molecular axes) oriented approximately in the membrane plane. These BChls are termed the B850 pigments because they probably account for the strong absorption band of the complex in the region of 850 nm (3). A similar ring of 16 BChls occurs in the complex from Rhodospirillum molischianum (2). The short distances between the B850 BChls would be expected to bring about relatively strong exciton interactions, which could lead to extensively delocalized excited states. The remaining BChl molecules in the LH2 complex form a larger ring that probably accounts for an absorption band at 800 nm. Here the intermolecular interactions are weaker and the excited states may be more localized (4). In this paper we use femtosecond pump–probe spectroscopy to investigate the dynamics of the excited states of B850 in Rhodobacter sphaeroides. Our results support the notion of delocalized exciton states involving the entire B850 ring.
EXPERIMENTAL
Femtosecond Spectrometer.
The pump and probe pulses were derived from a femtosecond Ti/sapphire laser of Murnane–Kapteyn design (5). The laser delivered pulses centered at 850 nm with a spectral range as broad as 120 nm and a pulse width as short as 12 fs. The pulse spectrum and the width were adjustable by varying the placement of the intracavity, fused-silica prisms. The repetition rate of the pulses was reduced from 96 MHz to 200 kHz by focusing the light on a Bragg cell outside the laser cavity and collecting the acoustooptically diffracted light after a single pass. The diffraction efficiency was about 30% per pulse. The diffracted beam was split into pump and probe beams with an intensity ratio of 9:1; the two beams were sent through separate sets of LaKL21 glass prisms and roof mirrors for dispersion precompensation. The pump beam was modulated by a chopper at a frequency of 1.1 kHz. The probe beam was reflected by a retroreflector mounted on a delay stage capable of a time resolution of 0.14 fs and was then made parallel to the pump beam before the two beams were focused on the sample with a 10-cm focal-length lens. Immediately after the sample, the pump beam was blocked off and the probe was recollimated and sent through a monochromator to a silicon photodiode. The bandwidth of the monochromator was set at 5 nm. The output of the photodiode was processed by a lock-in amplifier that was phase-locked to the chopping frequency. Fractional transmission changes at each wavelength were determined by normalizing the output of the lock-in amplifier by the DC level of the transmitted probe light. The combination of a stable laser, low-noise photodiode and preamplifier, and lock-in detection allowed us to measure fractional transmission changes as low as 10−5. To avoid possible complications from excitation of B800 and subsequent energy transfer to B850, an adjustable, movable slit was included between the prism and the roof mirror in the pump precompensation line. The slit selected a portion of the spatially dispersed beam, narrowing the pump pulses spectrally so that the intensity at wavelengths below 820 nm was 5% of the peak intensity. Fig. 1 displays the pump and probe spectral profiles.
Figure 1.
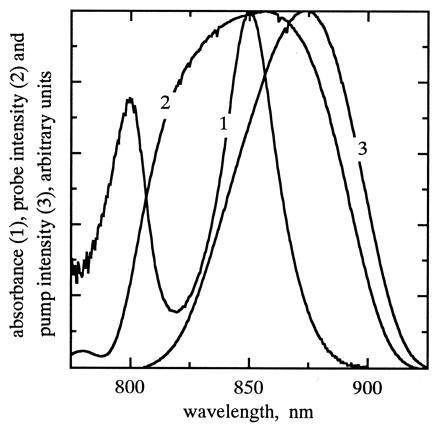
The near-IR absorption spectrum of Rb. sphaeroides strain ΔQBALM/Q chromatophores measured with femtosecond pulses (curve 1), and the spectral profiles of the probe (curve 2) and pump (curve 3) pulses.
The pump–probe cross-correlation function was measured by introducing a mirror on a kinematic mount between the focusing lens and the sample and directing the focused beams into a 30-μm-thick KH2PO4 crystal. When the slit was opened to admit the full spectral bandwidth of the pump pulses, the cross-correlation width was typically 35 fs and was fit well as the autocorrelation of ≈25 fs wide, sech2-shaped pulses. (Broadening of the pulses from 12 fs occurs because the LaKL21 prisms cannot null effectively both second- and higher-order dispersions in the 850-nm region.) Spectral selection by the slit broadened the pump pulses further to ≈35 fs.
For anisotropy measurements, the polarization of the pump beam was rotated with respect to the probe with a zero-order half-wave plate. In these experiments, the pump pulses were used without the slit and were as short as the probe pulses. Rotating the half-wave plate caused a slight displacement of the beam, leading to a delay of ≈1.5 fs when the pump beam was orthogonally polarized. The orthogonal signal was shifted to correct for this delay before the calculation of anisotropy signals.
Sample Preparation.
Rb. sphaeroides strain ΔQBALM/Q, a mutant that lacks the reaction center and the core antenna complexes, was constructed by transferring a plasmid (pRKQ) that contains pufQ into a chromosomal deletion strain (ΔQBALM) in which the entire pufQBALM region of the Rb. sphaeroides wild-type strain 2.4.1 chromosomal DNA had been replaced with a kanamycin-resistance gene cartridge (ref. 6, and J.C.W., unpublished work). The resulting strain expresses only the LH2 complex. Cells grown in the dark in a rich medium for 3 days at 31°C with 200 rpm shaking were fragmented in a French press. Chromatophores were collected by centrifugation, resuspended in 40% ethylene glycol, and stored at 4°C. For use, chromatophore suspensions in 50 mM Tris·HCl (pH 8.0) were filtered with a membrane filter to remove aggregates and diluted to an absorbance of ≈0.4 at 850 nm in a sealed quartz cuvette with a pathlength of 0.5 mm. Fig. 1 shows the absorption spectrum of the resting chromatophores as measured by the femtosecond spectrometer. To minimize product build-up, the sample was translated continuously side-to-side in a direction normal to the bisector of the pump and probe beams at ≈1 cm/s. The maximum combined energy of the pump and probe beams at the sample was 0.5 nJ. The spot radius of the pump beam was between 25 and 50 μm as determined with precision pinholes. By taking the absorption cross section of a single BChl molecule to be 2 × 10⁻¹⁶ cm2, we estimate that even at the highest possible irradiance level of 25 μJ·cm−2, the probability of two excitations per B850 complex is 8%. For the kinetics experiments the irradiance was <5 μJ·cm−2; it seems reasonable, therefore, to expect singlet–singlet annihilation not to be important in the first few hundred femtoseconds.
Data Analysis.
The spectra and kinetics of the absorbance changes were analyzed by singular-value decomposition as described (7). Briefly, the M × N data matrix of intensities at M time points and N wavelengths is decomposed into an M × N matrix of N kinetic traces, an N × N matrix of basis spectra, and a diagonal singular-value matrix of rank N. Each singular-value matrix element represents the weighting of the corresponding basis spectrum and kinetic trace in the experimental data; usually only the first few of these carry significant weight. The significant kinetic traces are fit globally to a sum of exponentials with a nonlinear least-squares routine, and the resulting amplitudes are used in conjunction with the basis spectra to generate a set of “decay-associated spectra.” When the rate constants and decay-associated spectra are applied to a specific kinetic scheme, difference spectra can be calculated for the absorbance changes associated with forming the various intermediates in the scheme.
RESULTS
Time-Resolved Spectra.
Fig. 2 shows two perspectives of the evolution of the absorbance changes at 5-fs intervals following “magic-angle” excitation of the sample with 35-fs pulses (pump–probe polarization angle = 54.7°). A damped oscillatory feature is seen along the time axis starting about 30 fs before the maximum change in the signal, especially in the red wing of the spectra. This feature represents the so-called perturbed free-induction decay (8), which arises from interference between the pump pulse and probe-induced polarization at the sample. The rapid damping of the oscillations in the direction of negative time delay (i.e., probe preceding pump) implies that coherence between the ground and excited electronic states of B850 is lost in 30 fs or less.
Figure 2.
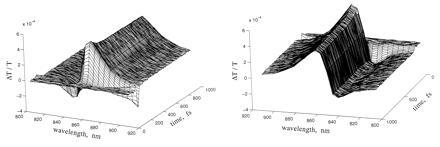
Time-resolved changes in transmission of chromatophores resulting from femtosecond excitation. Conditions are as described in the text.
As Fig. 2 shows, excitation of B850 causes a decrease in absorbance at wavelengths greater than 845 nm and a simultaneous increase in absorbance at shorter wavelengths. The signal at wavelengths above 885 nm is due mostly to stimulated emission from the excited state. The decreased absorbance around 860 nm is due to bleaching in the ground-state absorption band of B850 and partly also to stimulated emission. At the shorter wavelengths, the increased absorbance reflects excited-state absorption. After reaching their maximum values, the signals decay to smaller values on the time scale of 100 fs. These trends are seen more clearly in Fig. 3A, which shows the difference transmission spectra at several time delays. The spectra display two isosbestic points, one at ≈847 nm and the other at ≈877 nm.
Figure 3.
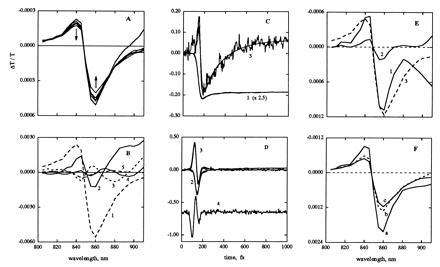
(A) Difference spectra measured at 50, 75, 100, 125, 150, and 850 fs from the time the bleach signal at 860 nm reaches half its maximum value; arrows denote increasing time delay. (B) Basis spectra of the five most significant components from singular-value decomposition. The spectra are numbered in order of decreasing singular value; traces 2–5 are magnified 5-fold with respect to trace 1 for clarity. (C and D) Kinetic traces corresponding to the five significant basis spectra. The smooth curves show fits to sums of exponentials with time constants <1 fs, 10 fs, 33 fs, 197 fs, and ∞. Trace 4 (offset in the figure for clarity) was not fit. (E) Decay-associated spectra for the 33 fs (trace 1), 197 fs (trace 2), and ∞ (trace 3) exponential components. The amplitude of trace 1 may be somewhat overestimated, especially at wavelengths >880 nm, due to incomplete resolution of the 10-fs component. (F) Difference spectra for the formation of the three states in a linear kinetic scheme, a → 33fs b → 197fs c.
Fig. 3 B–F shows the results of singular-value decomposition of the data in Fig. 2. Only the first five components were deemed statistically significant. One of these (labeled component 4 in Fig. 3 B and D) bears the hallmarks of perturbed-free-induction decay. Its kinetic trace has a pronounced oscillation that peaks well before the other components (Fig. 3D), and its basis spectrum is an oscillatory function of wavelength (Fig. 3B). The other four kinetic curves can be fit reasonably well by a sum of four exponentials and a constant convoluted with the pump–probe cross-correlation function (Fig. 3 C and D). The apparent time constants are <1 fs and ≈10, 35, and 200 fs. The kinetic traces also have small oscillations continuing out to 1 ps, which presumably reflect the propagation of the vibrational wavepacket on the electronic excited-state surface (9, 10). However, the oscillations are too small to be well characterized.
The time constants of <1 fs and ≈10 fs are too short to be physically meaningful. The amplitude spectra of these two components very nearly cancel each other at all wavelengths, except at the red edge. It seems likely that these components reflect residual contributions from perturbed-free-induction decay and other coherent interactions at the sample (8, 11), and possibly also from the frequency chirp in the pump and probe pulses. We will therefore ignore the two very fast components and turn to the ones with time constants of ≈35 fs and 200 fs. Incorporating these time constants and the decay-associated spectra in a simple, sequential kinetic model, a → 33fs b → 197fs c, leads to the difference spectra shown in Fig. 3F. If the change from a to b is reversible, the amplitude and, to some extent, the shape of the spectrum of b would be expected to be different. The calculated spectra retain the main features of the raw data (Fig. 3A). A similar pair of exponential components with time constants of ≈40 and ≈200 fs is obtained by fitting only the portions of the kinetics traces after the pump–probe overlap. (The shapes of the amplitude spectra are close to those shown in Fig. 3C, but the relative change of the model-dependent spectra in going from state a to b is somewhat smaller than that in Fig. 3F.)
Two points emerge from this analysis: (i) the absorbance changes that follow the initial excitation can be characterized reasonably as a series of relaxations of the excited system, and (ii) the model dependent spectra of the initial, intermediate, and relaxed states of the system are similar (see Fig. 3F), suggesting that the two stages of the relaxation involve similar processes.
Anisotropy Decay.
Absorption anisotropy decays were analyzed at various wavelengths across the B850 absorption band. Fig. 4 shows the results at 860 nm. The noisy lines are the magic-angle (K = S∥+2S⊥) and polarization-difference traces (D = S∥-S⊥) constructed from the parallel (S∥) and orthogonal (S⊥) signals. K(t) and D(t) are convolutions of the pump–probe cross correlation, I(t), with the true magic-angle and difference signals, k(t) and d(t). The Inset in Fig. 4 shows the “raw” anisotropy, D(t)/K(t). k(t) was extracted by fitting K(t) to the convolution of I(t) with a multiexponential function. The time-dependent anisotropy, r(t), was obtained by fitting D(t) to the convolution of I(t) with the product r(t)k(t), using another multiexponential function for r(t). The fits recover a large initial anisotropy (≈0.8 at 830 nm and ≈0.9 at 860 nm) that decays to a value of ≈0.1 (see also Fig. 4 Inset). The anisotropy decay is described well by a major exponential component with a time constant of about 20 fs and a smaller component with a time constant of ≈130 fs. Similar values for the initial anisotropy and the dominant time constant are obtained at other wavelengths, but the fits are not uniformly good because at some wavelengths the signals at the earliest delay times probably are dominated by pump–probe coherence effects. A similar time course for the anisotropy is measured with spectrally unresolved probe pulses that cover the entire 850-nm absorption band (crosses in Fig. 4 Inset) although the initial anisotropy in this case is smaller [r(0) ≈ 0.6]. The initial anisotropy values were slightly larger if the orthogonal signals were not corrected for the time shift.
Figure 4.
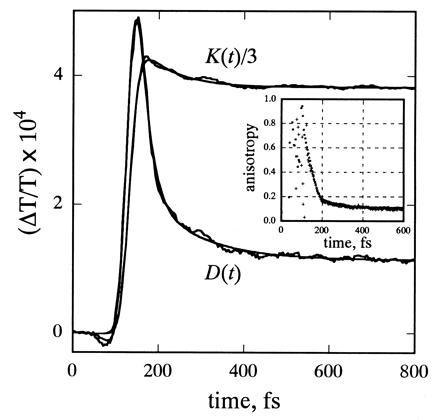
Magic-angle K(t) and difference polarization D(t) decay curves calculated from the signals measured with parallel and orthogonal polarization at 860 nm, and fits to these curves (see text). The best fit to D(t) is obtained with r(t) = 0.745 exp(−t/21.8) + 0.095 exp(−t/135) + 0.099. (Inset) The “raw” anisotropy [D(t)/K(t)] calculated from the wavelength-resolved signals at 860 nm (∗) and from signals measured without the monochromator in the probe beam (+).
To assess whether the anisotropy results are distorted by the small oscillations in K(t) and D(t), we used the same procedure to analyze data on the laser dye IR-132 in methyl sulfoxide, where the signals are strongly modulated by at least two vibrational frequencies. The fitting procedure retrieved an initial anisotropy of 0.40 decaying with a 28-fs time constant to a constant anisotropy of 0.39, close to the expected value of 0.4. The small 28-fs component is most likely an artifact due to the oscillations in the signal. The weak oscillations in the B850 signals thus could introduce some distortions of r(t), but these probably are relatively minor.
DISCUSSION
Reddy et al. (12, 13) have studied the dynamics of the B850 complex of chromatophores of Rb. sphaeroides by nonphotochemical hole burning and have concluded that even at 4.2 K, where pure dephasing of the ground and excited-state electronic coherence is negligible, the absorption band is almost entirely homogeneously broadened. Further, these authors find evidence for a weak, inhomogeneously-broadened band peaking at a longer wavelength (870 nm at 4.2 K), which they assign to the lowest exciton band of B850. The large homogeneous width of the main band, they argue, results from ultrafast interexciton level relaxation. Our results in the time domain suggest that this picture is essentially correct even at room temperature. The initial excited population equilibrates very rapidly by relaxing into a state that has a weaker emission to the ground state and weaker absorption to higher-lying excited states.
In a circular array of identical molecules, each of which has a single absorption band with its transition dipole lying approximately in the plane of the circle, the lowest exciton state is expected to have a very small dipole strength; its transition dipole is normal to the plane and depends on the out-of-plane orientation of monomer dipoles. Just above this state there is a degenerate pair of excited states with large dipole strengths and orthogonal transition dipoles in the plane of the ring. These latter states probably underlie the strong 850-nm absorption band of B850 (3).
To explore this model, we carried out semiempirical quantum mechanical calculations using the crystal structure (1) of the Rp. acidophila LH2 complex, following an approach similar to that used by Warshel and Parson (14) to calculate the spectroscopic properties of the reaction center of Rp. viridis. Briefly, molecular orbitals derived from quantum-mechanical-force-field/π-electron (QCFF-PI) calculations are used to treat the individual BChl molecules, and intermolecular interactions are introduced at the level of configuration interactions. A detailed discussion of the methodology and results, including a study of the effects of inhomogeneity on the absorption and CD spectra of the complex, will be presented elsewhere (R.G.A., E. Johnson, V.N., and W.W.P., unpublished data). Here, the model was restricted to a homogeneous system in which each B850 BChl has a single transition (Qy). However, all of the off-diagonal interactions among the 18 BChls were retained. We calculated the transition energies and dipole strengths for excitations from the ground state to all singly excited states, and from the three lowest singly excited states to all the 153 doubly excited states. The spectral lineshapes were calculated with linewidth and Franck–Condon parameters obtained from the hole-burning measurements of Reddy et al. (12, 13).
Fig. 5 Upper shows the calculated ground-state absorption spectrum. The major absorption intensity in the 850 nm region results from two degenerate delocalized states (k = ±1), which have orthogonal polarizations in the plane of the ring. The lowest exciton level (k = 0) lies ≈100 cm−1 below the k = ±1 states, but transition from the ground state to the k = 0 state is formally forbidden as discussed above. Fig. 5 Lower shows the calculated time-dependent absorbance changes associated with population of the singly excited state, including ground-state bleaching, excited-state absorption, and stimulated emission from states k = 0 and k = ±1. In this simulation, a broad-band excitation pulse initially populates predominantly the k = ±1 levels, which then equilibrate thermally with the k = 0 level. The simulation reproduces the qualitative features of the experimental data (see Fig. 3A). The decrease of the signal at 850 nm with time results from loss of the stimulated emission from states k = ±1. It was assumed that the Franck–Condon factors associated with excited-state absorption are identical to values used to simulate the ground state absorption spectra. Modifications of these parameters alter some aspects of the calculated spectra, such as the position of the isosbestic point, but do not change the qualitative features.
Figure 5.
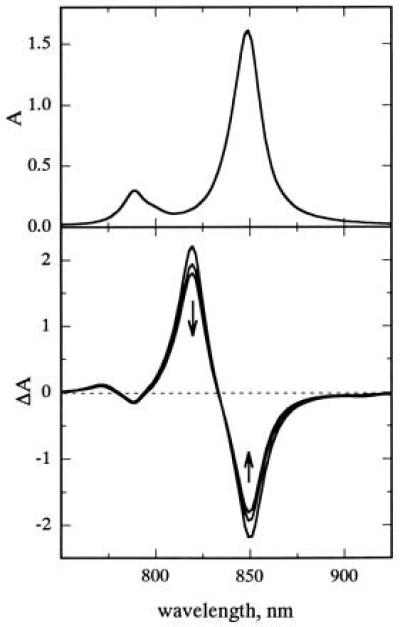
(Upper) Calculated absorption spectrum of the B850 LH2 complex based on the Rp. acidophila crystal structure. To calculate the lineshapes, three vibronic modes were used with the following frequencies (ω) and Huang–Rhys factors (S): ω1 = 20 cm−1, S1 = 1.0, ω2 = 200 cm−1, S2 = 0.02, ω3 = 750 cm−1, S3 = 0.05. The linewidths of the vibronic transitions were Γk=0 = 60 cm−1 and Γk≠0 = 270 cm−1. (Lower) Time-resolved difference spectra calculated using the same vibronic parameters as above, including bleaching of the ground-state absorption, stimulated emission, and excited-state absorption. The Γ values for ground-state absorbance and stimulated emission also were as above; the excited-state absorption linewidths were all assumed to be 270 cm−1. The arrows point in the direction of thermalization at room temperature.
It was not possible to simulate the spectral changes well with models in which the exciton was localized in a smaller region of the B850 ring (8, 6, or 4 BChls). In these models, the lowest exciton state carries most of the dipole strength, and relaxations cause either an increase or little change in the calculated signal. The model of delocalized exciton relaxation thus appears to provide the most straightforward interpretation of the experimental time-resolved data. Because the energy differences between states k = 0 and k = ±1 are small and interconversions among the three states presumably are reversible, the difference spectra in Fig. 3F must represent partially or completely thermalized mixtures of these states. However, a more realistic treatment would have to include absorption into additional higher-energy exciton states as well as into the lowest state, which can become weakly allowed as a result of structural inhomogeneity in the complex.
Jimenez et al. (15) have studied the fluorescence kinetics of the detergent-solubilized B800-B850 complex of Rb. sphaeroides. When they excited the B850 absorption band at 840 or 850 nm, emission at 940 nm rose with a time constant of ≈45 fs. No such rise kinetics were seen following excitation at 860 nm. The explanation advanced by Jimenez et al. is that shorter-wavelength light preferentially excites pigments absorbing at a higher energy within an inhomogeneously broadened absorption band (15, 16, 17). Transfer of this excitation to longer-wavelength absorbing pigments could account for the fluorescence kinetics. In our model, the fluorescence rise would reflect the increasing population of the lowest excited state. The detection wavelength coincides with a vibronic band (12, 13) that could shift as excitonic relaxation occurs.
Jimenez et al. (15) measured an initial fluorescence anisotropy of ≈0.35 and depolarization time constants of 40–90 fs and 300–500 fs, with the variation depending on the detergent used and excitation and detection wavelengths. Pullerits et al. (18) recently reported on absorbance changes at 864 nm that showed an initial anisotropy of ≈0.4 with decay time constants of 100 fs and ≈2 ps. The higher initial anisotropy and faster decay components that we observed could reflect the better time resolution of the present studies. As noted above, a degenerate pair of exciton states in a symmetrical circular aggregate carry a large dipole strength and have orthogonal transition dipoles. A coherent superposition of these states prepared by broad-band excitation would be expected to lead to an initial anisotropy of 0.7 that decays to 0.4 and then to 0.1 as the two states dephase and equilibrate thermally (19, 20, 21). High anisotropy values also could arise at wavelengths where the ground-state and excited-state absorption spectra overlap, if the transition dipole for excited-state absorption is tilted with respect to the transition dipole of ground-state absorption. This effect would be wavelength-dependent, because the excited-state absorption is shifted to the blue relative to the ground-state band. We found the large initial anisotropy to be relatively independent of wavelength. However, small effects of excited-state absorption could make a small contribution to the measured anisotropy cause it to exceed the theoretical maximum value of 0.7.
Although the decay of the anisotropy from ≈0.9 to an intermediate value of ≈0.20 is described well by a single time constant of ≈20 fs, the data do not exclude a multiphasic process with several closely lying time constants. In particular, it is possible (though not statistically justified) to fit the decay using three exponentials with one time constant fixed at 35 fs to match the relaxation of the isotropic signal. Such a fit to data at 860 nm gives anisotropy (time constant) values of 0.59 (20 fs), 0.21 (35 fs), 0.064 (465 fs), and 0.08 (constant). The time constant of 465 fs may not be determined reliably because the data extend only to 700 fs. Keeping the limitations of the analysis in mind, we interpret the anisotropy decay as being due to (i) dephasing of the exciton states in ≈20 fs, (ii) relaxation of the higher-lying exciton states to the lowest exciton state in ≈35 fs, and (iii) a further equilibration until the transition dipole is completely randomized in the plane of the membrane. The nature of the last relaxation is unclear at this point.
In summary, we have found that the excited B850 ring relaxes with a time constant of ≈35 fs. We interpret the relaxation as interlevel exciton decay into a dark state. Given the circular arrangement of the BChl molecules, the combination of allowed higher-energy excited states and a dark lower state strongly supports the view that the exciton is delocalized over the entire ring. The high initial anisotropy suggests the presence of orthogonal transition dipoles with energies within the excitation bandwidth, which also is consistent with a circularly delocalized exciton. Pearlstein and Zuber (22) have suggested that a forbidden state lying below the allowed states could store energy, and thus extend the lifetime of the excitation. In our view, the most useful consequence of delocalization over the entire ring may be that the excitation can be transferred rapidly in any direction to another complex.
Acknowledgments
We are grateful to Margaret Murnane and Henry Kapteyn for their generous and highly helpful advice on construction of the laser, and to Richard Cogdell, Ethan Johnson, and Ken Sauer for helpful discussion on the calculations. Work at the University of Washington was supported by the Chemical Sciences Division of the U.S. Department of Energy (Contract FG06-94ER14443) and work at Arizona State University by National Institutes of Health Grant GM45902. Part of the equipment was purchased with support from the University of Washington Royalty Research Fund and National Science Foundation Grant MCB-9111599.
Footnotes
The publication costs of this article were defrayed in part by page charge payment. This article must therefore be hereby marked “advertisement” in accordance with 18 U.S.C. §1734 solely to indicate this fact.
Abbreviations: BChl, bacteriochlorophyll; LH2, peripheral light-harvesting complex.
References
- 1.McDermott G, Prince S M, Freer A A, Hawthornthwaite-Lawless A M, Papiz M Z, Cogdell R J, Isaacs N W. Nature (London) 1995;374:517–521. doi: 10.1016/s0969-2126(96)00050-0. [DOI] [PubMed] [Google Scholar]
- 2.Koepke J, Hu X, Muenke C, Schulten K, Michel H. Structure (London) 1996;4:581–597. doi: 10.1016/s0969-2126(96)00063-9. [DOI] [PubMed] [Google Scholar]
- 3.Sauer K, Cogdell R J, Prince S M, Freer A A, Isaacs N W, Scheer H. Photochem Photobiol. 1996;64:564–576. [Google Scholar]
- 4.Wu H-M, Savikhin S, Reddy N R S, Jankowiak R, Cogdell R, Struve W S, Small G J. J Phys Chem. 1996;100:12022–12033. [Google Scholar]
- 5.Asaki M T, Huang C-P, Garvey D, Zhou J, Kapteyn H C, Murnane M. Opt Lett. 1993;18:977–979. doi: 10.1364/ol.18.000977. [DOI] [PubMed] [Google Scholar]
- 6.Williams J C, Taguchi A K W. In: Anoxygenic Photosynthetic Bacteria. Blankenship R E, Madigan M T, Bauer C E, editors. Dordrecht, The Netherlands: Kluwer; 1995. pp. 1029–1065. [Google Scholar]
- 7.Nagarajan V, Parson W W, Davis D, Schenck C C. Biochemistry. 1993;32:12324–12336. doi: 10.1021/bi00097a008. [DOI] [PubMed] [Google Scholar]
- 8.Brito Cruz C H, Gordon J P, Becker P C, Fork R L, Shank C V. IEEE J Quantum Electron. 1988;24:261–265. [Google Scholar]
- 9.Vos M H, Rappaport F, Lambry J-C, Breton J, Martin J-L. Nature (London) 1993;363:320–325. [Google Scholar]
- 10.Chachisvilis M, Pullerits T, Jones M R, Hunter C N, Sundström V. Chem Phys Lett. 1994;224:345–351. [Google Scholar]
- 11.Chachisvilis M, Fedder H, Sundström V. Chem Phys Lett. 1995;234:141–150. [Google Scholar]
- 12.Reddy N R S, Small G J, Seibert M, Picorel R. Chem Phys Lett. 1991;181:391–399. [Google Scholar]
- 13.Reddy N R S, Picorel R, Small G J. J Phys Chem. 1992;96:6458–6464. [Google Scholar]
- 14.Warshel A, Parson W W. J Am Chem Soc. 1987;109:6143–6152. [Google Scholar]
- 15.Jimenez R, Dikshit S N, Bradforth S E, Fleming G R. J Phys Chem. 1996;100:6825–6834. [Google Scholar]
- 16.Hess S, Åkesson E, Cogdell R J, Pullerits T, Sundström V. Biophys J. 1995;69:2211–2225. doi: 10.1016/S0006-3495(95)80137-2. [DOI] [PMC free article] [PubMed] [Google Scholar]
- 17.Hess S, Chachisvilis M, Timpmann K, Jones M R, Fowler G J S, Hunter C N, Sundström V. Proc Natl Acad Sci USA. 1995;92:12333–12337. doi: 10.1073/pnas.92.26.12333. [DOI] [PMC free article] [PubMed] [Google Scholar]
- 18.Pullerits T, Chachisvilis M, Sundström V. J Phys Chem. 1996;100:10787–10792. [Google Scholar]
- 19.Knox R S, Gulen D. Photochem Photobiol. 1993;57:40–43. [Google Scholar]
- 20.Wynne K, Hochstrasser R M. Chem Phys. 1993;171:179–188. [Google Scholar]
- 21.Struve W S. In: Anoxygenic Photosynthetic Bacteria. Blankenship R E, Madigan M T, Bauer C E, editors. Dordrecht, The Netherlands: Kluwer; 1995. pp. 297–313. [Google Scholar]
- 22.Pearlstein R M, Zuber H. In: Antennas and Reaction Centers of Photosynthetic Bacteria. Michel-Beyerle M E, editor. Berlin: Springer; 1985. pp. 53–61. [Google Scholar]


