

Abstract
In Escherichia coli, protein degradation in synthetic circuits is commonly achieved by the ssrA-tagged degradation system. In this work, we show that the degradation kinetics for the green fluorescent protein fused with the native ssrA tag in each cell exhibits the zeroth-order limit of the Michaelis–Menten kinetics, rather than the commonly assumed first-order. When measured in a population, the wide distribution of protein levels in the cells distorts the true kinetics and results in a first-order protein degradation kinetics as a population average. Using the synthetic gene-metabolic oscillator constructed previously, we demonstrated theoretically that the zeroth-order kinetics significantly enlarges the parameter space for oscillation and thus enhances the robustness of the design under parametric uncertainty.
Keywords: population heterogeneity, protein degradation, single-cell measurements, synthetic biological circuits
Introduction
One of the most characterized protein degradation systems in Escherichia coli is the AAA+ protease family, which includes ClpXP and ClpAP. These proteases recognize and degrade ssrA-tagged proteins (Gottesman et al, 1998). The ssrA tag and its variants were fused to many proteins (Andersen, 1998) to reduce their half-lives for various synthetic circuits (Elowitz and Leibler, 2000; Fung et al, 2005; Austin et al, 2006). Such synthetic biological circuits enable the testing of operating principles governing biological networks and the exploration of potential applications that are not limited by natural systems (Becskei and Serrano, 2000; Farmer and Liao, 2000; Gardner et al, 2000; Becskei et al, 2001; Atkinson et al, 2003; Bulter et al, 2004; You et al, 2004; Basu et al, 2005). A modified version of the ssrA tag has also been engineered recently to allow controllable degradation (McGinness et al, 2006). In vivo data (Andersen, 1998) showed that ssrA-tagged proteins display a first-order degradation kinetics, suggesting a relatively high Km, whereas in vitro data (Hersch et al, 2004) showed a much lower Km (75 nM), which leads to a zeroth-order kinetics. This discrepancy raised the issue of protein degradation reaction order used in designing synthetic circuits and prompted us to examine the kinetics of protein degradation in detail.
Interestingly, we observed that the degradation kinetics for the native ssrA tag in single cells was in fact zeroth-order. However, population measurements showed that the degradation kinetics was first-order. This discrepancy is another example of single-cell behavior masked by population average. Using both experimental and theoretical analyses, we showed that the discrepancy was caused by the long-tailed distribution of the initial protein level. Moreover, through simulation and mathematical analysis, we demonstrated that the difference between the single-cell and the population measurements would exist even when all the degradation processes were synchronized. Therefore, the discrepancy was not a result of the asynchronous dynamics.
Furthermore, theoretical analysis showed that the kinetic form of protein degradation can have a profound effect on the parametric robustness of biological circuits (Buchler et al, 2005). The importance of accurate kinetic model for protein degradation in predicting circuit properties had also been highlighted (Kim and Tidor, 2003). Through computational analysis, we showed that when the protein degradation kinetics approaches the zeroth-order limit of the Michaelis–Menten kinetics, the parametric robustness of synthetic oscillators can be significantly enhanced. Therefore, the zeroth-order ssrA tag used in the gene-metabolic oscillator reported previously (Fung et al, 2005) may improve the robustness of the oscillation.
Results
The ssrA-tagged protein degradation exhibits a zeroth-order kinetics
To determine the kinetic order of protein degradation, we fused the corresponding codons of two different versions of the ssrA tags, AANDENYALAA (LAA) and AANDENYAASV (ASV), to the coding sequence of the green fluorescent protein (GFP) and expressed them under an IPTG-inducible promoter in glucose medium. The fluorescence property of GFP provides a convenient way for measurement, both at the population and the single-cell level. After resuspension in acetate to wash away IPTG and to induce a time lag in growth, the protein degradation in the nondividing cells was measured using quantitative time-lapse fluorescence microscopy. The LAA tag is naturally found in E. coli and the ASV tag is a modified version of LAA, which has a longer half-life (Andersen, 1998).
Interestingly, the degradation dynamics of the LAA-tagged GFP for individual cells displayed a zeroth-order kinetics (Figure 1A), similar to the in vitro data reported previously (Hersch et al, 2004). This result indicates that the protein level is significantly higher than the Km of the protease in a Michaelis–Menten kinetics. However, when measured in a bulk solution, the degradation dynamics exhibited a first-order kinetics (Figure 1B), which indicates that the protein level is much smaller than the Km.
Figure 1.

Experimental results reveal discrepancy between protein degradation dynamics at the single-cells and population level. (A, C) Time-course measurements of protein degradation for individual cells. The kinetics is zeroth-order for LAA-tagged GFP (A) and is first-order for ASV-tagged GFP (C). These data are representative of more than four independent experiments. Insets: when plotted on the semi-log scale, the single-cell degradation dynamics is curved for LAA, because it is zeroth-order, whereas the dynamics is linear for ASV. (B, D) The bulk degradation kinetics measured by fluorescence plate reader. The kinetics measured in bulk (▴) is first-order for both LAA and ASV. The error bar represents average of four samples. The solid line is an exponential fit of the data. The kinetics of one of the single-cell measurements is also plotted for comparison (•). The data are normalized against the initial time point to facilitate comparison. Insets: when plotted on the semi-log scale, the bulk degradation kinetics is close to linear (first-order), whereas the single-cell dynamics is curved (zero-order) for LAA only.
To eliminate the potential effect of residual IPTG, we added chloramphenicol, a translation inhibitor, to the media during protein degradation measurements. The discrepancy between single-cell and population kinetics still existed (Supplementary Figure S1), indicating that residual IPTG was not the cause for the observed phenomenon. In addition, a quantitative western blot showed that the initial GFP–LAA level at population level is higher than 10 μM (data not shown), which is much larger than the Km of ClpXP (75 nM) for LAA-tagged protein (Hersch et al, 2004). Thus, it is reasonable to observe that the degradation kinetics of LAA-tagged protein is zeroth-order.
In contrast, GFP tagged with ASV, which has a longer half-life, displays first-order degradation kinetics at both the single-cell and the population levels (Figure 1C and D). It is possible that the LAA- and ASV-tagged proteins may be degraded by different proteases. The more dominate protease for the degradation of LAA-tagged protein is ClpXP, whereas ClpAP plays a minor role (Farrell et al, 2005). The last three amino acids of the ssrA tag have been shown to be the binding site for ClpX (Flynn et al, 2001). Therefore, proteases other than ClpXP may also be responsible for the degradation of GFP–ASV. Using the Keio-knockout collection (Baba et al, 2006), we showed that the ΔclpX strain showed more proteolytic activity than the ΔclpA strain (Supplementary Figure S2). This result suggests that ClpAP plays a more significant role in the degradation of ASV-tagged proteins. This finding may explain the difference in the single-cell degradation kinetics between the LAA- and ASV-tagged proteins.
The GFP–LAA level has a wide distribution
To prove the cause of the kinetic discrepancy between single-cell and population measurements, we found that the initial protein level distribution from the LAA experiment displays a long-tailed distribution with a range over 160-fold (Figure 2A). Averaging the single-cell data from the LAA experiment produced a first-order degradation kinetics, consistent with the measurements performed in bulk solutions (Figure 2B). The large initial protein distribution could be caused by plasmid instability. We tested this possibility by measuring the percentage of cells that still retains the plasmid after induction with IPTG. After 2, 3, and 4 h of induction, we plated approximately 200 cells onto a LB plate without any antibiotics and allowed the cells to growth overnight. We picked 100 colonies to test for ampicillin resistance (the antibiotic resistance in the GFP expression plasmid) and all 100 colonies grew in the presence of ampicillin. Therefore, plasmid lost during the course of induction does not seem to be the cause of the long-tailed distribution observed in our experiments.
Figure 2.

Experimentally determined initial protein distribution and population average of single-cell data. (A) Initial protein distribution from the single-cell measurements of GFP–LAA. The distribution is long-tailed and similar to the exponential distribution. The range ratio is over 160-fold. The black line represents a fitted exponential distribution of the initial protein level. (B) The average of single-cell data from microscopy (+) also gives first-order kinetics, similar to the bulk measurements using a fluorescence platereader (▴). The data are normalized to the initial time point to allow comparison between different types of measurements.
To avoid overrepresentation of the cells expressing low levels of GFP, we excluded the cells with low GFP level (first bar in Figure 2A) in the analysis. This elimination decreased range ratio to ∼10 (first bar in Figure 2A), but did not alter the masking effect by population diversity (Supplementary Figure S3). Excluding more low-GFP cells further reduced the range distribution and gradually eliminated the discrepancy between single-cell and population measurements.
The non-Gaussian, long-tailed distribution of proteins was also observed elsewhere (Krishna et al, 2005). The long-tailed distribution is proposed to be caused by the noise in molecular partitioning during cell division and the noise in protein synthesis rate (Krishna et al, 2005).
Discrepancy between single-cell and population measurements is explained by wide distributions of protein or protease levels
To explain how a population of cells exhibiting zeroth-order kinetics at the single-cell level can create a first-order kinetics at the population level, we developed a stochastic model based on the Gillespie algorithm (Gillespie, 1976) to simulate the proteolysis (see Supplementary Information, for more detail). We first tested the hypothesis that initial protein distribution resulted from protein expression noise is the cause of this discrepancy. The initial protein level, ao, varies for different cells following either an exponential or a normal distribution, and the degradation kinetics for each cell is modeled using the Michaelis–Menten kinetics with a Km smaller than the protein level (zeroth-order degradation). One thousand cells were used in each simulation. When ao follows the exponential distribution, the population average of the zeroth-order degradation kinetics from single-cell becomes first-order, provided that the range of distribution is sufficiently large (Figure 3A). This is not true, however, for normally distributed ao, regardless of the range of the distribution (Figure 3B).
Figure 3.

Theoretical analysis of the discrepancy between single-cell and population measurements for LAA-tagged proteins. (A) Average of single-cell stochastic simulation of the zeroth-order degradation kinetics with exponentially distributed initial protein levels. Each line is an average of 1000 cells with degradation kinetics that falls into the zeroth-order regime. Different line represents different range ratio of the initial protein distribution. Range ratio is defined as the highest protein level divided by the lowest protein level at time=0. When the range ratio becomes sufficiently large, the dynamics approaches first-order. (B) Average of single-cell stochastic simulation of the degradation kinetics with normally distributed initial protein levels. With the same range ratios as exponential distribution, normal distribution of initial protein levels does not approach first-order kinetics. (C, D) Average of single-cell stochastic simulation of the degradation kinetics with exponentially (C) and normally (D) distributed protease levels. The initial protein level is the same for all cells in this simulation. Exponential protease distribution will also create first-order kinetics using the same range ratio as the exponential initial protein distribution in (A). With normal protease distribution, high- and low-range ratio causes deviation from first-order kinetics at the population level.
We also investigated the role of protease distribution on the discrepancy. We performed the simulation with an exponentially or a normally distributed protease levels, but with no initial protein distribution. Given a large enough range ratio, both exponential and normal protease distributions caused the population degradation dynamics to appear first-order (Figure 3C and D). These results demonstrate that a wide distribution in either the protein expression level or the protease level could distort the protein degradation kinetics in a population average.
As our experimental data displayed a wide (160-fold) exponential distribution of initial proteins, this condition is sufficient to give rise to the apparent first-order kinetics at the population level from the zeroth-order single-cell dynamics. The presence of protease distribution, however, might further contribute to the masking effect as well. In contrast, the first-order degradation kinetics in single cells will produce first-order degradation kinetics at the population level, regardless of the population diversity.
Analytical modeling of the protein degradation kinetics
We constructed an analytical model to examine the effect of initial protein level distribution on the population kinetics (see Supplementary Information for more detail). For simplicity, we let the zeroth-order protein degradation rates be identical in each cell. The single-cell zeroth-order degradation kinetic is represented by
where P(ao, kd, t) is the concentration of the protein, ao is the initial protein concentration, kd is the degradation rate and t is the time. We first allowed the initial protein level, ao, to follow an exponential distribution ranging from a to b. When averaged over all cells, the degradation kinetics is separated into three regions: (i) no cell has reached the zero protein level (kdt⩽a), (ii) some cells have reached the zero protein boundary (a⩽kdt⩽b), and (iii) all the proteins are degraded in all cells (kdt⩾b). The first region will always be zeroth-order, and the third region will always be a flat line (slope equals to zero). The second region, however, is exponential in time. The size of the second region depends on the range of distribution. In the limiting case where the distribution is infinitely wide, a → 0 and b → ∞, then we have  which is exactly an exponential form with the initial concentration corresponding to the mean of the initial GFP distribution. Thus, the range of the exponential distribution defines the deviation from the first-order kinetics. Because the range of distribution of the initial GFP level observed in our single-cell measurement is over 160-fold (Figure 2A), it is sufficient to give rise to the first-order kinetics that we obtained from bulk measurement. When the initial protein level follows a normal distribution, the population average contains an exponential term raised to t2, plus other time-dependent terms (Supplementary Information). Therefore, normally distributed initial protease level will not yield exact first-order population degradation kinetics.
We also derived an analytical solution for the case where the degradation rate, which is related to the protease level, follows an exponential or a normal distribution (Supplementary Information). The resulting analytical solution of the population dynamics yields a nonlinear combination of exponential terms. A combination of initial protein and protease distribution can also create an apparent first-order population degradation kinetics.
Zeroth-order protein degradation kinetics enhances the robustness of gene-metabolic oscillator
We also investigated the effect of protein degradation on synthetic oscillators. We used the metabolator (Fung et al, 2005) as an example, which is a synthetic gene-metabolic oscillator that integrates transcriptional regulation into the metabolism to generate oscillation. The metabolator is consisted of a flux-carrying network with two interconvertible metabolite pools: Acetyl-CoA (AcCoA) and Acetyl-phosphate (AcP) (Figure 4A). These two pools of metabolites are catalyzed by two enzymes, phosphotransacetylase (pta) and acetyl-CoA synthetase (acs). The expression of pta and acs are negatively and positively regulated by AcP, respectively. The oscillation dynamics of the metabolator is driven by the glycolytic flux. The integration of genetic and metabolic control is a hallmark found in many natural oscillators (Hirota et al, 2002; Rutter et al, 2002; Rudic et al, 2004; Turek et al, 2005).
Figure 4.

Effect of zero-order degradation kinetics on the metabolator. (A) Network diagrams of the metabolator. The promoter glnAp2 is activated by AcP. The promoter lacO1 is repressed by LacI. All proteins are tagged with the LAA degradation tag (Fung et al, 2005). (B) Phase diagram of the zeroth-order degradation rate, kd,0, and first-order degradation rate, kd,1, for the metabolator model. The presence of zeroth-order protein degradation enlarges the parameter space for oscillation. When the zero-order degradation rate is zero (x-axis), the current model reduces to the original model. The point on the x-axis indicates the degradation rate used in the original metabolator model (see Supplementary Information for details of the model and parameters). (C) Phase diagram of the relative copy numbers acs and pta to lacI when the degradation kinetics is zeroth- and first-order. (D) Oscillation dynamics using parameters that lay outside of the first-order region, but inside the zero-order region. The point is represented by a triangle in (C).
In the original metabolator model (Fung et al, 2005), protein degradation was described as a first-order process, which was lumped together with the term describing dilution by cell growth. To investigate the effect of protein degradation kinetics, we modified the original model by including a Michaelis–Menten kinetics for protein degradation, 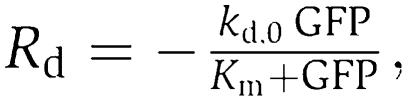 with a Km of 75 nM (Hersch et al, 2004) (see Supplementary Information). Thus, this current model includes a protein degradation kinetics that falls in the zeroth-order regime and a first-order protein dilution due to cell growth. When the zeroth-order degradation rate, kd,0, is equals to zero, the current model reduces to the original model where only the first-order degradation term exists. Linear stability analysis was then used to map the parametric loci that give rise to Hopf bifurcation (See Supplementary Information for details). Figure 4B shows that by including the zeroth-order process, the parameter space of oscillation significantly increased. When kd,0=0, the x-axis represents the range of first-order degradation rate, kd,1, at which oscillations will occur with the original model. Increasing kd,0 significantly enlarges the parameters space that leads to oscillation.
We also explored the effect of the zeroth-order degradation kinetics on other parameters of the metabolator. We chose the parameters for the zeroth-order degradation based on literature data (Hersch et al, 2004; Farrell et al, 2005). The phase diagram in Figure 4C shows that the zero-order degradation kinetics gives a larger oscillatory region than the first-order degradation kinetics. A point on the phase diagram is chosen so that it falls within the zero-order boundary, but outside of the first-order boundary. Using this set of parameters, the model with first-order degradation kinetics reaches a stable steady state (no oscillation), whereas the model with zero-order degradation displays oscillation (Figure 4D).
As the actual kinetic parameters for various components in the synthetic circuit are unknown, the enlarged parameter space for oscillation enhances the robustness of the design in the presence of uncertainty. The enlarged parameter space for oscillation when zeroth-order protein degradation occurs is attributed to the insensitivity of the degradation rate to the protein level. In this situation, proteins degrade at the same rate even when the concentration is low, thus causing the protein level to pass through its stationary point. This insensitivity to the protein level control is more likely to generate instability and oscillation. First-order degradation, however, adjusts the degradation rate according to the protein concentration. Hence, the first-order degradation is more likely to maintain a steady state.
Discussion
This work demonstrates a discrepancy between single-cell and population measurements. Typically, single-cell measurements are important when multimodal distribution or asynchronous dynamics exists. We showed that even single-modal and synchronous single-cell dynamics can be masked by population heterogeneity, depending on the initial protein or the protease distribution. When the initial protein or protease level exhibits a wide exponential distribution, the zeroth-order protein degradation in single cell will appear to be first-order as a population average. In the example shown here, GFP–LAA level follows an exponential distribution with a wide dispersion (160-fold), which is sufficient to explain the first-order kinetics observed in population. Coupling with protease distribution can also create first-order population kinetics from zeroth-order single-cell kinetics.
The phenomenon described here also can explain differences between in vivo and in vitro protein degradation measurements. For example, the Km value of ClpAP in vivo (Farrell et al, 2005) has been estimated to be 10-fold higher than the Km value measured in vitro (Flynn et al, 2001). This difference may be caused by the masking effect of population heterogeneity. Therefore, when considering the differences between in vivo and in vitro measurement, population heterogeneity might also need to be accounted for.
Zeroth-order kinetics had been shown to generate ultrasensitivity in enzymatic systems such as isocitrate dehydrogenase (LaPorte and Koshland, 1983) and glycogen phospholyase (Meinke et al, 1986). The ultrasensitivity created by zeroth-order kinetics had been proposed to play an important role in developmental threshold (Goldbeter and Wolpert, 1990) and the responses to morphogen gradients in Drosophila embryonic ventral ectoderm (Melen et al, 2005). Here, we show that zeroth-order protein degradation expands the parameter space for oscillation in the metabolator (Fung et al, 2005). Interestingly, the LAA ssrA-tagged protein degradation, which was used in the metabolator (Fung et al, 2005), displays a zeroth-order kinetics when measured in single cells and may enhance the robustness of the synthetic circuit. However, the exact model for oscillation could not be ascertained until all kinetics involved are determined.
Zeroth-order degradation is generated when the level of protein is significantly higher than the Km of the protease. Hence, the protein level does not have to be high per se to achieve zeroth-order degradation. In addition, protein localization can further enhance the local concentration of the protein relative to the protease, thus allow the degradation kinetics to occur in the zeroth-order regime even when the number of protein per cell is lower than the Km. Zeroth-order degradation by ClpXP was also observed in the degradation of CtrA, a master regulator in Caulobacter crescentus cell-cycle regulation (Chien et al, 2007). The activity of CtrA is regulated by proteolysis and phosphorylation (Jenal and Fuchs, 1998; Holtzendorff et al, 2004; Biondi et al, 2006). A recent in vitro experiment has shown that CtrA degradation by ClpXP displays a low Km value which is comparable to its counterpart in E. coli, when the adaptor molecule SspB is present (Chien et al, 2007). Therefore, CtrA can potentially be degraded with a zeroth-order kinetics inside C. crescentus and enhance the cell-cycle oscillation as well.
Materials and methods
Strains and plasmids
GFPmut3.1−LAA and GFPmut3.1−ASV was cloned into pZE12-luc between KpnI and XbaI restriction sites through PCR cloning, with the degradation sequence flanked at the end of the reverse primer and transformed into DH5αZ1 (both pZE12-luc and DH5αZ1 are gifts of Lutz and Bujard (1997)). For measuring the degradation dynamics, pZE12-gfpmut3.1−aav was then transformed into BW25113, which contains a native copy of lacI, along with pTB114, a pCL1920-derived plasmid with a copy of lacIq.
Single-cell time-lapsed microscopy
Overnight cultures in M9 minimal media supplemented with 0.5% (w/v) glucose, 1 mM MgSO4, 1 μg/ml vitamin B1, 100 μM CaCl2, 100 μg/ml ampicillin, and 50 μg/ml of spectinomycin, were diluted into 10 ml of fresh media in a shake flask at initial OD 0.1 and grew for about 20 min before addition of 2 mM IPTG at 37°C. After 1–3 h of induction, 1 ml of cells was harvested, (OD∼0.2–0.8) washed once, and resuspended in M9 minimal media with 20 mM of acetate with or without chloramphenicol. During this period, no protein synthesis occurred and GFP degradation kinetics was measured. The cells were then transferred to an agar pad containing M9 minimal media with 20 mM acetate, supplements and antibiotics, and seal with a coverslip, as described in Rines et al (2002). Time-lapse microscopy was performed using a Nikon TE2000-S microscope with a × 60 DIC oil immersion objective. Images were captured using a Cascade:650 from Roper Scientific controlled through Metamorph software. The temperature of the samples was maintained at approximately 37°C by an objective heater. Brightfield (0.1 s) and epifluorescence (0.1 s) images were captured every 1–5 min, with both light sources shuttered between exposures. The nutrient downshift caused a growth lag for around 3 h (Kao et al, 2004), thus remove the effects of cell division from proteolysis. In a typical experiment, 100–200 cells were monitored.
Image analysis
The single-cell protein degradation kinetics was extracted by automated image analysis software. The time-series bright field images were used to generate a region mask for each cell. To create the mask, we first utilized the background flattening and shading correction function by the Metamorph software. The corrected images were then converted to binary images with a predefined threshold and segmented by custom-made software in MATLAB (the Mathworks Inc.). An area filter was applied to all segmented region to remove small areas caused by noise. An iterative algorithm was applied to track individual cells along time-series images and enumerate each tracked region. Finally, the numbered region masks were applied to the fluorescent images to obtain the mean fluorescent intensity of each cell at each time point.
Population measurements using fluorescence microplate reader
GFP expressed cultures for the bulk degradation kinetics experiments were prepared in the same way as in the experiments using time-lapsed microscopy. The cells were in the same media and initial cell density as the microscopy experiment and induced with 2 mM of IPTG until the OD is around 0.2–0.8. When the cells were ready for the experiment, the cells were washed once and either diluted or concentrated to OD∼0.3. A 200 μl portion of the diluted culture was transferred to 96-wells plates (Corning) with black walls and clear bottom. For each experiment, 4–8 wells were used. A 50 μl portion of silicon oil was added to each well to prevent evaporation (Dekel and Alon, 2005). The plate was then incubated in the microplate reader (Molecular Device, SpectraMax Gemini XS) at 37°C with high-intensity continuous shaking. Fluorescence measurements were taken every 3–5 min.
Mathematical modeling
The deterministic model of metabolator was simulated with Matlab and Mathematica. The phase diagram was generated with MatCont (Dhooge et al, 2003). The stochastic modeling was performed using Matlab. The detail of the model can be found in Supplementary Information.
Supplementary Material
Supplementary Information
Acknowledgments
This work was partially funded by the Center for Cell Mimetic Space Exploration, a NASA University Research, Engineering, and Technology Institute and NSF ITR grant CCF-0326605. WWW is supported by the UCLA Dissertation Year Fellowship. JCL is a member of California NanoSystems Institute and UCLA-DOE Institute for Genomics and Proteomics. We thank Jonathan Young and Linh M Tran for some of the initial data collection and analysis.
References
- Andersen JB (1998) New unstable variants of green fluorescent protein for studies of transient gene expression in bacteria. Appl Environ Microbiol 64: 2240–2246 [DOI] [PMC free article] [PubMed] [Google Scholar]
- Atkinson MR, Savageau MA, Myers JT, Ninfa AJ (2003) Development of genetic circuitry exhibiting toggle switch or oscillatory behavior in Escherichia coli. Cell 113: 597–607 [DOI] [PubMed] [Google Scholar]
- Austin DW, Allen MS, McCollum JM, Dar RD, Wilgus JR, Sayler GS, Samatova NF, Cox CD, Simpson ML (2006) Gene network shaping of inherent noise spectra. Nature 439: 608–611 [DOI] [PubMed] [Google Scholar]
- Baba T, Ara T, Hasegawa M, Takai Y, Okumura Y, Baba M, Datsenko KA, Tomita M, Wanner BL, Mori H (2006) Construction of Escherichia coli K-12 in-frame, single-gene knockout mutants: the Keio collection. Mol Syst Biol 2: 2006.0008 10.1038/msb4100050 [DOI] [PMC free article] [PubMed] [Google Scholar]
- Basu S, Gerchman Y, Collins CH, Arnold FH, Weiss R (2005) A synthetic multicellular system for programmed pattern formation. Nature 434: 1130–1134 [DOI] [PubMed] [Google Scholar]
- Becskei A, Serrano L (2000) Engineering stability in gene networks by autoregulation. Nature 405: 590–593 [DOI] [PubMed] [Google Scholar]
- Becskei A, Seraphin B, Serrano L (2001) Positive feedback in eukaryotic gene networks: cell differentiation by graded to binary response conversion. EMBO J 20: 2528–2535 [DOI] [PMC free article] [PubMed] [Google Scholar]
- Biondi EG, Reisinger SJ, Skerker JM, Arif M, Perchuk BS, Ryan KR, Laub MT (2006) Regulation of the bacterial cell cycle by an integrated genetic circuit. Nature 444: 899–904 [DOI] [PubMed] [Google Scholar]
- Buchler NE, Gerland U, Hwa T (2005) Nonlinear protein degradation and the function of genetic circuits. Proc Natl Acad Sci USA 102: 9559–9564 [DOI] [PMC free article] [PubMed] [Google Scholar]
- Bulter T, Lee SG, Wong WW, Fung E, Connor MR, Liao JC (2004) Design of artificial cell–cell communication using gene and metabolic networks. Proc Natl Acad Sci USA 101: 2299–2304 [DOI] [PMC free article] [PubMed] [Google Scholar]
- Chien P, Perchuk BS, Laub MT, Sauer RT, Baker TA (2007) Direct and adaptor-mediated substrate recognition by an essential AAA+ protease. Proc Natl Acad Sci USA 104: 6590–6595 [DOI] [PMC free article] [PubMed] [Google Scholar]
- Dekel E, Alon U (2005) Optimality and evolutionary tuning of the expression level of a protein. Nature 436: 588–592 [DOI] [PubMed] [Google Scholar]
- Dhooge A, Govaerts W, Kuznetsov YA (2003) A matlab package for numerical bifurcation analysis of ODEs. ACM Trans Math Software 29: 141–164 [Google Scholar]
- Elowitz MB, Leibler S (2000) A synthetic oscillatory network of transcriptional regulators. Nature 403: 335–338 [DOI] [PubMed] [Google Scholar]
- Farmer WR, Liao JC (2000) Improving lycopene production in Escherichia coli by engineering metabolic control. Nat Biotechnol 18: 533–537 [DOI] [PubMed] [Google Scholar]
- Farrell CM, Grossman AD, Sauer RT (2005) Cytoplasmic degradation of ssrA-tagged proteins. Mol Microbiol 57: 1750–1761 [DOI] [PubMed] [Google Scholar]
- Flynn JM, Levchenko I, Seidel M, Wickner SH, Sauer RT, Baker TA (2001) Overlapping recognition determinants within the ssrA degradation tag allow modulation of proteolysis. Proc Natl Acad Sci USA 98: 10584–10589 [DOI] [PMC free article] [PubMed] [Google Scholar]
- Fung E, Wong WW, Suen JK, Bulter T, Lee SG, Liao JC (2005) A synthetic gene-metabolic oscillator. Nature 435: 118–122 [DOI] [PubMed] [Google Scholar]
- Gardner TS, Cantor CR, Collins JJ (2000) Construction of a genetic toggle switch in Escherichia coli. Nature 403: 339–342 [DOI] [PubMed] [Google Scholar]
- Gillespie D (1976) A general method for numerically simulating the stochastic time evolution of coupled chemical reactions. J Comp Phys 22: 403–434 [Google Scholar]
- Goldbeter A, Wolpert L (1990) Covalent modification of proteins as a threshold mechanism in development. J Theor Biol 142: 243–250 [DOI] [PubMed] [Google Scholar]
- Gottesman S, Roche E, Zhou Y, Sauer RT (1998) The ClpXP and ClpAP proteases degrade proteins with carboxy-terminal peptide tails added by the SsrA-tagging system. Genes Dev 12: 1338–1347 [DOI] [PMC free article] [PubMed] [Google Scholar]
- Hersch GL, Baker TA, Sauer RT (2004) SspB delivery of substrates for ClpXP proteolysis probed by the design of improved degradation tags. Proc Natl Acad Sci USA 101: 12136–12141 [DOI] [PMC free article] [PubMed] [Google Scholar]
- Hirota T, Okano T, Kokame K, Shirotani-Ikejima H, Miyata T, Fukada Y (2002) Glucose down-regulates Per1 and Per2 mRNA levels and induces circadian gene expression in cultured Rat-1 fibroblasts. J Biol Chem 277: 44244–44251 [DOI] [PubMed] [Google Scholar]
- Holtzendorff J, Hung D, Brende P, Reisenauer A, Viollier PH, McAdams HH, Shapiro L (2004) Oscillating global regulators control the genetic circuit driving a bacterial cell cycle. Science 304: 983–987 [DOI] [PubMed] [Google Scholar]
- Jenal U, Fuchs T (1998) An essential protease involved in bacterial cell-cycle control. EMBO J 17: 5658–5669 [DOI] [PMC free article] [PubMed] [Google Scholar]
- Kao KC, Yang YL, Boscolo R, Sabatti C, Roychowdhury V, Liao JC (2004) Transcriptome-based determination of multiple transcription regulator activities in Escherichia coli by using network component analysis. Proc Natl Acad Sci USA 101: 641–646 [DOI] [PMC free article] [PubMed] [Google Scholar]
- Kim PM, Tidor B (2003) Limitations of quantitative gene regulation models: a case study. Genome Res 13: 2391–2395 [DOI] [PMC free article] [PubMed] [Google Scholar]
- Krishna S, Banerjee B, Ramakrishnan TV, Shivashankar GV (2005) Stochastic simulations of the origins and implications of long-tailed distributions in gene expression. Proc Natl Acad Sci USA 102: 4771–4776 [DOI] [PMC free article] [PubMed] [Google Scholar]
- LaPorte DC, Koshland DE Jr (1983) Phosphorylation of isocitrate dehydrogenase as a demonstration of enhanced sensitivity in covalent regulation. Nature 305: 286–290 [DOI] [PubMed] [Google Scholar]
- Lutz R, Bujard H (1997) Independent and tight regulation of transcriptional units in Escherichia coli via the LacR/O, the TetR/O and AraC/I1[ndash]I2 regulatory elements. Nucleic Acids Res 25: 1203–1210 [DOI] [PMC free article] [PubMed] [Google Scholar]
- McGinness KE, Baker TA, Sauer RT (2006) Engineering controllable protein degradation. Mol Cell 22: 701–707 [DOI] [PubMed] [Google Scholar]
- Meinke MH, Bishop JS, Edstrom RD (1986) Zero-order ultrasensitivity in the regulation of glycogen phosphorylase. Proc Natl Acad Sci USA 83: 2865–2868 [DOI] [PMC free article] [PubMed] [Google Scholar]
- Melen GJ, Levy S, Barkai N, Shilo BZ (2005) Threshold responses to morphogen gradients by zero-order ultrasensitivity. Mol Syst Biol 1: 2005.0028 10.1038/msb4100036 [DOI] [PMC free article] [PubMed] [Google Scholar]
- Rines DR, He X, Sorger PK (2002) Quantitative microscopy of green fluorescent protein-labeled yeast. Methods Enzymol 351: 16–34 [DOI] [PubMed] [Google Scholar]
- Rudic RD, McNamara P, Curtis AM, Boston RC, Panda S, Hogenesch JB, Fitzgerald GA (2004) BMAL1 and CLOCK, two essential components of the circadian clock, are involved in glucose homeostasis. PLoS Biol 2: e377. [DOI] [PMC free article] [PubMed] [Google Scholar]
- Rutter J, Reick M, McKnight SL (2002) Metabolism and the control of circadian rhythms. Annu Rev Biochem 71: 307–331 [DOI] [PubMed] [Google Scholar]
- Turek FW, Joshu C, Kohsaka A, Lin E, Ivanova G, McDearmon E, Laposky A, Losee-Olson S, Easton A, Jensen DR, Eckel RH, Takahashi JS, Bass J (2005) Obesity and metabolic syndrome in circadian Clock mutant mice. Science 308: 1043–1045 [DOI] [PMC free article] [PubMed] [Google Scholar]
- You L, Cox RS III, Weiss R, Arnold FH (2004) Programmed population control by cell-cell communication and regulated killing. Nature 428: 868–871 [DOI] [PubMed] [Google Scholar]
Associated Data
This section collects any data citations, data availability statements, or supplementary materials included in this article.
Supplementary Materials
Supplementary Information