

Abstract
Research on comorbidity across cancer symptoms, including pain, fatigue, and depression, could suggest if crossover effects from symptom-specific interventions are plausible. Secondary analyses were conducted on a survey of 268 cancer patients with recurrent disease from a northeastern U.S. city who were initiating palliative radiation for bone pain. Moderator regression analyses predicted variation in depressive affect that could be attributed to symptom clusters. Patients self-reported difficulty controlling each physical symptom over the past month on a Likert scale and depressive symptoms on a validated depression measure (Center for Epidemiologic Studies-Depression [CES-D]) over the past week on a four-category scale. An index of depressive affect was based on items of negative and positive affect from the CES-D. In predicting depressive affect, synergistic interactions of pain with fever, fatigue, and weight loss suggest separate pathways involving pain. A similar interaction with fever occurs when nausea was tested in place of pain. Further, the interaction between pain and fatigue is similar in form to the interaction between difficulty breathing and fatigue (when sleep is not a problem). Follow-up to the latter interaction reveals: 1) additional moderation by hypertension and palliative radiation to the hip/pelvis; and 2) a similar cluster not involving hypertension when appetite problems and weight loss were tested in place of fatigue. The significance and form of these interactions are remarkably consistent. Similar sickness mechanisms could be generating: 1) pain and nausea during fever; 2) pain and fatigue during weight loss; and 3) pain and breathing difficulty when fatigue is pronounced. Crossover effects from symptom-specific interventions appear promising.
Keywords: Comorbidity, depression, effect modifiers (epidemiology), palliative care
Introduction
A recent call for research on symptom comorbidity emphasizes the potential for insights into the trajectory of the dying process and into effective models for palliative and end-of-life care.1 Similarly, two recent conferences by the National Institutes of Health on symptom management in cancer and in terminal illness underscore the absence of research on the comorbid presentation of symptoms such as pain, depression, fatigue, and dyspnea (difficulty breathing), despite separate bodies of empirical findings for each of these symptoms.2,3 The need for research is suggested not only by the fact that pain, depression, and fatigue are each highly prevalent but by clinical interest that interventions for one of these symptoms (e.g., pain) could display crossover effects that involve either or both of the other symptoms (i.e., fatigue, depression) or related symptoms (e.g., dyspnea).
For instance, although multiple mechanisms for fatigue are known to exist, they are not well understood, and evidence-based pharmacologic interventions are quite limited (exception: erythropoietin in anemia4). Crossover effects from treatment of pain or depression would suggest shared pathways across these symptoms. Crossover effects could involve any of the multiple mechanisms that are associated with fatigue: chemotherapy-induced anemia with co-occurring dyspnea, muscle mass loss, nutritional deficits, hormone shifts, accumulation of products of cell death, release of specific cytokines during the immune response, dehydration, sleep disruption, and neurotransmitter changes.
Cross-sectional surveys of patient physical symptoms could provide preliminary epidemiological support for the plausibility of crossover effects by establishing whether a symptom (e.g., depression) can be predicted by the synchronistic interaction of two co-occurring symptoms (e.g., pain-fatigue) beyond their separate, individual effects. The cross-sectional sample in the current study affords an ideal opportunity because these patients were just initiating palliative radiation to relieve bone pain. Metastatic bone pain is the most common cancer pain syndrome,5 has a relatively long clinical course, and is not adequately treated by many physicians despite the fact that palliative radiation is widely available as the gold standard for treatment and for the prevention of breakthrough pain.6
The Relationship of Depression to Pain and Other Symptoms
The literature commonly assumes a bidirectional causal relationship between pain and depression. The onset of pain may lead to the development of depression, which in turn may increase sensitivity to pain. These alternate pathways may mean that correlations between these two variables reflect only a partial or attenuated portion of the full relationship, especially since the pain–depression relationship may be moderated by other variables, such as fatigue or weight loss.
Evidence from retrospective and longitudinal studies with cancer patients suggests that pain, other symptoms, metastasis, and radiation treatment are causes of depression. When cancer patients with low versus high pain symptoms were compared, lifetime depression was higher in the group with low pain, whereas diagnosis of current major depression was higher in the group with high pain. These findings support pain as a cause of depression.7 Similarly, metastasis and pain, but not lifetime depression, were found to be greater among currently depressed patients compared to non-depressed patients, suggesting metastasis and pain as causes of depression.8 A longitudinal study found that social functioning, symptom severity, and radiation treatment significantly predicted depressive symptomatology.9
Depression may also cause increased sensitivity to cancer pain. Reduced levels of serotonin, whichresultin feelings of depressionin humans, have also been found to increase pain sensitivity and reduce pain tolerance in animals.10
Furthermore, competing explanations involving third variables, which suggest the presence of symptom clusters, should be considered. Symptoms of fatigue, dyspnea, and nausea, which may be aggravated through the use of opioids or during the anorexia-cachexia syndrome, may shift the threshold or perceived severity of pain.11,12
The symptom cluster of pain and fatigue was found to be associated with 1) depression and insomnia,13,14 2) a greater number of concurrent symptoms than when pain or fatigue was present alone,15 and 3) bone metastasis and palliative care.16 The level of fatigue itself may be influenced not only by pain, but by fever, dyspnea, trouble sleeping, nausea, appetite loss, weight loss, and functional impairment.17 For instance, as an indication of the sickness response, as well as a symptom of immunosuppression and infection, fever can lead to fatigue.18,19 Therefore, part of the malaise associated with the pain-fatigue symptom cluster may be due to the contribution of fever to fatigue.
Similarly, other symptoms that influence fatigue may explain additional malaise attributed to the pain-fatigue cluster. The potential for crossover effects on the depression-pain relationship by highly prevalent moderator variables, such as fatigue and its components, is beginning to stimulate research on antidepressants that reduce fatigue, contributing symptoms, and pain in patients with depression.11 In addition, because fatigue itself is a component of depression, the search for antidepressants that relieve fatigue in the absence of depression could also be beneficial.20
Sickness Behavior and Cytokine Pathways in Cancer
The holistic paradigm of “sickness behavior” (SB) provides an explanatory mechanism.21–27 Raised body temperature is the initial and most common symptom during immune activation in mammals experiencing acute infection or inflammatory illness. Non-essential activities slow or cease (like digestion) and the reclaimed energy is diverted into optimal immune activation. The build-up of proinflammatory cytokines induces fatigue, nausea, anhedonia, appetite loss and anorexia, somnolence, aches, and increased pain sensitivity.
SB is characterized by feelings of malaise that help conserve energy by reducing motivation for activity and mobility. Malaise can progress from depressive affect (negative affect and/or low positive affect) into a syndrome that strongly overlaps major depressive disorder (MDD). This progression may involve multiple pathways involving cytokines (direct28 and indirect29–33 activation of the hypothalamic-pituitary-adrenal (HPA) axis, alteration of mono-amine neurotransmitters in multiple brain regions,34 and cytokines serving as neurotransmitters in the central nervous system35,36). The potency of pathways involving cytokines is suggested by the rapid and undesirable side effect of MDD from the therapeutic use of cytokines, such as interferon and interleukins, in cancer treatment.37,38
The most common symptoms in cancer patients, fatigue and weakness, manifest as part of a process of bodily energy imbalance that parallels disturbances in the delicate balance of counteracting cytokines.19,39 Simultaneous sources of inflammation result from tumor cell growth, emissions, and toxicity; bone breakdown into the bloodstream; immune system reactivity; cancer treatment toxicity; and metastasis and disease progression. As a result, the natural balance is disrupted between proinflammatory cytokines and their cytokine antagonists that reduce inflammation. Thus, imbalance in chronic inflammatory processes is associated with the buildup of proinflammatory cytokines, which can operate widely and simultaneously through “peripheral” and “central” nervous system effects.
For instance, neuropathic pain from tumor-related damage of peripheral nerves may be exceedingly prolonged because immune cells that secrete proinflammatory cytokines continue to be attracted to the site.40,41 This process also appears to activate proinflammatory cytokines within the spinal cord42 and triggers heightened pain sensitivity across even distant body sites.41
The stress signal from this imbalance in proinflammatory cytokines and inflammatory processes stimulates the HPA axis to release cortisol, which can lead to depression,43 and corticotrophin-releasing factor, which can lead to anorexia and increases in metabolism.44 Moreover, psychological symptoms (sadness, anhedonia, cognitive disturbance) and neurovegetative symptoms of depression (loss of appetite, fatigue, altered sleep) are precipitated by the use of cytokine therapies (interleukin-2 and interferon-α) to treat cancer.45,46 Finally, cytokine imbalance in cancer patients may lead to sleep loss, which in turn impairs immune function.47
Proinflammatory cytokines can be classified according to their function in promoting inflammation. Proinflammatory cytokines that serve as growth factors (erythropoietin, different forms of interleukin, and tumor necrosis factor) also stimulate the immune system, which leads to the production of other proinflammatory cytokines. Some of the same proinflammatory cytokines that serve as growth factors can also be classified with others as either cachetins or pyrogens. Cachetins (interleukin-1, interleukin-6, tumor necrosis factor, interferon-γ, and leukemia inhibitory factor) induce weight loss by disrupting the homeostatic loop of body weight control, and pyrogens (interleukin-1, tumor necrosis factor, interleukin-2, interleukin-6, interleukin-12, interferon, and so forth) induce fever. Like cytokines that serve as growth factors, cachetins and pyrogens induce fatigue and influence symptoms and conditions that contribute to fatigue, including fever, anorexia, cachexia, pain, nausea, dyspnea, anemia, sleep loss, and depression.19,48,49
The different physiological processes inherent across these three classifications of cytokines imply that fatigue and weakness related to growth factors, weight loss, and fever should be distinguished from other sources of fatigue/weakness whenever possible. For instance, it is common for cancer patients to experience weakness from low-grade fever unrelated to infection that is caused by cancer-related etiology.19 On the other hand, viral infections evoke an interferon response that generates not only fever and weakness but malaise and flu-like symptoms typical of sickness behavior. Moreover, cancer-related causes for low-grade fever should not be assumed since the use of NSAIDs50 or the experience of chronic, low-grade infections could also result in low-grade fever, as well as fatigue, weakness, and flu-related symptoms.
Other symptoms (nausea, pain, dyspnea) that aggravate malaise are considered as additional components within fever- and fatigue-based symptom clusters that may operate through various pathways. Within co-occurring symptoms that appear to manifest simultaneously, one symptom may aggravate the other, both symptoms may influence each other, or both symptoms may appear to co-occur as a result of indirect processes that link them. For instance, pain and pain interventions, such as the use of opioids, may appear to co-occur with fever and fatigue. However, pain and pain interventions may influence fever and fatigue, be mutually influenced by them, or be linked indirectly to them through pain-related stress responses.39,51 Nausea may result in similar direct and indirect impacts with fever or fatigue, which may stem from opioid use, constipation, and continuing chemotherapy. Finally, dyspnea in the context of fatigue suggests the fatigue state of anemia, whereas physical distress from the symptom of dyspnea alone may contribute separately beyond any impact from anemia.
Anemia should be distinguished from other cancer fatigue. Anemia can result from excessive tumor demand for blood, due to a blunted endogenous erythropoietin response (renal insufficiency) or from bone marrow infiltration by cancer. Both mechanisms impair erythropoietin stimulation of bone cells to produce red blood cells. Bone marrow infiltration by cancer can lead to bone deterioration, hypercalcemia, hypoxia, and high blood pressure. In the current study of patients with bone metastases, anemia would be suggested by a symptom cluster involving fatigue, dyspnea, and possibly trouble sleeping, and aggravated by high blood pressure.
Hypotheses
There are several implications for the variables in the current study: 1) fever should be distinguished from fatigue/weakness in tests of symptom comorbidity; 2) fatigue/weakness, should be distinguished from closely related symptoms that may be causally linked (appetite loss, weight loss, trouble sleeping, shortness of breath/breathing problems); 3) psychological expression of malaise (depressive affect) should be viewed to constitute a common outcome for testing whether symptom effects are magnified beyond their individual impact when they occur in clusters; and 4) interactions between localized symptoms (pain, nausea/vomiting, and shortness of breath/breathing problems) and systemic symptoms (fever, fatigue/weakness, appetite loss, weight loss, trouble sleeping) should be tested to assess whether stronger relationships between depressive affect and localized symptoms occur in the context of specific systemic symptoms.
Significant interactions would support the view that interventions for the major symptoms of sickness behavior and cancer-specific complications may demonstrate crossover effects on each other either as a result of their natural similarities or through their shared effects as reflected by feelings of malaise (depressive affect). Several hypotheses are tested to explain the prediction of depressive affect.
Synergistic interactions of pain with fever, fatigue/weakness, appetite loss, weight loss, and trouble sleeping are hypothesized as separate pathways involving pain that predict depressive affect. Similar interactions are hypothesized when two variables (nausea/vomiting; shortness of breath/breathing problems) are each tested in place of pain.
An anemia-related hypothesis is based on synergistic interactions of fatigue/weakness with dyspnea (i.e., shortness of breath/breathing problems) that predict depressive affect. We allow for this interaction to be qualified further by other fatigue-related symptoms such as trouble sleeping. Further, to test whether this anemia cluster occurs as part of the anorexia-cachexia syndrome, similar interactions are hypothesized when two variables (appetite loss, weight loss) are each tested in place of fatigue/weakness.
Finally, exploratory follow-up to all of these interactions predicting depressive affect will determine whether symptom clusters remain significant, and may be qualified further, after comorbid illness conditions, primary cancer site, or most recent site of palliative radiation are taken into account.
Methods
Participants and Survey Design
Hospital staff from five area hospitals referred 575 eligible patients. Patients were eligible if they were at least age 30, resided at home, were no longer receiving curative treatment, were not terminally ill, and had recently initiated home-based palliative care and outpatient palliative radiation to relieve painful bone metastases. A sample of 268 eligible participants agreed to be interviewed at home by a trained interviewer on three occasions at three-month intervals. The current study used symptom data from the first wave. Patients reported each physical symptom during the interview. Health care team professionals and patient medical records provided medical information, such as cancer site, type of curative treatment, comorbid medical conditions, and anatomic site of the most recent palliative radiation.
The rationale for exclusion of patients considered terminally ill should be explained. Patients with terminal illness contend with severe functional impairments, such as more progressed stages of the anorexia-cachexia syndrome, that are likely to complicate side effects and limit treatment adherence to a series of outpatient visits for palliative radiation. Pronounced limitations in mobility and severe fatigue/weakness make it infeasible to travel for a series of outpatient visits for palliative radiation. Terminal illness requires greater reliance on palliative care that can be delivered exclusively in the home setting, including more extensive use of pain medications.
The exclusion of patients with terminal illness results in a more targeted sample in which participants are at similar phases of disease progression, characterized by a recent transition away from an aggressive curative phase of treatment to one that emphasizes palliative care for managing cancer as a chronic condition in patients not considered to be dying. This means that the sample of patients’ symptom experiences is not confounded by those of patients with terminal illness, which may differ qualitatively and quantitatively. For instance, although the sample revealed a range of symptom control for appetite problems and weight loss, it is unclear when the syndrome of anorexia-cachexia is likely to manifest. Also, the qualitative dimensions of this syndrome could differ in the early phase of palliative radiation compared to advanced terminal illness.
Some of the non-participants reported one or more explanations for their refusal; poor health (30.9%) and time limitations (28.7%) were cited most frequently. Sex differences did not distinguish these two explanations. The prevalence of poor health as an explanation for non-participation suggests that malaise could be more prevalent and more serious in the population and that the consistency of the study findings may be conservative and consistent estimates of these symptom interactions within the population. This is suggested further because several indicators of physical health and the depression inventory reflect that more serious symptoms at the first wave (P < 0.001) were incurred among the 107 patients lost to attrition during the eight months between waves 1 and 3.52
Measurement
Independent Variables
The independent variables representing physical symptoms are self-reported single items, measured on a Likert scale, on the degree of difficulty in controlling each physical symptom over the past month. The specific physical symptoms were chosen because they: 1) comprise several of the most important symptoms across cancer sites that physicians and nurses rated should be highest priority for treatment;53 or 2) were strongly implicated by the paradigm of sickness behavior in cancer (e.g., fever).54 Dummy variables representing each comorbid physical condition were also specified as predictors. Later, in follow-up runs to each regression, other dummy variables were used to test the exclusion of each site of primary cancer or each site of palliative radiation that was last received.
Symptom Control
Different lines of evidence converge to suggest that single-item, five-category measures for symptom control have adequate reliability and validity. In addition, psychometric properties of the dimension of symptom control suggest that a single-item symptom indicator would capture this dimension better than other symptom dimensions, such as relief, severity, frequency, or distress.
Evidence on psychometric properties of symptom dimensions
A first line of evidence results from comparisons across twenty clinical trials involving the opioid agonist–antagonist dezocine against standard opioid analgesics and placebo. A five-category single-item ordinal pain relief scale most consistently showed the highest sensitivity to change, compared with a four-category single-item ordinal pain intensity scale and a pain intensity visual analogue scale.55 The greater sensitivity of the five-category pain relief scale was attributed to the more precise classifications that can be made at low levels of pain relief. The five-category ordinal symptom items in the current study also appear to share this characteristic.
Note that sensitivity to change is a type of validity that can only result when a measure has sufficient reliability; however, Max56 points out that the passage of time may interfere with patient recall of the initial baseline level of pain, calling into question the validity of relief scales on other grounds. Therefore, measures of pain and symptom control are preferable to measures of pain and symptom relief because the reference point for control is not an earlier baseline period (i.e., relief relative to a point in time) but an absolute standard (i.e., relief compared to the absence of the symptom). This is important in the current study, in which patients typically receive repeated doses of analgesics, opioids, and palliative treatments over a relatively long course, which may well impede the capacity to recall the initial baseline level of each symptom.
Moreover, the extent of relief from a severe symptom does not necessarily mean a high degree of control has been reached, only that the symptom now causes less distress. Thus, relief is much more closely tied to the more subjective and highly individualized notion of distress than to the more objective notion of control, which is more directly related to symptom frequency and severity. Assessment of symptom clusters and comorbidity to predict depressive affect in a clinical sample should be based on symptom control instead of the more subjective and variable notions of distress and relief, which are likely to be confounded with the regression outcome of depressive affect.
In a study of the symptom burden of hospitalized patients, measures of symptom control for pain, dyspnea, anxiety, depression, and nausea were derived from separate, four-category ordinal items for symptom frequency (“Not at all” to “All of the time”) and symptom severity (“Not at all severe” to “Extremely severe”).57 Low symptom control was defined to occur when a symptom was moderately severe during at least half the time, or when a symptom was extremely severe at any frequency.
Evidence from patient–nurse paired comparisons
A second line of evidence derives from paired comparisons between the separate responses of each patient and their nurse (n = 174) to two ordinal items regarding the patient’s control of pain and control of other symptoms. Each item reflected moderate levels of agreement and correlation (54% agreement for pain, kappa = 0.549; 46% agreement for other symptoms, kappa = 0.491).58 These findings were obtained using a four-category ordinal scale for each item, and in light of the findings by Max,56 there is reason to believe that a less crude, five-category ordinal scale would have been more sensitive to change, potentially yielding higher levels of agreement and correlation.
Evidence on psychometric properties of single-item measures
A third line of evidence suggests that even for symptoms considered to be multidimensional, such as fatigue, single-item measures can perform surprisingly well compared to scales involving multiple items.59,60
A five-category ordinal item for “distress from lack of energy” performed as well as the Brief Fatigue Inventory (BFI) and the Functional Assessment of Cancer Therapy-Fatigue Subscale (FACT-F) in predicting several quality-of-life constructs and clinical factors. Because all three fatigue measures demonstrated concurrent validity with each other, and the BFI and FACT-F showed high internal reliability (Cronbach alphas, 0.94–0.95), the single-item for “distress from lack of energy” can also be deduced to have good internal reliability.59
In a second study that used the 47-item Functional Assessment of Cancer Therapy-Anemia (FACT-An) as a gold-standard measure for fatigue, the four-category ordinal fatigue item (“I get tired for no reason”) from the Zung Self-Rating Depression Scale was highly correlated with the FACT-An, and when the cutoff point for fatigue was set at the third ordinal category, sensitivity was 78.95% and specificity was 87.88%.60
Finally, in other research regarding appetite change, five-category scales are believed to yield the most precise measures, although psychometric evidence for their accuracy and validity has not yet been presented.61
Comorbid Conditions and Specific Sites of Primary Cancer and Palliative Radiation
Dummy variables for five comorbid illness conditions were included in extensions to the regression models. These items represent all of the illness conditions reported by at least eleven participants. In addition, only three illness clusters across these conditions involved at least twelve participants, and these clusters were also specified (i.e., Arthritis × Diabetes, Arthritis × Hypertension, and Diabetes × Hypertension; see Table 1).
Table 1.
Sample Characteristics, n = 268
| Characteristic | Frequency | Percentage |
|---|---|---|
| Age distribution | ||
| 30–39 | 7 | 2.6 |
| 40–49 | 31 | 11.6 |
| 50–59 | 54 | 20.1 |
| 60–69 | 94 | 35.1 |
| 70–79 | 71 | 26.5 |
| 80–89 | 11 | 4.1 |
| Primary cancer sites | ||
| Breast | 58 | 21.6 |
| Colorectal | 13 | 4.9 |
| Gynecologic | 26 | 9.7 |
| Head and neck | 37 | 13.8 |
| Lung | 54 | 20.2 |
| Prostate | 24 | 9.0 |
| Other | 56 | 20.9 |
| Primary treatment | ||
| Surgery | 164 | 61.2 |
| Curative radiation | 83 | 31.0 |
| Surgery and curative radiation | 54 | 20.1 |
| Comorbid conditions | ||
| Arthritis | 73 | 26.0 |
| Asthma | 6 | 2.1 |
| Diabetes | 26 | 9.3 |
| Emphysema | 11 | 3.9 |
| Heart disease | 16 | 5.7 |
| Hypertension | 68 | 24.2 |
| Arthritis and diabetes | 12 | 4.3 |
| Arthritis and heart disease | 6 | 2.1 |
| Arthritis and hypertension | 25 | 8.9 |
| Arthritis, diabetes, and hypertension | 7 | 2.5 |
| Diabetes and hypertension | 12 | 4.3 |
Prior research supports the restricted range in types of comorbid clusters in the current study. In contrast to other chronic illnesses, the prevalence of comorbid conditions in cancer did not differ when patients over age 70 were compared with younger patients, and was considerably lower among the older group compared to other patients over 70 who did not have cancer.62
In separate runs, each of these eight illness conditions and illness clusters were tested as moderators with each of the symptoms and symptom clusters.
The extended regression models in which illness conditions and illness clusters were found to be significant moderators were used to conduct two sets of follow-up regressions.
These sets of follow-up regressions were run to assess whether the relationship of symptoms to depressive affect is disproportionately influenced by specific sites of primary cancer or bone metastasis subjected to palliative radiation. Deterioration in prediction by the symptom cluster was assessed, in each run of the first set of follow-up regressions, when participants with the same type of primary cancer were excluded, and in each run of the second series of follow-up regressions, when participants reporting the same last site of palliative radiation were excluded.
Dependent Variable
The dependent variable is an index of depressive affect, comprising eleven items from the Center for Epidemiologic Studies-Depression (CES-D) Scale measured on a four-category ordinal scale that reflects frequency over the past week. Five self-report items regarding the frequency of negative affect (i.e., sad, blue, crying, depressed, lonely), three items of negative affect within interpersonal and situational contexts (i.e., bothered, fearful, failure) and three reverse-coded items of positive affect (i.e., hopeful, happy, enjoyed life) were selected from the CES-D depression inventory and summed to create the index of depressive affect.
CES-D items excluded from the index of depressive affect are: 1) several somatic items that would confound tests of physical symptom clusters; 2) two items that assess perceptions about the interpersonal behavior of other people (and not one’s own affect); and 3) an item about feeling worthless, which was endorsed by few respondents. The current study did not use the entire CES-D as a measure of depressive symptoms to prevent confounding because the somatic symptoms, such as low appetite, sleeping difficulties, and feeling tired, are also physical symptoms of cancer. Furthermore, depressive affect would serve as a better psychological indicator of the malaise in sickness behavior experienced by patients with few somatic symptoms of depression (but with other somatic illness symptoms). As such, depressive affect is a shared outcome of SB across patients and physical symptoms.
The validity of the resulting measure of depressive affect is supported by the use of items reflecting positive and negative affect similar to those from two other validated depression scales and by consistent psychometric properties for the first-order factors for positive and negative affect within the CES-D.
First, like the current study, a similar strategy was adopted in which several items reflecting negative and positive affect from the Profile of Mood States (POMS) were summed to reflect “depressed mood” in related work involving the multiple sites in the Study to Understand Prognoses and Preferences for Outcomes and Risks of Treatments (SUPPORT) and the Hospitalized Elderly Longitudinal Project (HELP). Concurrent and predictive validity were demonstrated with other symptoms and patient survival.57,63,64
Second, the entire depression subscale of the Brief Symptom Inventory (BSI), a common measure in cancer research,65 is composed entirely of positive and negative affect items similar to those from the CES-D. It has good psychometric properties with norm-based sub-scale scores for the general population66 and in cancer patients.67 Recently, the depression subscale of the BSI was shown to be sensitive to improvements in anemia-related fatigue among patients with lung cancer.68
Finally, our focus on depressive affect is supported by findings, replicated across multiple studies, that the four first-order factors from the CES-D (i.e., negative affect, positive affect, interpersonal relations, somatic symptoms) remain fairly consistent across the adult age range.69–72
In the current study, the internal consistency for the eleven items of depressive affect is very good (alpha = 0.83) and quite close to the internal consistency based on the entire twenty-item CES-D (alpha = 0.85). The highly similar levels of consistency in the current sample may stem from the dominant presence of rapid physiological processes suggested by the highly prevalent, comorbid physical symptoms that predict depressive affect. In other contexts, depressive affect may be conditioned in less reliable ways by a greater preponderance of psychosocial factors, demonstrating, as a result, significantly lower consistency compared to the entire CES-D.
The similar internal consistencies in the current study for depressive affect and the entire CES-D also suggest that other psychometric properties may be similar. The entire CES-D revealed similar consistency across psychometric properties in a study comparing 117 women with breast cancer and 62 women with no history of cancer.73 In both groups, the entire CES-D demonstrated good internal consistency and test-retest reliability, as well as construct validity with the Profile of Mood State-Fatigue Scale (POMS-F) and the State-Trait Anxiety Inventory (STAI-S).
Statistical Analysis
Statistical and analytical issues that complicate the interpretation of statistically significant interactions pose a key disincentive for research on symptom clusters. Significant interactions in multiple regressions that involve ordinal or continuous variables, such as the physical symptoms in Table 2, are not directly interpretable (in contrast to dummy variables within ANOVA). Rather, multiple follow-up re-estimates of the regression across multiple values of the component variables that comprise the interaction are required in order to estimate a series of simple slopes, which are ultimately plotted. Interpretations of the interaction are based on this graph.
Table 2.
Extent of Symptom Control, n = 268
| Symptom | Complete n (%) | A Lot n (%) | Some n (%) | Little n (%) | None n (%) |
|---|---|---|---|---|---|
| Change in bowel habits | 158 (58.9) | 48 (17.9) | 19 (7.1) | 8 (3.0) | 35 (13.1) |
| Fatigue/weakness | 77 (28.7) | 79 (29.5) | 35 (13.1) | 23 (8.6) | 54 (20.1) |
| Fever | 240 (89.5) | 13 (4.9) | 1 (0.4) | 3 (1.1) | 11 (4.1) |
| Nausea/vomiting | 179 (66.8) | 34 (12.7) | 14 (5.2) | 5 (1.9) | 36 (13.4) |
| Pain | 126 (47.0) | 55 (20.5) | 36 (13.4) | 10 (3.7) | 41 (15.3) |
| Poor appetite | 148 (55.2) | 19 (7.1) | 36 (13.4) | 18 (6.7) | 47 (17.5) |
| Shortness of breath/difficulty breathing | 191 (71.3) | 33 (12.3) | 12 (4.5) | 4 (1.5) | 28 (10.4) |
| Sleep problems | 155 (57.8) | 23 (8.6) | 16 (6.0) | 17 (6.3) | 57 (21.3) |
| Weight loss | 157 (58.6) | 25 (9.3) | 15 (5.6) | 17 (6.3) | 54 (20.1) |
|
|
|||||
| Depressive affecta | 11 | 12–14 | 15–17 | 18–38 | |
|
|
|||||
| Possible range: 11–44 | 68 (25.5) | 79 (29.6) | 50 (18.7) | 70 (26.2) | |
Depressive affect is an index of eight items of negative affect and three items of positive affect (reverse-coded) from the CES-D depression inventory. These items are: bothered by things, couldn’t shake blues, depressed, felt like a failure, fearful, lonely, crying spells, sad, and reverse-coded values for hopeful, happy, and enjoyed life.
This more complex process involves potentially tedious programming to recast the regression at different values of the variables that comprise the statistically significant interaction and to generate a follow-up plot that reveals the form, or shape, of the interaction. The process is most demanding when interactions are based on ordinal or continuous variables (in contrast to dummy variables) or include more than two variables. In addition, curvilinear and moderator regression analysis tends to be complicated by other potential problems compared to the more traditional model of main-effects regression.74,75
As a result, hypotheses that can be cast as main-effects regressions without interactions appear to be favored, resulting in a major disincentive to test model specifications involving symptom clusters. The current study is novel in that it avoids this unfortunate trend in the over-application of main-effects models by employing curvilinear and moderator regression analysis, as well as follow-up simple slopes plots, to model cancer symptom clusters of individual symptom items. Follow-up extensions to these regressions afford additional insights into these plots. Additional predictors involve co-morbid illness conditions and illness clusters, as well as their interactions with symptoms and symptom clusters. In addition, each follow-up regression is subsequently rerun, each time excluding participants with the same site of primary cancer or palliative radiation last received, in order to determine if the original findings are strongly influenced by any of these specific sites.
The curvilinear and moderated regression analyses in Tables 3 and 4 were conducted using centered predictors to minimize potential problems due to multicolinearity. After specifying each first-order symptom, and prior to their interaction(s), curvilinear terms were specified for the components that comprise each interaction. This results in a more valid test of each interaction by preventing confounding due to unspecified curvilinearity.76 In models created specifically to test symptom clusters involving fever, curvilinear interactions involving a quadratic component for fever (i.e. fever2) were included to target the more extreme categories, given the skewed distribution for fever. Variance inflation factors were examined to assess whether multicolinearity across predictors was problematic, and influential multivariate outliers were screened using Cook’s D statistic.
Table 3.
Depressive Affect Predicted by Symptom Clusters Involving Paina
| Pain with Fever, Fatigue, Sleep b (S.E.)
|
Pain with Appetite, Weight Loss b (S.E.)
|
|||||
|---|---|---|---|---|---|---|
| Independent Variablesb,c,d,e | 1f | 2 | 3 | 4 | 5 | 6 |
| Pain | −0.484 (0.464) | 0.463 (0.324) | 0.354 (0.346) | 0.729 (0.410) | 0.591 (0.413) | 0.448 (0.416) |
| Breath | −0.133 (0.243) | −0.085 (0.232) | −0.110 (0.244) | −1.457 (0.620)* | −1.404 (0.618)* | −1.487 (0.616)* |
| Sleep | 0.814 (0.460) | 0.504 (0.188)** | 0.004 (0.360) | 0.236 (0.362) | 0.101 (0.363) | 0.081 (0.363) |
| Nausea | 0.787 (0.229)**** | 0.489 (0.217)* | 0.650 (0.227)*** | |||
| Fever | 31.368 (1.641) | −0.139 (0.339) | 0.089 (0.424) | 1.803 (2.325) | 1.011 (2.324) | 0.743 (2.321) |
| Appetite | 1.373 (0.697)* | 1.628 (0.720)* | ||||
| Weight loss | 0.840 (0.772) | −1.252 (0.806) | −1.265 (0.807) | |||
| Fatigue | 0.224 (0.232) | 0.241 (0.253) | 0.269 (0.264) | 0.168 (0.248) | 0.147 (0.278) | |
| Pain2 | 0.153 (0.187) | 0.187 (0.182) | 0.259 (0.200) | 0.257 (0.195) | 0.286 (0.202) | 0.332 (0.205) |
| Breath2 | 0.597 (0.243)* | 0.538 (0.243)* | 0.568 (0.243)* | |||
| Sleep2 | 0.294 (0.223) | 0.397 (0.228) | 0.349 (0.232) | 0.372 (0.231) | 0.360 (0.232) | |
| fever2 | 0.437 (0.518) | 0.027 (0.458) | 0.320 (0.463) | −0.172 (0.463) | −0.119 (0.462) | |
| Appetite2 | −0.274 (0.208) | −0.363 (0.215) | ||||
| Weight loss2 | 0.352 (0.220) | 0.396 (0.232) | 0.401 (0.232) | |||
| Fatigue2 | 0.226 (0.173) | 0.112 (0.183) | 0.107 (0.193) | |||
| Pain × Sleep | −0.142 (0.128) | 0.227 (0.127) | −0.227 (0.128) | −0.199 (0.128) | ||
| Pain × Fever | −3.616 (1.301)*** | −0.196 (0.253) | 0.090 (0.254) | −0.123 (0.253) | −0.104 (0.252) | |
| Pain × Appetite | 0.052 (0.153) | 0.163 (0.162) | ||||
| Pain × Weight loss | −0.263 (0.120)* | −0.284 (0.138)* | −0.224 (0.140) | |||
| Pain × Fatigue | −0.310 (0.126)* | −0.289 (0.135)* | −0.333 (0.153)* | |||
| Sleep × Fever | 2.663 (1.092)* | |||||
| Pain × Fever2 | 1.009 (0.378)** | |||||
| Sleep × Fever2 | −0.846 (0.323)** | |||||
| Pain with Weight Loss and Comorbid Conditions | ||||||
|
| ||||||
| Independent Variablesb,c | 7g b (S.E.) | Independent Variablesb,c | 7g b (S.E.) | |||
|
| ||||||
| Diabetes | 1.542 (1.758) | Emphysema × Pain | −1.773 (2.287) | |||
| HTN | 0.615 (1.044) | Arthritis × Pain | −0.687 (0.710) | |||
| Heart disease | −1.787 (1.684) | HTN × Diabetes × Pain | −1.193 (1.999) | |||
| Emphysema | −2.253 (2.227) | Arthritis × Diabetes × Pain | −2.896 (1.929) | |||
| Arthritis | −1.209 (1.030) | Arthritis × HTN × Pain | −0.441 (1.216) | |||
| HTN 3 Diabetes | −2.784 (2.617) | Diabetes × Weight loss | −5.152 (3.709) | |||
| Arthritis 3 Diabetes | 0.550 (2.723) | HTN × Weight loss | −1.001 (0.549) | |||
| Arthritis 3 HTN | −0.089 (1.825) | Heart disease × Weight loss | 0.094 (0.725) | |||
| Pain | 0.879 (0.456) | Emphysema × Weight loss | 0.482 (1.889) | |||
| Breath | −1.026 (0.713) | Arthritis × Weight loss | −0.011 (0.548) | |||
| Sleep | 0.190 (0.384) | HTN × Diabetes × Weight loss | 3.570 (3.283) | |||
| Nausea | −0.152 (1.072) | Arthritis × Diabetes × Weight loss | 3.642 (3.948) | |||
| Fever | 0.324 (2.603) | Arthritis × HTN × Weight loss | 0.762 (0.950) | |||
| Weight loss | −0.604 (0.829) | Pain × Weight loss | −0.375 (0.181)* | |||
| Pain2 | 0.078 (0.205) | Diabetes × Pain × Weight loss | 1.793 (2.060) | |||
| Breath2 | 0.449 (0.281) | HTN × Pain × Weight loss | 0.113 (0.409) | |||
| Sleep2 | 0.243 (0.243) | Heart disease × Pain × Weight loss | −0.478 (0.840) | |||
| Nausea2 | 0.214 (0.258) | Emphysema × Pain × Weight loss | −0.112 (0.981) | |||
| fever2 | −0.093 (0.499) | Arthritis × Pain × Weight loss | 0.588 (0.329) | |||
| Weight loss2 | 0.275 (0.235) | HTN × Diabetes × Pain × Weight loss | −0.454 (1.478) | |||
| Diabetes × Pain | 2.723 (1.301)* | Arthritis × Diabetes × Pain × Weight loss | −1.809 (2.032) | |||
| HTN × Pain | 0.348 (0.768) | Arthritis × HTN × Pain × Weight loss | −0.360 (0.624) | |||
| Heart Disease × Pain | 0.427 (1.280) | |||||
n = 268.
P < 0.05.
P < 0.01.
P < 0.005.
P < 0.001.
Tests interaction effects between Pain and fever2; R2 = 0.200, F = 4.872 (P < 0.001).
Tests interaction effects between Pain and Fatigue; R2 = 0.188, F = 6.584 (P < 0.001).
Tests interaction effects between Pain and Fatigue, controlling for interaction effects between Pain and Sleep and between Pain and Fever, R2 = 0.194, F = 5.095 (P < 0.001).
Tests interaction effects between Pain and Weight Loss, controlling for interaction between Pain and Sleep and between Pain and Fever; R2 = 0.185, F = 4.405 (P < 0.001).
Tests interaction effects between Pain and Weight Loss, controlling for interaction effects between Pain and Sleep, between Pain and Fever, and between Pain and Appetite; R2 = 0.211, F = 3.679 (P < 0.001).
Tests interaction effects between Pain and Fatigue, controlling for interaction effects between Pain and Sleep, between Pain and Fever, between Pain and Appetite, and between Pain and Weight Loss; R2 = 0.226, F = 3.786 (P < 0.001).
Tests interaction effects between Pain and Weight Loss, controlling for interaction effects between Pain, Weight Loss, and all eight comorbid conditions; R2 = 0.285, F = 1.955 (P < 0.001).
Depressive affect is an index of eight items of negative affect and three items of positive affect (reverse-coded) from the CES-D depression inventory.
All first-order components are centered. Note: Breath refers to variable “Shortness of Breath/Difficulty Breathing.” Nausea refers to variable “Nausea/Vomiting.” Fatigue refers to variable “Fatigue/Weakness.” Sleep refers to variable “Trouble Sleeping.” Appetite refers to variable “Appetite Problems.”
Optimal internal validity for estimates of interaction effects result from the simultaneous specification of potentially overlapping curvilinear terms that may potentially overlap interactions.
Parameters remain unchanged in direction and statistical significance when 1–3 are run without Nausea, and when 5 is run without Fatigue.
Initially, Nausea was not included in 4–6 due to its strong role in mediating Appetite. When included, it resulted in slight deterioration to non-significance in the parameter for Pain × Weight Loss (P = 0.063 in 4; P = 0.077 in 5) but not for Pain × Fatigue (P = 0.028 in 6). However, when 4 was extended by adding Nausea, all eight comorbid conditions, and their combined interactions with Pain, with Weight Loss, and with Pain × Weight Loss, the negative parameter for Pain × Weight Loss was significant (P = 0.039) and, moreover, was not moderated further by any of the comorbid conditions. In follow-up runs across primary cancer sites, observations reporting a given primary cancer site were deleted to assess the influence of that site on overall parameter significance. Similar follow-up runs were based on palliative radiation sites. In both cases, the level of deterioration in parameter significance was never dramatic.
In extensions to 1 that specified Nausea × fever2 and its lower-order derivative terms, all fever-based interactions involving Pain, Sleep, or Nausea were non-significant.
In 7, each primary cancer site was excluded in a separate follow-up run. Results changed dramatically only when lung cancer was excluded (i.e., the P value for Pain × Weight Loss deteriorated from 0.039 to 0.168; the sign of the b parameters remained negative). Similarly, each prior palliative radiation site was excluded from a run in a parallel series of follow-up regressions, but results did not change dramatically for any site.
Note: The bolded entries reveal statistically significant physical symptom clusters.
Table 4.
Depressive Affect Predicted by Symptom Clusters Involving Nausea or Breathinga
| Nausea with Fever, Fatigue b (S.E.)
|
Breath with Fatigue, Sleep b (S.E.)
|
Breath with Appetite, Weight Loss, Sleep b (S.E.)
|
||||
|---|---|---|---|---|---|---|
| Independent Variablesb,c | 1 | 2 | 3 | 4 | 5d Comorbid HTN | 6 |
| HTN | −0.017 (0.760) | |||||
| Pain | 0.612 (0.229)** | 0.622 (0.229)** | 0.600 (0.230)** | 0.370 (0.340) | 0.363 (0.341) | 0.350 (0.345) |
| Breath | −0.236 (0.248) | −0.233 (0.248) | −0.224 (0.251) | −1.084 (0.599) | −1.364 (0.654)* | −0.894 (0.619) |
| Sleep | 0.246 (0.410) | 0.450 (0.196)* | 0.441 (0.197)* | 0.078 (0.356) | 0.218 (0.382) | 0.061 (0.386) |
| Nausea | −0.592 (0.580) | −0.705 (0.573) | −0.614 (0.581) | 0.000 (0.543) | ||
| Fever | 1.196 (1.748) | 1.545 (1.541) | 1.535 (1.546) | 0.491 (1.395) | 1.239 (2.260) | 0.765 (2.277) |
| Appetite | 1.425 (0.718)* | |||||
| Weight loss | −1.189 (0.812) | |||||
| Fatigue | 0.367 (0.229) | 0.411 (0.228) | 0.262 (0.274) | 0.107 (0.261) | 0.544 (0.293) | 0.038 (0.284) |
| Pain2 | 0.046 (0.189) | 0.072 (0.189) | 0.082 (0.190) | |||
| Breath2 | 0.518 (0.247)* | 0.568 (0.254)* | 0.501 (0.247)* | |||
| Sleep2 | 0.317 (0.220) | 0.376 (0.224) | 0.420 (0.226) | 0.301 (0.229) | ||
| Nausea2 | 0.401 (0.231) | 0.460 (0.227)* | 0.485 (0.232)* | 0.282 (0.232) | ||
| fever2 | −0.292 (0.532) | −0.494 (0.474) | −0.491 (0.476) | −0.239 (0.423) | −0.279 (0.431) | −0.213 (0.435) |
| Appetite2 | −0.306 (0.213) | |||||
| Weight loss2 | 0.397 (0.234) | |||||
| Fatigue2 | 0.169 (0.184) | 0.259 (0.183) | 0.155 (0.189) | 0.126 (0.189) | ||
| Fever × Sleep | 0.652 (0.873) | |||||
| Nausea × Fever | −2.161 (0.860)* | −2.151 (0.857)* | −2.086 (0.861)* | |||
| HTN × Fatigue | −0.533 (0.531) | |||||
| HTN × Breath | 0.578 (0.637) | |||||
| HTN × Sleep | −0.555 (0.483) | |||||
| Breath × Sleep | −0.531 (0.166)*** | −0.432 (0.191)* | −0.568 (0.222)* | |||
| Breath × Appetite | −0.023 (0.212) | |||||
| Breath × Weight loss | −0.188 (0.197) | |||||
| Breath × Fatigue | −0.329 (0.163)* | −0.033 (0.202) | ||||
| Sleep × Appetite | 0.169 (0.134) | |||||
| Sleep × Weight loss | −0.106 (0.123) | |||||
| Sleep × Fatigue | −0.209 (0.122) | −0.318 (0.141)* | ||||
| Nausea × Fatigue | −0.127 (0.175) | |||||
| Sleep × fever2 | −0.278 (0.262) | |||||
| Nausea × Fever2 | 0.579 (0.251)* | 0.555 (0.249)* | 0.539 (0.251)* | |||
| Breath × Appetite × Sleep | 0.230 (0.106)* | |||||
| Breath × Weight loss × Sleep | −0.131 (0.097) | |||||
| Breath × Fatigue × Sleep | 0.249 (0.087)*** | 0.075 (0.107) | ||||
| HTN × Breath × Sleep | −0.310 (0.437) | |||||
| HTN × Fatigue × Breath | −0.395 (0.351) | |||||
| HTN × Fatigue × Sleep | 0.216 (0.290) | |||||
| HTN × Fatigue × Breath × Sleep | 0.439 (0.214)* | |||||
n = 268.
P < 0.05.
P < 0.01.
P < 0.005.
Tests interaction effects between nausea and fever2, controlling for interaction between sleep and fever2; R2 = 0.202, F = 4.935 (P < 0.001).
Tests interaction effects between nausea and fever2; R2 = 0.188, F = 5.918 (P < 0.001).
Tests interaction effects between nausea and fever2, controlling for interaction effects between nausea and fatigue; R2 = 0.191, F = 5.002 (P < 0.001).
Tests interaction effects between breath, sleep, and fatigue; R2 = 0.243, F = 5.003 (P < 0.001).
Tests interaction effects between HTN, breath, sleep, and fatigue; R2 = 0.248, F = 3.654 (P < 0.001).
Tests interaction effects between breath, sleep, and appetite, and between breath, sleep, and weight loss; R2 = 0.239, F = 3.661 (P < 0.001).
Depressive affect is an index of eight items of negative affect and three items of positive affect (reverse-coded) from the CES-D depression inventory.
All first-order components are centered. Note: Breath refers to variable “Shortness of Breath/Difficulty Breathing.” Nausea refers to variable “Nausea/vomiting.” Fatigue refers to variable “Fatigue/Weakness.” Sleep refers to variable “Trouble Sleeping.” Appetite refers to variable “Appetite Problems.”
Optimal internal validity for estimates of interaction effects result from the simultaneous specification of curvilinear terms that may potentially overlap the interactions.
Separate follow-up regressions tested whether 5 is further qualified by each comorbid illness condition. Hypertension was the only comorbid condition found to do so. Results did not change dramatically when each primary cancer site was excluded from a separate run. Each prior palliative radiation site was excluded from a run in a parallel series of follow-up regressions. Of these, the increase in the P-value for the interaction involving hypertension, fatigue, breath, and sleep was dramatic only when the hip/pelvis site of palliative radiation was excluded (i.e., P increased from 0.042 to 0.406).
Note: The bolded entries reveal statistically significant physical symptom clusters.
The reported follow-up regression involving the dummy variable for hypertension (see 5, Table 4) did not violate the homogeneous error variance assumption for categorical moderators.77 This assumption was tested using a weighted least squares (WLS) regression that weighted participants based on the presence or absence of hypertension, with weights derived from ordinary least squares (OLS) regressions conducted separately on these two subgroups.
All statistical analyses were performed using SPSS for Windows version 11.5 (SPSS Inc., Chicago, IL).
Results
Sample Description
There was a virtually equal representation by sex. The sample was 90.7% white, 9.3% black, and the mean age (± SD) was 62.7 ± 11.0 years. Table 1 summarizes age and medical characteristics at baseline. In addition to primary treatment with surgery, curative radiation, or both, one third of the sample (81 patients) were receiving chemotherapy at the start of palliative radiation.
Responses for physical symptoms and depressive affect, shown in Table 2, were distributed across the five scale categories. Unlike the other symptoms, the distribution for fever was highly skewed, with only 10.5% of the sample (twenty-eight participants) reporting problems controlling fever. Slightly more than half of the patients reporting shortness of breath/difficulty breathing (41 out of 77) also reported trouble sleeping. Compared to patients with other primary cancer diagnoses, those with lung cancer reported greater difficulty with shortness of breath/difficulty breathing [χ2(df = 4) = 30.941, P < 0.001] but not fatigue/weakness or trouble sleeping.
Explanatory Findings
Regression results are shown in Tables 3 and 4. The reader is cautioned that the specific form of each interaction effect is not apparent from the sign of the regression parameter of the interaction term but requires inspection of a follow-up simple slopes plot of the interaction at different levels of its component terms.74,75 The reason is that the interaction effect is made up of the highest-order interaction term and all derivative terms for lower-order interactions and first-order predictors. The simple slopes plots in Figures 1–3 reveal remarkably consistent relationships of fever and fatigue with pain and other symptoms.
Fig. 1.
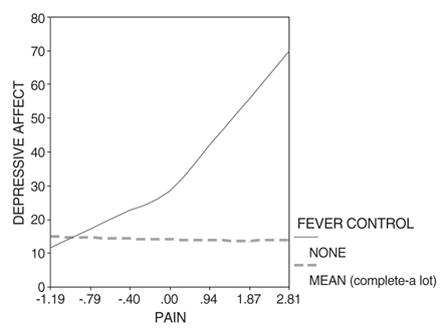
Depressive affect predicted by pain and fever2, controlling for the interaction of trouble sleeping with fever2.
Fig. 3.
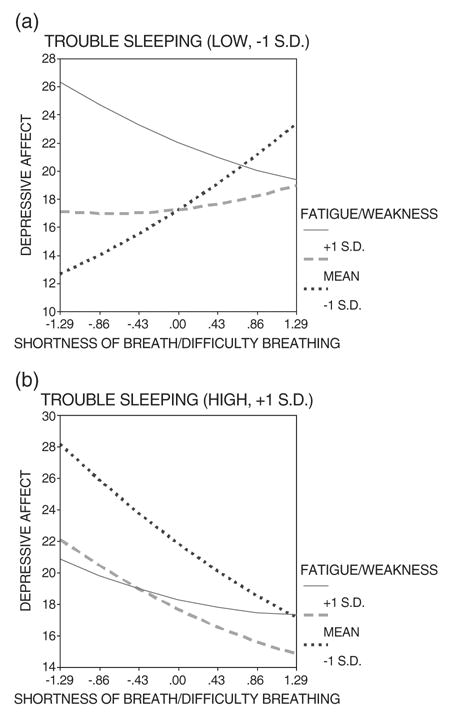
Depressive affect predicted by shortness of breath/difficulty breathing and fatigue/weakness when trouble sleeping is (a) low versus (b) high.
Symptom Clusters Involving Fever
The curvilinear interaction between pain and fever2 (Table 3, regression 1) becomes highly significant (P < 0.01) only after controlling the curvilinear interaction between sleep and fever2, which is also highly significant (P < 0.01). This is a “suppressor effect.” The shared variation in both terms (r = 0.694) is “suppressed” to provide estimates of unique effects that can be attributed to each term.78
This means that those with low control over fever and comorbid pain are also more likely to have trouble sleeping when they report depressive affect. Limitations of the cross-sectional analyses do not allow us to determine whether trouble sleeping is a consequence of low fever control and pain, whether these symptoms are truly co-occurring, or both. Thus, this overlapping variation is factored out or “suppressed.” The follow-up simple slopes plot (Figure 1) for this regression (1 in Table 3) results in the following interpretation: After accounting for sleeping problems associated with fever, when fever control is low and pain increases, depressive affect increases dramatically.
Extending this fever-based model with co-morbid pain to include a similar interaction with nausea/vomiting results in statistical insignificance for both the pain- and nausea-based interactions (Table 3, footnote f). Thus, the effects of pain and nausea/vomiting overlap.
This is supported further since replacing pain with nausea/vomiting results in a similar model to the original pain model of regression 1, although without a suppressor effect requiring the specification of the curvilinear interaction between sleep and fever2 (Table 4, regressions 1 and 2). The regression models for pain (1, Table 3) and nausea/vomiting (1 and 2, Table 4) reveal similar parameters (in terms of magnitude and sign) for the respective interactions involving fever2 with pain or nausea/vomiting, as well as for all of the lower-order derivative terms of these interactions. It follows then that the simple slopes plot involving nausea/vomiting (not shown) is also similar to the simple slopes plot of Figure 1 involving pain.
Thus, depressive affect is heightened when nausea/vomiting is accompanied by a high level of fever.
Expansion of the model to include an interaction between nausea/vomiting and fatigue reveal it to be statistically insignificant, although the interaction between nausea/vomiting and fever2 remain significant (Table 4, regression 3).
Finally, when “changes in bowel habits” was tested in place of nausea/vomiting, the significant interaction with fever2 (P < 0.05) deteriorates somewhat to become statistically insignificant in regressions 1–3 (with P value ranging from 0.085 to 0.112. This consistent pattern suggests that the lack of statistical significance may result not from randomness but because the scope of the variable “changes in bowel habits” is too broad.
Symptom Clusters Involving Fatigue/Weakness
We now turn to significant interactions involving fatigue/weakness. Initially, only the interaction between pain and fatigue/weakness was specified, which is significant (Table 3, regression 2). Next, interactions between pain and sleep and between pain and fever were added (Table 3, regression 3). In regression 3, the interaction between pain and fatigue/weakness remains significant and relatively unchanged even as the interaction between pain and fever becomes significant.
The follow-up simple slopes plots for these two regressions (2 and 3 in Table 3) are shown in Figures 2a and 2b, which lead to the following interpretation: Depressive affect is heightened when pain is accompanied by a high level of fatigue/weakness, although as pain continues to increase, the rate of increase in depressive affect becomes less and less. Once a threshold of high unrelieved pain is reached, depressive affect is actually heightened more when fatigue/weakness is low. Thus, beyond this threshold of high pain, high levels of fatigue/weakness are actually associated with lower levels of depressive affect.
Fig. 2.
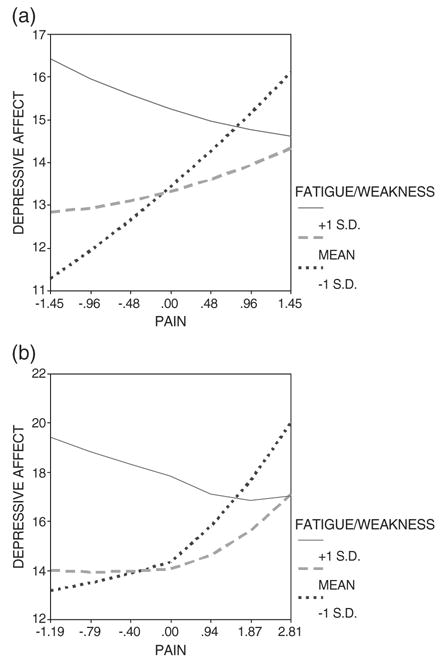
(a) Depressive affect predicted by pain and fatigue/weakness. (b) Depressive affect predicted by pain and fatigue/weakness, controlling for interactions of pain with trouble sleeping and of pain with fever.
When pain is substituted with two symptoms (shortness of breath/difficulty breathing and trouble sleeping), the estimated three-way interaction between fatigue/weakness, shortness of breath/difficulty breathing, and trouble sleeping is highly significant (Table 4, regression 4). It is probed using two follow-up simple slopes plots (Figures 3a and 3b). The first plot, characterized by low trouble sleeping, is very similar to the plots involving pain (Figures 2a and 2b).
Two symptoms that contribute to fatigue and weakness (appetite problems, weight loss) are specified either to accompany or replace fatigue/weakness. The interaction between pain and weight loss, initially significant (Table 3, regressions 4 and 5) becomes insignificant and appears to be explained by the significant interaction between pain and fatigue/weakness (Table 3, regression 6). The interaction between pain and appetite problems remains insignificant across these regressions. Appetite problems and weight loss replace fatigue/weakness within the estimated three-way interaction involving shortness of breath/difficulty breathing, and trouble sleeping (Table 4, regression 6); only the cluster involving appetite problems becomes significant.
Follow-Up Findings
Breast (21.6%) and lung (20.2%) diagnoses comprise 41.8% of all primary cancers. Compared to breast and lung cancer diagnoses, bone metastasis could be a stronger influence on patients’ experience of symptoms. Interms of previous site of palliative radiation, the breast (12.3%) and lung (17.2%) comprise less than a third of all sites of palliative radiation, whereas sites of the neck (8.6%), pelvis/hip (11.2%), prostate (4.5%), and spine/lumbar-low (4.1%) comprise between a fourth and a third of all sites. The remaining 42.1% were among thirty-five other sites across the body. These findings reveal evidence that more than two-thirds of the sites for palliative radiation do not involve the breast or lung, suggesting the importance of metastasis to other body areas.
Moreover, these findings do not address the importance of the primary illness diagnosis in influencing symptom expression, regardless of areas of bone metastasis. Even in more advanced stages of cancer, specific cancer treatments continue to be determined by the primary site of cancer.
Therefore, a parallel series of follow-up regressions were run to test whether the primary site of cancer or the previous site of palliative radiation provide the best explanation of the relationship between depressive affect and each symptom cluster, which could interact with any of the comorbid conditions. The symptom cluster involving fatigue/weakness, shortness of breath/difficulty, and trouble sleeping was found to interact with the comorbid condition of hypertension (Table 4, regression 5), whereas the symptom cluster involving pain and weight loss did not interact with any comorbid condition.
In the first series of these follow-up regressions, participants with the same primary cancer site were excluded in each run. In the symptom cluster involving pain and weight loss, results deteriorated dramatically only when lung cancer was excluded, suggesting the importance of lung cancer in this symptom cluster (see Table 3, footnote g).
In contrast, there was no evidence that the symptom cluster involving hypertension, fatigue/weakness, shortness of breath/difficulty breathing, and trouble sleeping occurred disproportionately in lung cancer, even when participants with comorbid lung conditions (asthma, emphysema) were excluded, or in any other primary cancer site. Finally, hypertension no longer co-moderated this symptom cluster when fatigue/weakness was replaced by appetite problems and weight loss (Table 4, regression 6).
A parallel series of follow-up regressions was also run, each time excluding participants reporting the same previous site of palliative radiation. There is no evidence that the symptom cluster involving pain and weight loss occurred disproportionately within any of the previous sites of palliative radiation. In the symptom cluster involving hypertension, fatigue/weakness, shortness of breath/difficulty breathing, and trouble sleeping, results deteriorated dramatically when the hip/pelvis site was excluded (Table 4, footnote d), suggesting the importance of treating bone metastases to the hip/pelvis in this symptom cluster.
Discussion
Sickness Behavior and Symptom Clusters
In the current sample of cancer patients initiating palliative radiation, the paradigm of sickness behavior and the malaise theory of depression appear to explain the roles of fever and fatigue/weakness in the exacerbation of malaise. The specification of multiple symptoms as first-order terms followed by interaction terms permits the detection of synergistic influences from symptom clusters. This is an important strength of the study, reducing the potential for confounding when overlapping yet distinct symptoms, such as fever and fatigue/weakness, are not modeled simultaneously. Moreover, in the prediction of depressive affect, the distinction of overlapping interactions help us to appreciate that reported associations between individual symptoms, such as between pain and nausea and between pain and dyspnea,3,63 may in part be due to clustering by these symptoms with other common symptoms. Specifically, overlapping interactions involving fever and pain were distinguished from those involving fever and nausea/vomiting, and overlapping interactions involving fatigue/weakness and pain were distinguished from those involving fatigue/weakness, dyspnea, and trouble sleeping.
The separate regressions that model fever clusters with pain or nausea/vomiting result in respective parameter estimates that are consistent in sign and magnitude and that would yield similar simple slopes plots (Figure 1 reveals the plot for fever and pain). Two additional follow-up simple slopes plots involving fatigue/weakness also remain highly consistent (Figures 2a and 3a), whether this is reflected by the influence of pain or, when trouble sleeping is not an additional complication, by the influence of dyspnea (i.e., shortness of breath/difficulty breathing). That is, sensitivity to pain and shortness of breath/difficulty breathing are heightened in contexts of high fatigue and weakness. Together, these results elaborate earlier findings from main-effect ordinal probit regressions that patients with nausea or dyspnea experienced higher levels of pain,63 by testing more flexible interaction-effect models that account for clustering among these symptoms.
Thus, the set of simple slopes plots reveals remarkably consistent, synergistic relationships involving fever or fatigue with pain and with other symptoms. These findings support the plausibility of SB as a common phenomenon, initially signaled by fever, in which the symptoms of malaise, fatigue and weakness, nausea and vomiting, pain, and difficulty breathing result simultaneously, in some close sequence, or both.
The interaction between pain and fatigue/weakness yields remains significant at P = 0.05, yielding a similar b coefficient, when fatigue/weakness is replaced by weight loss, suggesting that fatigue/weakness that accompanies pain may stem from weight loss. However, we cannot necessarily attribute such weight loss to the anorexia-cachexia syndrome, which was not confirmed by other findings. For instance, the interaction of pain and appetite loss was not also significant.
Even so, we cannot rule out the possibility that an early stage of the anorexia-cachexia syndrome may be occurring due to the finding that the highly significant three-way interaction (involving fatigue/weakness, shortness of breath/difficulty breathing, and trouble sleeping) remained statistically significant when appetite loss (but not weight loss) replaced fatigue/weakness. The non-significance of weight loss in this cluster of symptoms suggests that of the three different factors that contribute to the complexity of dyspnea,79 dyspnea that results in depressive affect or malaise cannot be attributed to the need for a greater proportion of respiratory muscle for breathing, which occurs during cachexia. However, dyspnea may result from an increase in respiratory effort to overcome an obstruction, such as a large pleural effusion common in metastasis, and from an increase in ventilatory requirement due to hypoxemia, anemia, and other factors. These causes of dyspnea could relate more closely to appetite problems and related issues, such as gastrointestinal problems, than to weight loss per se.
Therefore, factors such as pleural effusion, anemia, fatigue/weakness unrelated to anemia, and appetite-related issues could explain the highly significant interaction between fatigue/weakness, dyspnea, and trouble sleeping, whereas illness- and iatrogenic-related weight loss may be associated with heightened pain sensitivity.
Finally, follow-up regression analyses revealed patients’ experience of symptoms to be influenced by hypertension, types of cancer, as well as the presence of bone metastasis. However, the relationship of the second symptom cluster (fatigue/weakness, shortness of breath/difficulty breathing, trouble sleeping) to depressive affect is broader than the context of hypertension because it also includes patients who experience fatigue and weakness that can be attributed to appetite loss rather than hypertension (compare 5 and 6, Table 4).
There are various reasons why hypertension may interact with the second symptom cluster. Short-term use of acetaminophen and nonsteroidal anti-inflammatory drugs (NSAIDs) (except aspirin) was determined to induce hypertension.80–82 Hypoxia, which is common in meta-static cancer, contributes to hypertension, fatigue/weakness, and dyspnea. Hypercalcemia of malignancy, which is common in bone metastases, contributes to hypertension and anemia, whereas anemia contributes to fatigue/weakness and dyspnea. Anti-hypertensive medications, rather than uncontrolled hypertension, may exacerbate fatigue.83 Anxiety may be a feature of hypertension, hypoxia, hypercalcemia of malignancy, anemia, shortness of breath/difficulty breathing, and trouble sleeping. On the other hand, the significance of hypertension cannot be attributed to its traditional role as an indicator of atherosclerosis (progressive vascular disease) because comorbid effects from heart disease would have been significant as well.
The management of hypertension may be a critical factor in the consideration of treatments for symptom management. For instance, clinical perceptions that corticosteroid use tends to aggravate hypertension may provide some account for the widespread underemployment of corticosteroids to prevent delayed chemotherapy-induced nausea and emesis,84 despite that a short course of the corticosteroid dexamethasone should not aggravate hypertension that is already well controlled.85
In follow-up regressions to the first symptom cluster involving pain and weight loss, the involvement of lung cancer (Table 4, footnote g, reveals dramatic deterioration when lung cancer was excluded) suggests that the well-documented fatigue in lung cancer may be related to weight loss. (Recall the evidence of strong overlap between the cluster involving pain and weight loss and the cluster involving pain and fatigue; compare 5 and 6 in Table 3).
On the other hand, the non-involvement of the primary site of lung cancer in the second cluster (fatigue/weakness, shortness of breath/breathing difficulties, trouble sleeping) does not rule out dyspnea resulting from increased respiratory effort due to metastases involving the lung and surrounding area, such as pleural effusion.79 Moreover, the expression of dyspnea is likely to differ qualitatively in lung cancer, which could displace the expression of depression (malaise) with elevated anxiety and depression-anxiety.20,86–88 This is suggested by the descriptive findings that participants with lung cancer are more likely to report dyspnea.
Distinguishing Fever from Fatigue: A Further Rationale
In classic sickness behavior in response to infection, immune cells react to microorganisms by secreting blood-borne pyrogenic cytokine signals to the brain, which results in fever.89 In contrast to blood-borne routes for cytokine-to-brain communication, cytokines also appear to communicate with the brain by activating the peripheral vagus nerve, which is present in major sites of pathogen entry such as the lungs and lymph nodes.
Two important features of the vagal pathway suggest its importance regarding cytokine-brain communication during cancer. First, the vagal pathway is available even when cytokine levels in the bloodstream are low, such as during the early phase of an infection or perhaps as an immunological response to cancer-related inflammation in the absence of viral infection.90 Second, in contrast to the similarities between the vagal and blood-borne pathways in mediating several other symptoms, the vagal pathway does not appear to communicate a pyrogenic cytokine signal to the brain.91 Both of these factors could explain why many patients with cancer manifest only low-grade fever.19
Fever is one of several contributing factors to fatigue, including pain, medication, infection, anemia, and weight loss.19 The release of proinflammatory cytokines (interleukin-1α, interleukin-1β, interleukin-4, interleukin-6, and tumor necrosis factor-α) during infection or inflammation stimulates fever.92 These proinflammatory cytokines are also associated with the manifestation of other symptoms, including pain and fatigue. The separate choices to control, or not to control, fever may aggravate other symptoms, although through different mechanisms.
Subthreshold neutropenia occurs across many patients receiving chemotherapy, and physicians may choose not to control fever in these patients because it may be the only sign of infection and the onset of neutropenia.93 Thus, it is not always desirable to treat fever, but in these situations the presence of fever may aggravate pain and other symptoms, as suggested by the paradigm of sickness behavior.
Conversely, fever may be over-controlled in other patients also at risk for subthreshold neutropenia, as well as appropriately controlled in patients who are not at risk. The fever response can be suppressed by immunosuppressive agents, such as NSAIDs, although complete suppression typically does not occur in the presence of infection.50 The importance of the fever response should be noted, however. Increased body temperature from fever serves to weaken and kill invading pathogens. Over time, weakening or deactivation of this fever response could exacerbate inflammation, symptoms (such as increased pain), and re-infection even from low-grade infections.
Increased risk of hypertension, for instance, has been associated even with short-term use of acetaminophen and NSAIDs (except aspirin).80–82 In the current study, this phenomenon may explain why the comorbid condition of hypertension interacts with the second symptom cluster (fatigue/weakness, shortness of breath/difficulty breathing, trouble sleeping) in the follow-up regression predicting depressive affect.
These dual and offsetting mechanisms based on the degree of fever control might explain why the sample prevalence of fever was more moderate than the other symptoms. Although for some at-risk patients who had recently received curative chemotherapy, fever was deliberately under-controlled in order to detect the onset of neutropenia, the larger group of patients at lower risk may have been treated with non-specific NSAIDs (and today with COX-II inhibitors as a second approach). Thus, the manifestation of sickness behavior through the under-control of fever, and conversely through its relief, may each be explanatory mechanisms. Those with remaining fever symptoms would appear less likely to have over-controlled fever symptoms, and could differ from other patients in the pathways and patterns of symptom expression.
Therefore, the specification of fever and fever-based clusters is supported by the sickness behavior paradigm, the likelihood of dual and offsetting mechanisms based on the degree of fever control, and the prevention of confounding of fatigue and fatigue-based clusters. From a statistical perspective, the low levels of multi-colinearity among the centered symptom variables and their interactions signify that co-occurrences are not likely to be over-inflated by chance associations. Furthermore, proper specification and estimation of symptom clusters results from the modeling flexibility inherent in curvilinear and moderator regression. In contrast, the more parsimonious main-effects regression model would make it more subject to chance associations.
Potential for Crossover Interventions
The current study supports the potential not only for improvement in pain as a crossover impact of fatigue and depression interventions, as has been recently suggested, but also from interventions for fever, nausea and vomiting, constipation, shortness of breath/difficulty breathing, and weight loss. For instance, interventions for symptoms closely related to fever, such as more vigilant attention to fluids maintenance and hydration, or interventions for nausea/vomiting, such as anti-emetic agents, might also demonstrate crossover effects on pain, fatigue, or depressed affect.
Pain and fatigue/weakness are especially prevalent in this population. Crossover effects from interventions that reduce these two symptoms potentially could apply broadly across patients, although multiple mechanisms characterize both symptoms, which could also serve to limit the scope of specific crossover interventions. Even so, certain duplicated patterns of symptom clusters on depressive affect result when one symptom is tested in place of another, which provide some clues to inform the search for interventions with crossover impacts.
First, the striking similarity of the simple slopes plots involving fatigue/weakness with pain and, when sleep is not problematic, with shortness of breath/difficulty breathing, points to the possibility that interventions for pain or for dyspnea could simultaneously relieve the other symptom. For instance, crossover effects could result in treatment for anemia, a frequent side effect of cancer treatment, in which fatigue, weakness, shortness of breath, and chest pain are common symptoms.
Second, although the pain–depression relationship is found to be moderated by fatigue, it is found to be moderated to a similar degree by weight loss. These cross-sectional findings raise the issue whether depression may appear to increase sensitivity to pain because it is highly associated with a third variable, such as weight loss, which may be more closely associated with the primal cause of heightened pain sensitivity (and even of depression). For instance, although patients with metastatic cancer may experience weight loss, which may co-occur close to the onset of depression, it is plausible that weight loss, and not depression, may cause heightened sensitivity to pain. In advanced cancer patients receiving palliative radiation to relieve painful bone metastases, weight loss may be associated with bone loss, and the cluster involving pain and weight loss could reflect greater malaise as a result of localized sites of painful bone metastases compared to more generalized pain or other forms of weight loss (e.g., muscle deterioration, dehydration), although the cluster may also reflect systemic anemia-related blood loss as well.
Third, a tentative finding not reported in Table 4 calls attention to whether interventions for nausea or constipation might also relieve pain. When the variable “nausea/vomiting” is replaced with “changes in bowel habits,” the final interaction involving fever is preserved, despite that it deteriorates somewhat to become statistically insignificant (with P value ranging from 0.085 to 0.112). This deterioration could be due to the broad domain of this symptom category (e.g., constipation, diarrhea, bowel obstruction). Thus, future research should determine whether the more targeted symptom of constipation, which is the most common type of bowel problem in chemotherapy and radiation, is a significant predictor.
Other factors suggest this possibility. Nausea-constipation is a common symptom constellation within the cachexia-anorexia syndrome, a prevalent feature of advanced cancer.94 Moreover, constipation and associated pain result from spinal cord compression and are side effects of chemotherapy,95 opioid medications to relieve pain,96,97 and polypharmacy.98 Thus, it is plausible that interventions to relieve nausea-constipation could result in crossover effects that prevent or reduce gastrointestinal and abdominal pain, which may differ from pain at localized site(s) of cancer.
This possibility suggests alternative interpretations for our current findings. Although the separate interactions between fever and pain and between fever and nausea/vomiting overlap in the prediction of depressive affect, this does not necessarily suggest that fever aggravates nausea/vomiting directly. For instance, fever could be more strongly associated with pain sensitivity or certain kinds of pain, such as gastrointestinal or abdominal pain and constipation, which in turn could be associated with nausea/vomiting. Once again, the possibility for this indirect pathway is suggested by the consistent form of the interaction, despite not reaching significance at P < 0.05, when the broadly defined variable “changes in bowel habits” is substituted for “nausea/vomiting.”
Targeting Crossover Interventions to the Initial Phase of Palliative Radiation
Physicians appear more likely to refer patients for palliative radiation when they experience troublesome opioid side effects in order to reduce the level of analgesics. Analgesics continue to be necessary for non-irradiated sites, for new sites that become “unmasked” as the radiated site improves,99 during the 1- to 4-week delay until pain relief, and for the 20% of referred patients who do not derive pain relief despite palliative radiation.100,101 The fact that the initial pain-fatigue cluster (and the subsequent pain-weight loss cluster) remained significant when pain was replaced with nausea may be related to initial and continuing opioid levels that tend to displace the symptom of pain with nausea. Today, medications such as corticosteroids can either substitute for opioids or allow lower doses of opioids with fewer side effects.
Bone loss from metastases can lead to hypercalcemia of malignancy, which can result in hypertension, anemia, and hypoxia. Hypoxia and anemia unrelated to hypercalcemia are also common in advanced cancer patients. In the current study, either mechanism could account for malaise from the second cluster (fatigue/weakness, shortness of breath/difficulty breathing, and trouble sleeping) and from the follow-up cluster that is moderated further by hypertension. Secondary anxiety related to any of these conditions could compound these clusters.
The dramatic deterioration in the second cluster when the hip/pelvis site of palliative radiation was excluded (see footnote d, Table 4) suggests that metastases to the weight-bearing bones of the hip and pelvis configure strongly in the functional decline and malaise reflected by this cluster of symptoms. Although higher physician referral to palliative radiation would be expected to prevent fracture of weight-bearing bones, the frequency of this category is similar to other major sites of palliative radiation; these results do not appear to be explained by disproportionate physician referral. A more plausible explanation could be that the process of bone formation and resorption may be quickened in weight-bearing bones which may be more subject to wear and tear; bone loss from metastases at these sites could be more dramatic, leading more readily to anemia, hypoxia, and hypercalcemia.
If this is correct, the early use of palliative radiation at weight-bearing sites could help reduce these complications. Also note that bisphosphonates (especially zoledronic acid), which were not approved during the sample collection period (1991–1992), are now considered the best treatment for hypercalcemia of malignancy. Bisphosphonates have been shown to reduce fractures, spinal cord complications, and bone pain, as well as the need for palliative radiation or surgery.102 Widespread use of bisphosphonates for bone metastases could potentially reduce hypercalcemia of malignancy, anemia, and hypoxia that contribute to the hypertension-related symptom cluster.
Future Research on Crossover Interventions
Despite the strong internal validity of the current study afforded by the specification flexibility to model symptom clusters within participants, supported by a theoretical and empirical basis, the moderate participation rate limits the generalizability of the findings across patients initiating palliative radiation. Future studies based on diverse and random samples are needed to assess the prevalence of symptom clusters and the scope for crossover interventions.
An important clue regarding untapped potential for crossover interventions is revealed by the simple fact that relatively high correlations between fatigue and depression were maintained after items associated with fatigue were removed from depression scales.103 Such findings suggest that fatigue and depression may be correlated because both constructs stem from a common higher-order factor, even when shared-item variance is removed. This higher-order factor could incorporate two types of sickness behavior identified to date, a depressive syndrome (with a high negative affect component) and a neurovegetative syndrome characterized by malaise, anhedonia, anorexia, and non-responsiveness to SSRI antidepressants.45
The robustness of these correlations provides an additional rationale for supporting the call for controlled trials to identify non-SSRI antidepressants that improve fatigue even in patients without depression.20 Clinical observations suggest that antidepressants may yield greater energy enhancement compared to mood improvement,104 especially for certain agents (venlafaxine and bupropion,105 the secondary amine tricyclics including nortriptyline and desipramine106) that act similar to psycho-stimulants by increasing synaptic levels of norepinephrine.107 Because psychostimulants increase plasma levels of agents such as tricyclic antidepressants, controlled trials should also test combinations of antidepressants and psychostimulants.
Several crossover effects for such controlled trials are suggested by the current study. The significance of the pain clusters involving fever, fatigue/weakness, and weight loss suggest that antidepressants, psychostimulants, as well as mood- and appetite-enhancing corticosteroids (dexamethasone, prednisone),108 might relieve pain by reducing fatigue/weakness linked to mechanisms that promote fever and weight loss. These medications could also act to reduce pain directly.
In the current study, given the overlap in symptom clusters when nausea/vomiting substitutes for pain, it remains plausible that reducing fatigue/weakness associated with fever and weight loss could also reduce nausea/vomiting as well. For instance, decreased activity from weakness may lead to constipation. In turn, receptors in the gut stimulate vagal and sympathetic afferents that activate the nausea and vomiting center in the brain.109 Thus, interventions to relieve weakness, or fatigue that leads to weakness, could potentially reduce constipation as well as nausea and vomiting. The broad application of bisphosphonates and palliative radiation in patients with metastases could provide indirect yet effective relief for pain, and it would appear, for nausea/vomiting, and constipation, through correction of conditions that are tied more directly to weight loss and fatigue/weakness (i.e., bone loss, skeletal complications, hypercalcemia of malignancy, and anemia). The indirect nature of the mechanism is suggested by the gradual onset and improvement in pain relief (one to four weeks) after initiating palliative radiation.100,101,110,111
A shared mechanism is also suggested by the activity of corticosteroids, which not only relieve pain but are used to prevent delayed chemotherapy-induced nausea and emesis.112 On the other hand, opioids to relieve pain, as well as metabolic abnormalities such as hypercalcemia, result in nausea and vomiting by activating the chemoreceptive trigger zone.113 Therefore, although pain and nausea may co-occur as part of a common mechanism during sickness behavior, the relationship between pain and nausea may also be mediated by opioid use.
However, the psychostimulant methylphenidate was found to limit opioid sedation, which is related to fatigue/weakness.114 This finding, in concert with symptom cluster findings from the current study, suggests an interesting possibility for controlled trials involving psychostimulants to reduce fatigue and depression. In the current study, the significant and overlapping symptom clusters involving pain or nausea/vomiting with fatigue/weakness suggests that individual psychostimulants should be tested not only for reductions in fatigue and weakness but for pain, nausea/vomiting, and related symptoms such as constipation. If psychostimulants like methylphenidate are found to act on the vagal afferent pathway, their use at a lower opioid dose could reduce not only the fatigue and weakness from opioid sedation, but opioid-induced nausea, vomiting, and constipation as well.
Other promising interventions may stimulate cytokine antagonists in central or peripheral sites in order to reduce the buildup of proinflammatory cytokines associated with fatigue, pain, nausea/vomiting, and weight loss. Cyclooxygenase-2 (COX-2) inhibitors (celecoxib, rofecoxib), a selective class of NSAIDs, disrupt the expression of tumor necrosis factor-α (TNF-α),115 a cytokine associated with fatigue and weakness through its actions as a cachetin (which induces weight loss) and as a pyrogen (which induces fever). Moreover, cytokine antagonists such as COX-2 inhibitors and in-terleukin-1 (IL-1) inhibitors show promise in reducing symptoms associated with fatigue, such as peripheral nerve pathological pain syndromes.116 Once again, if pain co-occurs with fever, fatigue, or weight loss, the anti-inflammatory effects of these cytokine antagonists could reduce pain indirectly through their impacts on these other symptoms.
Greater attention needs to be paid to fever. Fever can become chronic within targeted subgroups, such as patients with immunosuppression (neutropenia),50,117 comorbid advanced dementia118 or those who cannot afford out-of-pocket drug costs or adhere to drug regimens. In these situations, chronic fever could sustain or aggravate other symptoms for longer periods. Thus, it is important to recognize that the plausibility and validity of crossover effects by interventions for fever and other symptoms are distinct from their scope or applicability across cancer patients.
Future longitudinal research should investigate whether potential mechanisms of malaise involve mediated pathways, while also accounting for symptom comorbidity. To the extent that increased pain sensitivity is a consequence of other symptoms, interventions that relieve these other symptoms would be promising targets to reduce or prevent pain. Questions related to the specific symptoms in the current study include: Does prolonged fever during SB simultaneously increase sensitivity to pain and nausea/vomiting? Does increased sensitivity to pain, which may heighten fatigue, occur as a consequence of nausea or vomiting? And in patients with trouble sleeping, does depressive affect appear to diminish as difficulty breathing increases (see Figure 3b) because it is displaced by anxiety?
Specific types of pain, such as gastrointestinal pain and pain from constipation, should be distinguished, and the most direct symptom consequences of fever, such as dehydration, should be investigated. For instance, is fever or the resulting dehydration most associated with increased sensitivity to pain or to certain types of pain (especially when nausea and vomiting limit intake of fluids)? Is there a causal ordering of subsequent symptoms (e.g., fatigue, pain, nausea) that stem from fever and dehydration?
Crossover impacts by non-pharmacological interventions should not be neglected in future research. Promising approaches include physical exercise,119 meditation and directed breathing, and psychoeducation and counseling with couples, caregivers, families, and support groups. It is critical, but not widely recognized, that medical and pharmacological interventions that minimize “triggering” factors in symptom clusters may yield important opportunities to improve the scope and efficacy of exercise, psychosocial interventions (such as cognitive behavioral therapy,120 motivational interviewing), and complementary/alternative medical modalities, to help patients cope with the “maintenance” factors of chronic and residual symptoms. As feasible linkages across medical, pharmacological, and psychosocial modalities of care become increasingly demonstrated, multidisciplinary practice by physicians, nurses, social workers, and other health professions could become more coordinated and effective in treating physical symptom clusters, comorbid depression, and other mental health symptoms.
Acknowledgments
The author thanks Richard Schulz, MD, Professor of Psychiatry and Directorof Gerontology, University of Pittsburgh, for the opportunity to use these data (Hospice Program Grant, CA48635, National Cancer Institute). During the period of this research, the author received financial support from a Social Work Leadership Development Award (Project on Death in America, Open Society Institute), the National Institute of Mental Health, and the Hartford Geriatric Social Work Faculty Scholar Initiative.
References
- 1.Tennstedt SL. Research design in end-of-life research: State of the science. Gerontologist. 2002;42:99–103. doi: 10.1093/geront/42.suppl_3.99. [DOI] [PubMed] [Google Scholar]
- 2.National Institutes of Health. NIH State-of-the-Science Conference on Symptom Management in Cancer: Pain, Depression, and Fatigue. [Program and Abstract Book]; William H. Natcher Conference Center; Bethesda, MD, National Institutes of Health. July 15–17, 2002. [Google Scholar]
- 3.National Institutes of Health. Symptoms in Terminal Illness: A Research Workshop. Solar Building, Rockville, Maryland: National Institutes of Health; September 22–23, 1997. Treating Symptoms at the End of Life. [Google Scholar]
- 4.Cella D, Lai JS, Chang CH, Peterman A, Slavin M. Fatigue in cancer patients compared with fatigue in the general US population. Cancer. 2002;94:528–538. doi: 10.1002/cncr.10245. [DOI] [PubMed] [Google Scholar]
- 5.Portenoy RK, Kanner R, Foley KM. Pain syndromes with cancer. Philadelphia: W.B. Saunders; 1996. [Google Scholar]
- 6.World Health Organization. Palliation of bone pain in cancer: facts and controversies. [Accessed November 24, 2004.];Cancer Pain Release. 2002 15(4) www.whocancerpain.wisc.edu/eng/15_4/15_4.html.
- 7.Spiegel D, Sand S, Koopman C. Pain and depression in patients with cancer. Cancer. 1994;74:2570–2578. doi: 10.1002/1097-0142(19941101)74:9<2570::aid-cncr2820740927>3.0.co;2-3. [DOI] [PubMed] [Google Scholar]
- 8.Ciaramella A, Poli P. Assessment of depression among cancer patients: The role of pain, cancer type and treatment. Psycho-Oncol. 2001;10:156–165. doi: 10.1002/pon.505. [DOI] [PubMed] [Google Scholar]
- 9.Kurtz M, Kurtz J, Stommel M, Given C, Given B. Predictors of depressive symptomatology of geriatric patients with lung cancer—a longitudinal analysis. Psycho-Oncol. 2002;11:12–22. doi: 10.1002/pon.545. [DOI] [PubMed] [Google Scholar]
- 10.Cubeddu LX, Hoffmann IS, Fuenmayor NT, Malave JJ. Changes in serotonin metabolism in cancer patients: Its relationship to nausea and vomiting induced by chemotherapeutic drugs. Br J Cancer. 1992;66:198–203. doi: 10.1038/bjc.1992.242. [DOI] [PMC free article] [PubMed] [Google Scholar]
- 11.Hickok J, Morrow G, McDonald S, Bellg A. Frequency and correlates of fatigue in lung cancer patients receiving radiation therapy: Implications for management. J Pain Symptom Manage. 1996;11:370–377. doi: 10.1016/0885-3924(96)00008-5. [DOI] [PubMed] [Google Scholar]
- 12.Lavoie Smith E, Hann D, Ahles T, et al. Dyspnea, anxiety, body consciousness, and quality of life in patients with lung cancer. J Pain Symptom Manage. 2001;21:323–329. doi: 10.1016/s0885-3924(01)00255-x. [DOI] [PubMed] [Google Scholar]
- 13.Bower J, Ganz P, Desmond K, et al. Fatigue in breast cancer survivors: occurrence, correlates, and impact on quality of life. J Clin Oncol. 2000;18:743. doi: 10.1200/JCO.2000.18.4.743. [DOI] [PubMed] [Google Scholar]
- 14.Miaskowski C, Lee K. Pain, fatigue, and sleep disturbances in oncology outpatients receiving radiation therapy for bone metastasis: A pilot study. J Pain Symptom Manage. 1999;17:320–332. doi: 10.1016/s0885-3924(99)00008-1. [DOI] [PubMed] [Google Scholar]
- 15.Given C, Given B, Azzouz F, Kozachik S, Stommel M. Predictors of pain and fatigue in the year following diagnosis among elderly cancer patients. J Pain Symptom Manage. 2001;21:456–466. doi: 10.1016/s0885-3924(01)00284-6. [DOI] [PubMed] [Google Scholar]
- 16.Kaasa S, Loge J, Knobel H, et al. Fatigue. Measures and relation to pain. Acta Anesth Scand. 1999;43:939–947. doi: 10.1034/j.1399-6576.1999.430911.x. [DOI] [PubMed] [Google Scholar]
- 17.Portenoy R, Bruera E, editors. Issues in palliative care research. New York: Oxford; 2003. [Google Scholar]
- 18.Bruera E, MacDonald R. Overwhelming fatigue in advanced cancer. Am J Nursing. 1988;88:99–100. [PubMed] [Google Scholar]
- 19.Kurzrock R. The role of cytokines in cancer-related fatigue. Cancer. 2001;92:1684–1688. doi: 10.1002/1097-0142(20010915)92:6+<1684::aid-cncr1497>3.0.co;2-z. [DOI] [PubMed] [Google Scholar]
- 20.Jacobsen P, Weitzner M. Evaluating the relationship of fatigue to depression and anxiety in cancer patients. In: Portenoy R, Bruera E, editors. Issues in palliative care research. New York: Oxford University Press; 2003. pp. 127–149. [Google Scholar]
- 21.Hart BL. Biological basis of the behavior of sick animals. Neurosci Biobehav Rev. 1988;12:123–137. doi: 10.1016/s0149-7634(88)80004-6. [DOI] [PubMed] [Google Scholar]
- 22.Hickie I, Lloyd A. Are cytokines associated with neuropsychiatric syndromes in humans? Int J Immunopharm. 1995;17:677–683. doi: 10.1016/0192-0561(95)00054-6. [DOI] [PubMed] [Google Scholar]
- 23.Yirmaya R. Behavioral and psychological effects of immune activation: Implications for ‘depression due to a medical condition’. Curr Opin Psychiatry. 1997;10:470–476. [Google Scholar]
- 24.Dantzer R, Bluthe RM, Gheusi G, et al. Molecular basis of sickness behavior. Ann NY Acad Sci. 1998;856:132–138. doi: 10.1111/j.1749-6632.1998.tb08321.x. [DOI] [PubMed] [Google Scholar]
- 25.Charlton BG. The malaise theory of depression: Major depressive disorder is sickness behavior and antidepressants are analgesic. Med Hypoth. 2000;54:126–130. doi: 10.1054/mehy.1999.0986. [DOI] [PubMed] [Google Scholar]
- 26.Charlton BG. The malaise theory of depression. Med Hypotheses. 2000;54:126–130. doi: 10.1054/mehy.1999.0986. [DOI] [PubMed] [Google Scholar]
- 27.Kronfol Z, Remick DG. Cytokines and the brain: Implications for clinical psychiatry. Am J Psychiatry. 2000;157:683–694. doi: 10.1176/appi.ajp.157.5.683. [DOI] [PubMed] [Google Scholar]
- 28.Besedovsky HO, del Rey A. Immuneneuroen-docrine interaction: facts and hypotheses. Endocr Rev. 1996;17:64–102. doi: 10.1210/edrv-17-1-64. [DOI] [PubMed] [Google Scholar]
- 29.Hori T, Katafuchi T, Shimizu N, Niijima A. The autonomic nervous system as a communication channel between the brain and the immune system. Neuroimmunomodulation. 1995;2:203. doi: 10.1159/000097198. [DOI] [PubMed] [Google Scholar]
- 30.Pariante CM, Pearce BD, Pisell TL, et al. The proinflammatory cytokine, interleukin-1 alpha, reduces glucocorticoid receptor translocation and function. Endocrinology. 1999;140:4359–4366. doi: 10.1210/endo.140.9.6986. [DOI] [PubMed] [Google Scholar]
- 31.Yirmaya R. Endotoxin produces a depressive-like episode in rats. Brain Res. 1996;711:163. doi: 10.1016/0006-8993(95)01415-2. [DOI] [PubMed] [Google Scholar]
- 32.Hill MR, Stith RD, McCallum RE. Interleukin 1: A regulatory role in glucocorticoid-regulated hepatic metabolism. J Immunol. 1986;137:858–862. [PubMed] [Google Scholar]
- 33.Hill MR, Stith RD, McCallum RE. Human recombinant IL-1 alters glucocorticoid receptor function in Reuber hepatoma cells. J Immunol. 1988;141:1522–1528. [PubMed] [Google Scholar]
- 34.Dunn AJ, Wang J. Cytokine effects on CNS biogenic amines. Neuroimmunomodulation. 1995;2:319. doi: 10.1159/000097211. [DOI] [PubMed] [Google Scholar]
- 35.Sluzewska A, Rybakowsky J, Bosmans E, et al. Indicators of immune activation in major depression. Psychiatry Res. 1996;64:161–167. doi: 10.1016/s0165-1781(96)02783-7. [DOI] [PubMed] [Google Scholar]
- 36.Hasselgren PO, Pederssen P, Sax HC, Warner BW, Fisher JH. Current concepts of protein turnover and amino acid transport in liver and skeletal muscle during sepsis. Arch Surg. 1988;123:992–999. doi: 10.1001/archsurg.1988.01400320078016. [DOI] [PubMed] [Google Scholar]
- 37.Kent S, Bluthe RM, Kelley KW, Dantzer R. Sickness behavior as a new target for drug development. Trends Pharmacol Sci. 1992;13:24–28. doi: 10.1016/0165-6147(92)90012-u. [DOI] [PubMed] [Google Scholar]
- 38.Gleason OC, Yates WR. Five cases of interferon-alpha-induced depression treated with antidepressant therapy. Psychosomatics. 1999;40:510–512. doi: 10.1016/S0033-3182(99)71190-4. [DOI] [PubMed] [Google Scholar]
- 39.Gutstein H. The biologic basis of fatigue. Cancer. 2001;92:1678–1683. doi: 10.1002/1097-0142(20010915)92:6+<1678::aid-cncr1496>3.0.co;2-r. [DOI] [PubMed] [Google Scholar]
- 40.Clatworthy A, Grose E. Immune-mediated alterations in nociceptive sensory function in Aplysia californica. J Exp Biol. 1999;202:623–630. doi: 10.1242/jeb.202.5.623. [DOI] [PubMed] [Google Scholar]
- 41.Chacur M, Milligan E, Gazda L, et al. A new model of sciatic inflammatory neuritis (SIN): Induction of unilateral and bilateral mechanical allodynia following acute unilateral perisciatic immune activation in rats. Pain. 2001;94:231–244. doi: 10.1016/S0304-3959(01)00354-2. [DOI] [PubMed] [Google Scholar]
- 42.Milligan E, O’Connor K, Nguyen K, et al. Intrathecal HIV-1 envelope glycoprotein gp120 induces enhanced pain states mediated by spinal cord proinflammatory cytokines. J Neurosci. 2001;21:2808–2819. doi: 10.1523/JNEUROSCI.21-08-02808.2001. [DOI] [PMC free article] [PubMed] [Google Scholar]
- 43.Checkley S. The neuroendocrinology of depression and chronic stress. Br Med Bull. 1996;52:597–617. doi: 10.1093/oxfordjournals.bmb.a011570. [DOI] [PubMed] [Google Scholar]
- 44.Inui A. Cancer anorexia-cachexia syndrome: Are neuropeptides the key? Cancer Res. 1999;59:4493–4501. [PubMed] [Google Scholar]
- 45.Capuron L, Gumnick J, Musselman D, et al. Neurobehavioral effects of interferon-α in cancer patients: Phenomenology and paroxetine responsiveness of symptom dimensions. Neuropsychopharm. 2002;26:643–652. doi: 10.1016/S0893-133X(01)00407-9. [DOI] [PubMed] [Google Scholar]
- 46.Capuron L, Ravaud A, Dantzer R. Early depressive symptoms in cancer patients receiving interleukin 2 and/or interferon α-2b therapy. J Clin Oncol. 2000;18:2143–2151. doi: 10.1200/JCO.2000.18.10.2143. [DOI] [PubMed] [Google Scholar]
- 47.Krueger J, Majde J, Obal F., Jr Sleep and host defense. Brain Beh Immun. 2003;17:S41–S47. doi: 10.1016/s0889-1591(02)00065-x. [DOI] [PubMed] [Google Scholar]
- 48.Holden R, Pakula I. Tumor necrosis factor-α: Is there a continuum of liability between stress, anxiety states, and anorexia nervosa? Med Hypotheses. 1999;52:155–162. doi: 10.1054/mehy.1997.0641. [DOI] [PubMed] [Google Scholar]
- 49.Kelley K, Bluthe R-M, Dantzer R, et al. Cytokine-induced sickness behavior. Brain Behav Immun. 2003;17(1 Suppl 1):S112–S118. doi: 10.1016/s0889-1591(02)00077-6. [DOI] [PubMed] [Google Scholar]
- 50.Pizzo P. Fever in immunocompromised patients. N Engl J Med. 1999;341:893–899. doi: 10.1056/NEJM199909163411207. [DOI] [PubMed] [Google Scholar]
- 51.Aloisi A, Albonetti M, Muscettola M, et al. Effects of formalin-induced pain on ACTH, beta-endorphin, corticosterone and interleukin-6 plasma levels in rats. Neuroendocrinology. 1995;62:13–18. doi: 10.1159/000126983. [DOI] [PubMed] [Google Scholar]
- 52.Schulz R, Williamson GM, Knapp JE, et al. The psychological, social, and economic impact of illness among patients with recurrent cancer. J Psychosocial Oncology. 1995;13:21–45. [Google Scholar]
- 53.Cella D, Paul D, Yount S, et al. What are the most important symptom targets when treating advanced cancer? A survey of providers in the National Comprehensive Cancer Network (NCCN) Cancer Invest. 2003;21:526–535. doi: 10.1081/cnv-120022366. [DOI] [PubMed] [Google Scholar]
- 54.Miller A. Cytokines and sickness behavior: Implications for cancer care and control. Brain Behav Immun. 2003;17:S132–S134. doi: 10.1016/s0889-1591(02)00080-6. [DOI] [PubMed] [Google Scholar]
- 55.Littman G, Walker B, Schneider B. Reassessment of verbal and visual analog ratings in analgesic studies. Clin Pharmacol Ther. 1985;38:16–23. doi: 10.1038/clpt.1985.127. [DOI] [PubMed] [Google Scholar]
- 56.Max M. Methodological issues in the design of analgesic clinical trials. In: Portenoy R, Bruera E, editors. Issues in palliative care research. New York: Oxford; 2003. pp. 3–21. [Google Scholar]
- 57.Desbiens NA, Mueller-Rizner N, Connors AF, Jr, Wenger NS, Lynn J. The symptom burden of seriously ill hospitalized patients. J Pain Symptom Manage. 1999;17:248–255. doi: 10.1016/s0885-3924(98)00149-3. [DOI] [PubMed] [Google Scholar]
- 58.Horton R. Differences in assessment of symptoms and quality of life between patients with advanced cancer and their specialist palliative care nurses in a home care setting. Palliat Med. 2002;16:488–494. doi: 10.1191/0269216302pm588oa. [DOI] [PubMed] [Google Scholar]
- 59.Hwang S, Chang V, Kasimis B. A comparison of three fatigue measures in veterans with cancer. Cancer Invest. 2003;21:363–373. doi: 10.1081/cnv-120018227. [DOI] [PubMed] [Google Scholar]
- 60.Kirsch K, Passik S, Holtsclaw E, Donaghy K, Theobald D. I get tired for no reason: A single item screening for cancer-related fatigue. J Pain Symptom Manage. 2001;22:931–937. doi: 10.1016/s0885-3924(01)00350-5. [DOI] [PubMed] [Google Scholar]
- 61.Loprinzi C, Sloan J, Rowland KMJ. Methodological issues regarding cancer anorexia/cachexia trials. In: Portenoy R, Bruera E, editors. Issues in palliative care research. New York: Oxford; 2003. pp. 25–40. [Google Scholar]
- 62.Repetto L, Venturino A, Vercelli M, et al. Performance status and comorbidity in elderly cancer patients compared with young patients with neoplasia and elderly patients without neoplastic conditions. Cancer. 1998;82:760–765. [PubMed] [Google Scholar]
- 63.Desbiens NA, Mueller-Rizner N, Connors AF, Wenger NS. The relationship of nausea and dyspnea to pain in seriously ill patients. Pain. 1997;71:149–156. doi: 10.1016/s0304-3959(97)03353-8. [DOI] [PubMed] [Google Scholar]
- 64.Roach MJ, Connors AF, Dawson NV, et al. Depressed mood and survival in seriously ill hospitalized adults. Arch Int Med. 1998;158:397–404. doi: 10.1001/archinte.158.4.397. [DOI] [PubMed] [Google Scholar]
- 65.Zabora J, Brintzenhofeszoc K, Curbow B, Hooker C, Piantadosi S. The prevalence of psychological distress by cancer site. Psychooncol. 2001;10:19–28. doi: 10.1002/1099-1611(200101/02)10:1<19::aid-pon501>3.0.co;2-6. [DOI] [PubMed] [Google Scholar]
- 66.Derogatis LR. Brief Symptom Inventory administration, scoring, and procedures manual. Minneapolis, MN: NCS Pearson; 1993. [Google Scholar]
- 67.Kornblith AB, Herndon JE, 2nd, Zuckerman E, et al. Comparison of psychosocial adaptation of advanced stage Hodgkin’s disease and acute leukemia survivors. Ann Oncol. 1998;9:297–306. doi: 10.1023/a:1008297130258. [DOI] [PubMed] [Google Scholar]
- 68.Tchekmedyian NS, Kallich J, McDermott A, Fayers P, Erder MH. The relationship between psychologic distress and cancer-related fatigue. Cancer. 2003;98:198–203. doi: 10.1002/cncr.11463. [DOI] [PubMed] [Google Scholar]
- 69.Clark VA, Aneshensel CS, Frerichs RR, Morgan TM. Analysis of effects of sex and age in response to items on the CES-D scale. Psychiatry Research. 1981;5:171–181. doi: 10.1016/0165-1781(81)90047-0. [DOI] [PubMed] [Google Scholar]
- 70.Sawyer-Radloff L, Teri L. Use of the Center for Epidemiologic Studies-Depression Scale with older adults. Clinical Gerontologist. 1986;5:119–135. [Google Scholar]
- 71.Hertzog C, Alstine JV, Usala PD, Hultsch DF, Dixon R. Measurement properties of the Center for Epidemiological Studies Depression Scale (CES-D) in older populations. Psychological Assessment. 1990;2:64–72. [Google Scholar]
- 72.Liang J, Tran TV, Krause N, Markides KS. General differences in the structure of CES-D Scale in Mexican Americans. J Gerontology. 1989;44:110–120. doi: 10.1093/geronj/44.3.s110. [DOI] [PubMed] [Google Scholar]
- 73.Hann D, Winter K, Jacobsen P. Measurement of depressive symptoms in cancer patients: Evaluation of the Center for Epidemiological Studies Depression Scale (CES-D) J Psychosom Res. 1999;46:437–443. doi: 10.1016/s0022-3999(99)00004-5. [DOI] [PubMed] [Google Scholar]
- 74.Aiken LS, West SG. Multiple regression: Testing and interpreting interactions. Newbury Park, CA: Sage; 1991. [Google Scholar]
- 75.Cohen J, Cohen P, West SG, Aiken LS. Applied multiple regression/correlation analysis for the behavioral sciences. 3. Mahwah, NJ: Lawrence Erlbaum; 2003. [Google Scholar]
- 76.Ganzach Y. Misleading interaction and curvilinear terms. Psychol Methods. 1997;2:235–247. [Google Scholar]
- 77.Aguinis H. Regression analysis for categorical moderators. New York: Guilford; 2004. [Google Scholar]
- 78.Kline RB. Principles and practice of structural equation modeling. New York: Guilford; 1998. [Google Scholar]
- 79.Ripamonti C, Bruera E. Dyspnea: Pathophysiology and assessment. J Pain Symptom Manage. 1997;13:220–232. doi: 10.1016/s0885-3924(96)00327-2. [DOI] [PubMed] [Google Scholar]
- 80.Curhan G, Willett W, Rosner B, Stampfer M. Frequency of analgesic use and risk of hypertension in younger women. Arch Intern Med. 2002;162:2204–2208. doi: 10.1001/archinte.162.19.2204. [DOI] [PubMed] [Google Scholar]
- 81.Dedier J, Stampfer M, Hankinson S, et al. Non-narcotic analgesic use and the risk of hypertension in US women. Hypertension. 2002;40:604–608. doi: 10.1161/01.hyp.0000035856.77718.da. [DOI] [PubMed] [Google Scholar]
- 82.Aisen P, Schafer K, Grundman M, Thomas R, Thal L. NSAIDs and hypertension. Arch Intern Med. 2003;163:1115. doi: 10.1001/archinte.163.9.1115-a. [Letter] [DOI] [PubMed] [Google Scholar]
- 83.Mock V. Fatigue management: Evidence and guidelines for practice. Cancer. 2001;92(6 Suppl):1699–1707. doi: 10.1002/1097-0142(20010915)92:6+<1699::aid-cncr1500>3.0.co;2-9. [DOI] [PubMed] [Google Scholar]
- 84.Gridelli C, Maione P, Rossi A. Corticosteroids underemployment in delayed chemotherapy-induced nausea and emesis with poor adherence to American Society of Clinical Oncology Guidelines: Is this a reasonable clinical choice for the elderly? J Clin Oncol. 2003;21:4066–4067. doi: 10.1200/JCO.2003.99.128. [Letter] [DOI] [PubMed] [Google Scholar]
- 85.Mertens W, Higby D, Brown D, et al. Corticosteroids underemployment in delayed chemotherapy-induced nausea and emesis with poor adherence to American Society of Clinical Oncology Guidelines: Is this a reasonable clinical choice for the elderly? J Clin Oncol. 2003;21:4067–4068. doi: 10.1200/JCO.2003.99.128. [Reply] [DOI] [PubMed] [Google Scholar]
- 86.Freda P, Wardlaw S, Bruce J, et al. Differential diagnosis in Cushing’s syndrome: Use of corticotropin-releasing hormone. Medicine. 1995;74:74–82. doi: 10.1097/00005792-199503000-00002. [DOI] [PubMed] [Google Scholar]
- 87.Hopwood P, Stephens R. Depression in patients with lung cancer: Prevalence and risk factors derived from quality-of-life data. J Clin Oncol. 2000;18:893–903. doi: 10.1200/JCO.2000.18.4.893. [DOI] [PubMed] [Google Scholar]
- 88.Tanaka K, Akechi T, Okuyama T, Nishiwaki Y, Uchitomi Y. Factors correlated with dyspnea in advanced lung cancer patients: Organic causes and what else? J Pain Symptom Manage. 2002;23:490–500. doi: 10.1016/s0885-3924(02)00400-1. [DOI] [PubMed] [Google Scholar]
- 89.Maier S, Watkins L. Immune-to-central nervous system communication and its role in modulating pain and cognition: Implications for cancer and cancer treatment. Brain Behav Immun. 2003;17:S125–S131. doi: 10.1016/s0889-1591(02)00079-x. [DOI] [PubMed] [Google Scholar]
- 90.Hansen M, O’Connor K, Goehler L, Watkins L, Maier S. The contribution of the vagus nerve in interleukin-1-induced fever is dependent on dose. Am J Physiol Regul Integr Comp Physiol. 2001;280:R929–R934. doi: 10.1152/ajpregu.2001.280.4.R929. [DOI] [PubMed] [Google Scholar]
- 91.Luheshi G, Bluthe R, Rushforth D, et al. Vagotomy attenuates the behavioural but not the pyrogenic effects of interleukin-1 in rats. Auton Neurosci. 2000;85:127–132. doi: 10.1016/S1566-0702(00)00231-9. [DOI] [PubMed] [Google Scholar]
- 92.Mackowiak P, Bartlett J, Borden E, et al. Concepts of fever: Recent advances and lingering dogma. Clin Infect Dis. 1997;25:119–138. doi: 10.1086/514520. [DOI] [PubMed] [Google Scholar]
- 93.Pizzo P. Management of fever in patients with cancer and treatment-induced neutropenia. N Engl J Med. 1993;328:1323–1332. doi: 10.1056/NEJM199305063281808. [DOI] [PubMed] [Google Scholar]
- 94.MacDonald N. Redefining symptom management. J Palliative Med. 2002;5:301–304. doi: 10.1089/109662102753641304. [DOI] [PubMed] [Google Scholar]
- 95.Bruera E, Suarez-Almazor M, Velasco A, et al. The assessment of constipation in terminal cancer patients admitted to a palliative care unit: A retrospective review. J Pain Symptom Manage. 1994;9:515–519. doi: 10.1016/0885-3924(94)90113-9. [DOI] [PubMed] [Google Scholar]
- 96.Maguire LC, Yon JL, Miller E. Prevention of narcotic-induced constipation. N Engl J Med. 1981;305:1651. doi: 10.1056/nejm198112313052717. [DOI] [PubMed] [Google Scholar]
- 97.Walsh D. Commentary on research in cancer pain and palliative care: Assessment and treatment of opioid-induced constipation. Cancer Pain Release. 1998;11:6–7. [Google Scholar]
- 98.Corcoran MB. Polypharmacy in the older patient with cancer. Cancer Control. 1997;4:419–428. [PubMed] [Google Scholar]
- 99.Yau V, Chow E, Davis L, et al. Pain management in cancer patients with bone metastases remains a challenge. J Pain Symptom Manage. 2004;27:1–3. doi: 10.1016/j.jpainsymman.2003.10.003. [letter] [DOI] [PubMed] [Google Scholar]
- 100.Tong C, Gillick L, Hendrickson F. The palliation of symptomatic osseous metastases: Final results of the study by the Radiation Therapy Oncology Group. Cancer. 1982;50:893–899. doi: 10.1002/1097-0142(19820901)50:5<893::aid-cncr2820500515>3.0.co;2-y. [DOI] [PubMed] [Google Scholar]
- 101.Steenland E, Leer J, Houwelingen HV, et al. The effect of single fraction compared to multiple fractions on painful bone metastases: A global analysis of the Dutch Bone Metastasis Study. Radiother Oncol. 1999;52:101–109. doi: 10.1016/s0167-8140(99)00110-3. [DOI] [PubMed] [Google Scholar]
- 102.Van Poznak C. The use of bisphosphonates in patients with breast cancer. Cancer Control. 2002;9:480–489. doi: 10.1177/107327480200900605. [DOI] [PubMed] [Google Scholar]
- 103.Smets EM, Garssen B, Cull A, de Haes JC. Application of the multidimensional fatigue inventory (MFI-20) in cancer patients receiving radiotherapy. Br J Cancer. 1996;73:241–245. doi: 10.1038/bjc.1996.42. [DOI] [PMC free article] [PubMed] [Google Scholar]
- 104.Lechin F, van der Dijs B, Benaim M. Benzodiazepines: Tolerability in elderly patients. Psychother Psychosom. 1996;65:171–182. doi: 10.1159/000289072. [DOI] [PubMed] [Google Scholar]
- 105.Marin R. Apathy: Concept, syndrome, neural mechanisms, and treatment. Semin Neuropsychiatry. 1996;1:304–314. doi: 10.1053/SCNP00100304. [DOI] [PubMed] [Google Scholar]
- 106.Portenoy R. Fatigue in medical illness: Research issues. In: Portenoy R, Bruera E, editors. Issues in palliative care research. New York: Oxford; 2003. pp. 151–171. [Google Scholar]
- 107.Popper C. Pharmacologic alternatives to psychostimulants for the treatment of attention-deficit/hyperactivity disorder. Child Adolesc Psychiatr Clin North Am. 2000;9:605–646. [PubMed] [Google Scholar]
- 108.Bruera E, Macmillan K, Hanson J, et al. A controlled trial of megestrol acetate on appetite, caloric intake, nutritional status, and other symptoms in patients with advanced cancer. Cancer. 1995;66:1279–1282. doi: 10.1002/1097-0142(19900915)66:6<1279::aid-cncr2820660630>3.0.co;2-r. [DOI] [PubMed] [Google Scholar]
- 109.Baines M. Nausea and vomiting in the patient with advanced cancer. J Pain Symptom Manage. 1988;3:81–85. doi: 10.1016/0885-3924(88)90165-0. [DOI] [PubMed] [Google Scholar]
- 110.Nielsen O, Bentzen S, Sandberg E, et al. Randomized trial of single dose versus fractionated palliative radiotherapy of bone metastases. Radiother Oncol. 1998;47:233–240. doi: 10.1016/s0167-8140(98)00011-5. [DOI] [PubMed] [Google Scholar]
- 111.Bone Pain Trial Working Party. 8 Gy single fraction radiotherapy for the treatment of metastatic skeletal pain: Randomized comparison with a multi-fraction schedule over 12 months of patient follow-up. Radiother Oncol. 1999;52:111–121. [PubMed] [Google Scholar]
- 112.Mertens W, Higby D, Brown D, et al. Improving the care of patients with regard to chemotherapy-induced nausea and emesis: The effect of feedback to clinicians on adherence to antiemetic prescribing guidelines. J Clin Oncol. 2003;21:1373–1378. doi: 10.1200/JCO.2003.08.118. [DOI] [PubMed] [Google Scholar]
- 113.Tyler L. Nausea and vomiting in palliative care. J Pharm Care Pain Symptom Control. 2000;8:263–281. [Google Scholar]
- 114.Wilwerding M, Loprinzi C, Mailliard J, et al. A randomized, crossover evaluation of methylphenidate in cancer patients receiving strong narcotics. Support Care Cancer. 1995;3:135–138. doi: 10.1007/BF00365854. [DOI] [PubMed] [Google Scholar]
- 115.Young W, Mahboubi K, Haider A, Li I, Ferreri N. Cyclooxygenase-2 is required for tumor necrosis factor-alpha- and angiotensin II-mediated proliferation of vascular smooth muscle cells. Circ Res. 2000;86:906–914. doi: 10.1161/01.res.86.8.906. [DOI] [PubMed] [Google Scholar]
- 116.Watkins L, Milligan E, Maier S. Glial activation: A driving force for pathological pain. Trends Neurosci. 2001;24:450–455. doi: 10.1016/s0166-2236(00)01854-3. [DOI] [PubMed] [Google Scholar]
- 117.Talcott J, Finberg R. Fever and neutropenia: How to use a new treatment strategy. N Engl J Med. 1999;341:362–363. doi: 10.1056/NEJM199907293410509. [DOI] [PubMed] [Google Scholar]
- 118.Pinderhughes ST, Morrison RS. Evidence-based approach to management of fever in patients with end-stage dementia. J Palliative Med. 2003;6:351–354. doi: 10.1089/109662103322144664. [DOI] [PubMed] [Google Scholar]
- 119.Dimeo FC, Stieglitz RD, Novelli-Fischer U, Fetscher S, Keul J. Effects of physical activity on the fatigue and psychologic status of cancer patients during chemotherapy. Cancer. 1999;85:2273–2277. [PubMed] [Google Scholar]
- 120.Wessely S. Studying nonpharmacological interventions for fatigue. In: Portenoy R, Bruera E, editors. Issues in palliative care research. New York: Oxford; 2003. pp. 111–125. [Google Scholar]