

Abstract
Substance P (SP) has been associated with pain and depression as well as neurodegenerative diseases. Many of these diverse actions of SP can potentially be attributed to SP metabolites generated at the blood-brain barrier (BBB). In this study, the metabolism of SP was investigated using an in vitro model of the BBB and LC-MS/MS. Substance P metabolism was found to be non-saturable in the concentration range of 100 nM to 10 μM, with approximately 70% of the peptide remaining intact after 5 h. The major metabolites of SP were identified by MS as 3-11 and 5-11. Two previously unreported metabolites, 5-11 and 6-11, were also found in our studies. Several additional minor SP metabolites, including 1-9 and 2-11, were also identified. A profile of the SP metabolites generated by the BBB over time was obtained. The results from the present study provide us a better understanding of the role of the blood-brain barrier in the pharmacology of SP.
Keywords: Substance P, blood-brain barrier, LC-MS/MS
Introduction
The blood-brain barrier (BBB) protects the brain and maintains homeostasis by limiting the entry of many blood-borne molecules and peptides. The tight junctions between the endothelial cells that comprise the BBB bestow these barrier properties to the BBB. Understanding the interactions between blood-borne neuropeptides such as substance P (SP) and the BBB is of utmost interest in the design of drugs for pain and neurodegenerative diseases [1–5]. Also, many neuropeptides such as SP can function as vectors for the delivery of potent drug substances to their target sites in the brain [6]. The BBB is also known to express metabolic enzymes that exhibit peptidase activity on its surface, generating metabolites that exert their own pharmacological effects. Thus, investigation of the metabolism of neuropeptides such as SP at the BBB interface can assist in understanding the complex physiological effects of major neuropeptides and their metabolites.
In vitro cell culture models of the BBB provide the advantage of studying the metabolism and permeation mechanisms of drug substances without the complexity associated with in vivo procedures. Further, unlike the in vivo studies, the samples generated from these in vitro experiments require little or no sample cleanup. The bovine brain microvessel endothelial cell (BBMEC) system is a well-characterized in vitro model of the BBB and retains many properties such as efflux, transport, and metabolic pathways of the intact BBB [7]. This in vitro model has been widely used in the investigation of peptide metabolism, transport, and binding at the BBB. Various enzymes have also been identified in the BBMEC model, including angiotensin-converting enzyme (ACE), hydrolyases, and peptidases [8, 9].
The structure of substance P offers many sites for metabolic cleavage. The various enzymes that have been identified to cleave SP include ACE, aminopeptidase, neutral endopeptidase, dipeptidyl aminopeptidase, post-proline cleaving enzyme, and SP degrading and hydrolyzing enzymes. ACE has been shown to be expressed in both the cytosol and the membrane surface of BBMEC. The various SP metabolites that are generated at the BBB are known to exert important physiological effects, including alteration of the levels of other neurotransmitters in the brain [10].
An earlier report of the metabolism of SP at the BBB utilized capillary electrophoresis with laser-induced fluorescence detection (CE-LIF) [11]. This method involved derivitization of the ε amino or lysine group with naphthalene dialdehyde and cyanide and thus is limited to detecting only lysine-containing metabolites. Although metabolism studies with SP have been performed in vivo using LC-MS/MS [12], its metabolism in the BBMEC model has not been investigated. Thus the objective of the present study was to investigate the metabolism of SP at the BBB and identify its major metabolites using LC-MS/MS. LC-MS/MS is capable of detecting all the metabolites of SP, and is not limited to a specific functional group. The results from this study are compared with those from in vivo studies using microdialysis sampling and with previous SP metabolism studies using CE-LIF.
Materials and Methods
Materials
Substance P 1-11, 1-4, 1-7, 1-9, 2-11 and (Tyr8) 1-11 were obtained from Bachem Biosciences (King of Prussia, PA, USA). SP 3-11, 5-11 and 6-11 were acquired from Advanced ChemTech (Louisville, KY, USA). Leucine-enkephalin (Leu-Enk), CaCl2, MgSO4, NaCl, KCl, Na2HPO4, KH2PO4, glucose, ascorbic acid, sodium bicarbonate, endothelial cell growth factor, streptomycin, horse serum, polymycin B, amphotericin B, heparin, and penicillin G were obtained from Sigma (St. Louis, MO, USA). Minimum essential medium (MEM), N-2-hydroxyethylpiperazine-N′-2-ethane sulfonic acid (HEPES), and Ham’s F-12 nutrient mixture (Ham’s F-12) were acquired from Gibco (Long Island, NY, USA). Acetonitrile (ACN, HPLC grade) was purchased from Fisher Scientific (Fair Lawn, NJ, USA) and formic acid (99%) was from Acros Organics (Morris Plains, NJ, USA).
Stock Solutions
A stock solution of 0.1% formic acid (FA) in water was prepared by diluting 1 ml of FA with 999 ml of NANOpure water (Labconco, Kansas City, MO, USA). The solution was then filtered through a 0.22 μm Magna nylon supported membrane filter from Osmonics (Minnetonka, MN, USA). The same procedure was used to prepare a 0.1% FA stock solution in ACN except that instead of being diluted with water, the FA was diluted with ACN prior to filtration. Stock solutions used for standards of SP, its metabolites, and internal standard (IS) (Tyr8) 1-11 were made up in 0.1% FA in water at concentrations of 100 μM for all compounds except SP 1-4, which was at 500 μM. The peptide stock solutions were stored at 4°C in 1.5 ml polypropylene microcentrifuge tubes from Fisher Scientific (Pittsburgh, PA, USA). The complete culture plating medium consisted of 10 mM HEPES, 13 mM sodium bicarbonate, 100 μg/ml of streptomycin and 100 μg/ml of penicillin G in a mixture of 50% MEM, and 50% Ham’s F-12. The culture medium was adjusted to pH 7.26 and sterile filtered. For the plating medium, 55 ml of horse serum, 1.25 ml of polymyxin B (20 mg/ml), and 0.125 ml of amphotericin B were added to 500 ml of the complete culture medium. The changing medium was prepared similarly except that 1.1 ml of heparin 50mg/ml and 2.5 ml of endothelial cell growth factor were added instead of polymyxin B and amphotericin B solutions. The plating medium and changing medium were then stored at 4°C until use. The buffer used for metabolism experiments consisted of 10 mM HEPES in 50% MEM and 50% Ham’s F-12.
LC-MS/MS parameters
All separations were performed using a Waters 2690 HPLC system (Waters, Milford, MA, USA), which contained a refrigerated autosampler (maintained at 4°C) and a column heater unit (maintained at 25°C). Samples were placed in 250 μl volume polypropylene autosampler vials (Fisher Scientific) and 25 μl was injected for each sample. The samples were analyzed using a 1.0 × 50 mm Vydac C-18 analytical column with 5 μm particles (Grace Vydac, Hesperia, CA, USA). The HPLC separation of SP and its metabolites was accomplished using a flow rate of 0.2 μl/min and gradient elution. For the gradient parameters, Solvent A was 0.1% FA in water and Solvent B was 0.1% FA in ACN. The gradient used for the separation was: 100% A (0.1% FA in water) from 0 to 2 min, a linear ramp from 2 to 5 min going from 100% A to 75% A and 25% B (0.1% FA in ACN), holding at 75% A and 25% B from 5 to 6 min, a linear return from 5 to 10 min going from 75% A and 25% B to 100% A, and a 5-min equilibration from 10 to 15 min at 100% A before the next injection. The column was connected to the HPLC system by 60 cm of 0.05″ PEEK tubing (Upchurch Scientific, Oak Harbor, WA, USA) and was connected to the detector by 50 cm of 0.07″ PEEK tubing (Upchurch Scientific). Tandem MS detection was accomplished using a Micromass Quattro Micro (Waters) in electrospray positive ionization mode (ESI+). The MS/MS settings are listed in Tables 1 and 2.
Table 1.
Precursor ion m/z’s, product ion m/z’s, cone voltages and collision energy values for SP, its metabolites, and internal standard.
| Compound | Molecular weight | Precursor m/z | Product m/z | Cone Voltage | Collision Energy |
|---|---|---|---|---|---|
| 1-4 | 497 | 249.2 | 70.0 | 18 | 30 |
| 1-7 | 900 | 450.7 | 70.1 | 30 | 40 |
| 1-9 | 1104 | 552.9 | 120.2 | 30 | 40 |
| 1-11 | 1347 | 674.6 | 120.2 | 35 | 45 |
| (Tyr8) 1-11 | 1364 | 682.6 | 104.2 | 35 | 40 |
| 2-11 | 1192 | 596.4 | 104.2 | 25 | 25 |
| 3-11 | 1094 | 547.9 | 104.2 | 20 | 20 |
| 5-11 | 869 | 869.4 | 120.2 | 40 | 60 |
| 6-11 | 741 | 741.4 | 120.2 | 35 | 55 |
Table 2.
Optimal parameters for SP and metabolites, which are held constant for each individual compound.
| MS/MS tune parameters | Parameter settings | Parameter unit (N/A if unit less) |
|---|---|---|
| Capillary voltage | 2.5 | kV |
| Extractor | 2 | V |
| RF lens | 0 | N/A |
| Source temperature | 100 | °C |
| Desolvation temperature | 350 | °C |
| Desolvation gas flow | 675 | L/hr |
| Cone gas flow | 40 | L/hr |
| LM and HM 1 resolution | 12 | N/A |
| Ion energy 1 | 0.5 | N/A |
| Entrance | 2 | N/A |
| Exit | 1 | N/A |
| LM and HM 2 resolution | 15 | N/A |
| Ion energy 2 | 2 | N/A |
| Multiplier voltage | 650 | V |
| Gas cell pirani pressure | 3.6 e−3 (argon) | mbar |
Investigation of SP metabolism in vitro using BBMECs
The BBMECs were isolated from the gray matter of bovine brains (see ref 13 for details). The BBMECs were then plated on a 12-well tissue culture plate using plating medium. After 3 days, the medium was replaced alternate days until the cells reached a confluent monolayer. Metabolism studies were conducted with the BBMECs after they had attained confluency. The metabolism of SP was investigated in the BBMECs using solutions of SP (100 nM, 1 μM or 10 μM SP) made up in 10 mM HEPES in 50% MEM and 50% Ham’s F-12. Before the metabolism studies were initiated, the growth medium in the plate was removed and the cells were rinsed with the above solution. The temperature was maintained at 37°C by placing the 12-well plate in a heated water bath. Following this, 2 ml of a SP solution was added to 9 of the 12 wells. The rest of the wells contained blank solution as a control. Substance P stability in the solution was also investigated simultaneously in a separate 24-well plate. Sixty microliter aliquots were taken out over a period of 5 h from the wells at different time intervals and diluted with 48 μl of 0.1% FA and 12 μl of 10 μM IS in 0.1% FA. These samples were then stored at −20°C until analyzed by LC-MS/MS for metabolism products.
Results and Discussion
Analytical method
An electrospray LC-MS/MS method for the detection of SP and its metabolites in cell culture samples was developed. The advantages of the LC-MS/MS technique over previous analytical methods for SP and its metabolites include: (i) compounds can be detected based on mass-to-charge (m/z) ratio, (ii) there is no need for sample derivatization (fluorescence and immunoassay-based methods), (iii) it does not generate radioactive waste, (iv) chromatographic runs are short, (v) it is amenable to automation, and (vi) it has excellent sensitivity and selectivity. Although other mass spectrometric techniques (such as MALDI) can be used for peptide identification, LC-MS/MS remains the method of choice for quantitative analysis of peptides [14]. Electrospray ionization in the positive mode was selected as the method for the detection of SP and its metabolites. The hydrophilic nature of the peptide and the presence of ionic residues in SP structure make the compound readily ionizable under ESI+ conditions, thus improving the sensitivity of the assay. The mobile phase for the analysis is composed of an acidic aqueous phase (0.1% formic acid) with an organic modifier (acetonitrile).
Using this LC-MS/MS method, with (Tyr8)-SP as internal standard, chromatographic separation of SP and its the fragments resulted in well-resolved peaks without any issues of co-elution and cross-talk among the compounds (Fig. 1). The linearity and linear range were assessed for SP and each of the metabolites (see Table 3 for results). The linearity (r2) was greater than 0.97 for all eight compounds and, with the exception of SP 1-4, the linear range was from 1 or 2 nM to at least 500 nM. The LC-MS/MS was also a very sensitive assay with a LOD of 2 nM or less for all compounds except SP 1-4 (Table 3). The lack of linear range and sensitivity for SP 1-4 is likely due to ion suppression by co-eluting salts from the cell medium. The final method required minimal sample preparation (only dilution and addition of internal standard) and no derivatization. The MS-based method could also be automated and had a separation time of less than 10 min and a 15-min total analysis time (5 min for column equilibration between runs).
Figure 1.
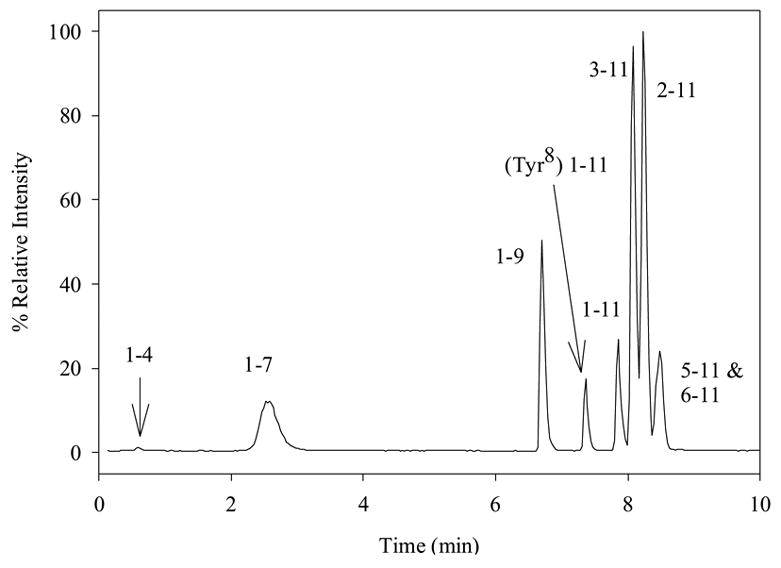
Chromatogram of 1 μM SP, metabolites, and internal standard in 50% cell medium. Separation was performed using a gradient of 100% A (0.1% FA in water) from 0 to 2 min, a linear ramp from 2 to 5 min going from 100% A to 75% A and 25% B (0.1% FA in ACN), holding at 75% A and 25% B from 5 to 6 min, a linear return from 5 to 10 min going from 75% A and 25% B to 100% A
Table 3.
Linearity, linear range and LOD for SP and metabolites in cell medium.
| Compound | Linear range(nM) in 50% cell medium | Linearity (R2) in 50% cell medium | LOD (nM) in50% cell medium |
|---|---|---|---|
| 1-4 | 50–1000 | 0.990 | 50 |
| 1-7 | 2–500 | 0.974 | 2 |
| 1-9 | 1–1000 | 0.990 | 1 |
| 1-11 | 1–500 | 0.983 | 1 |
| 2-11 | 1–500 | 0.985 | < 1 |
| 3-11 | 1–500 | 0.990 | < 1 |
| 5-11 | 1–500 | 0.979 | 1 |
| 6-11 | 1–500 | 0.989 | 1 |
SP metabolism with BBMECs
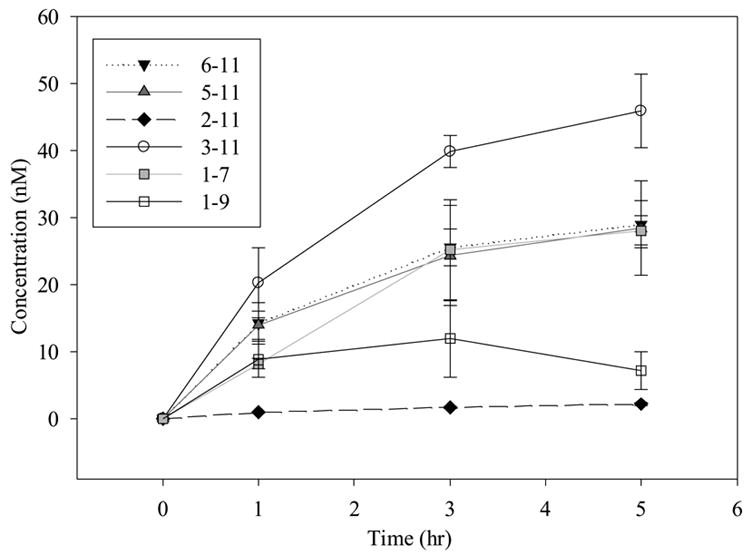
Prior to the investigation of the metabolism of SP using BBMECs, the use of buffer solution as a satisfactory medium for conducting the metabolism studies was confirmed. The stability of SP in the buffer solution without the presence of cells was determined by storing it in a polypropylene tube at 4° C for 48 h (Fig. 2a) and at 37° C for 24 h (Fig. 2b). The solutions showed no signs of degradation. Figure 2c shows a TIC chromatogram obtained after 5 h from a well containing cells but no SP. The only peak observed is that of the internal standard, which was added to the sample prior to injection. Figure 2d shows a TIC chromatogram at the 5-h time point from a well at 37° C with no cells but containing 10 μM SP. In this figure, a trace amount of degradation of SP was detected (3-11); however, this degradation was less than 0.1% of the SP peak and, therefore, was not likely to cause a problem with metabolite quantitation. No peaks were observed in the wells containing the buffer solution without any cells. Chromatograms obtained from the incubation of 10 μM SP with BBMECs for 5 h are shown in Fig. 3 (low intensity metabolites) and Fig. 4 (high intensity metabolites). The concentration-time profile for the formation of SP metabolites over the 5-h period is shown in Fig. 5. Substance P 3-11 and 1-7 were the major metabolites detected. Smaller amounts of SP 1-4, 1-7, 1-9, 2-11 and 5-11 were also found. After 5 h, 70% of SP was found to remain intact and unmetabolized in the buffer.
Figure 2.
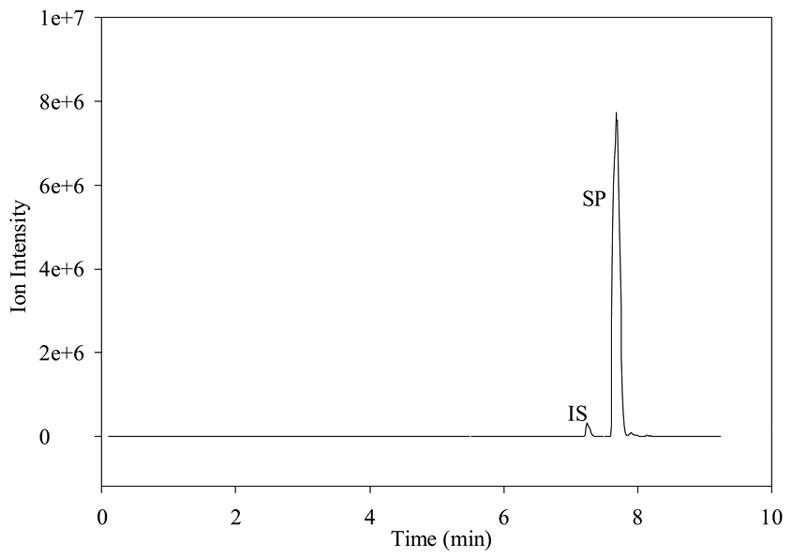
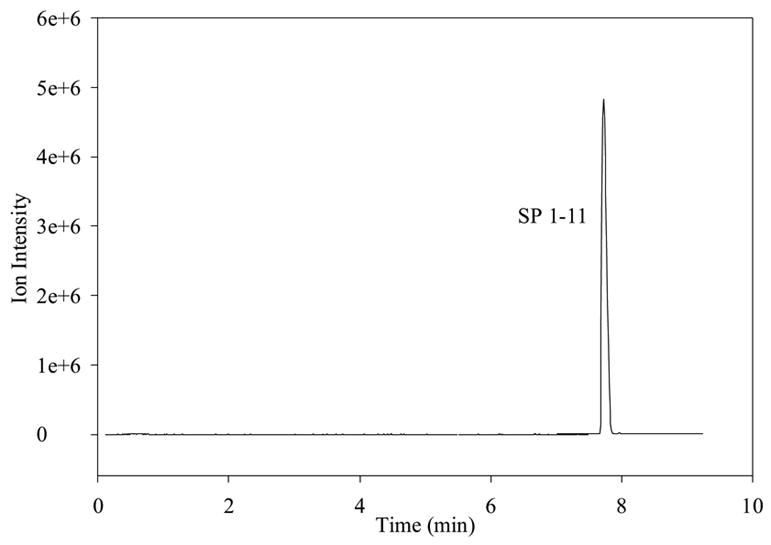
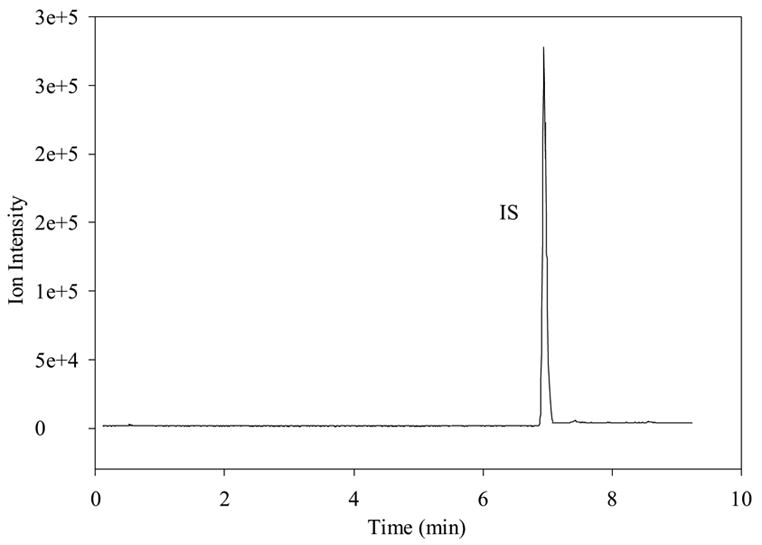
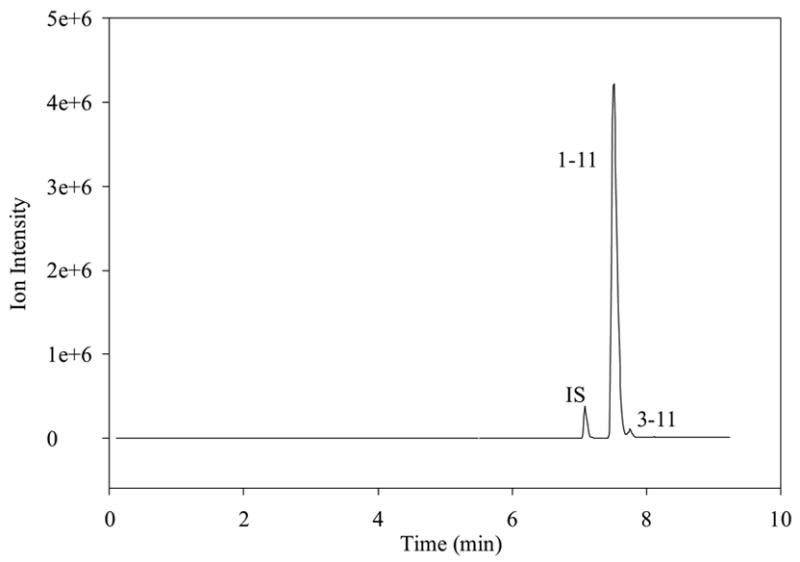
Figure 2a TIC of SP, metabolites, and internal standard showing the stability of 5 μM SP in cell experimental medium after 2 days at 4°C.
Figure 2b TIC showing stability of 5 μM SP in cell experimental medium after 24 hr at 37° C (no internal standard added to this sample).
Figure 2c TIC chromatogram of well with cells and blank bank buffer (no SP) after 5 hr.
Figure 2d TIC chromatogram of well with a solution of 10 μM SP with no cells after 5 hr.
Figure 3.
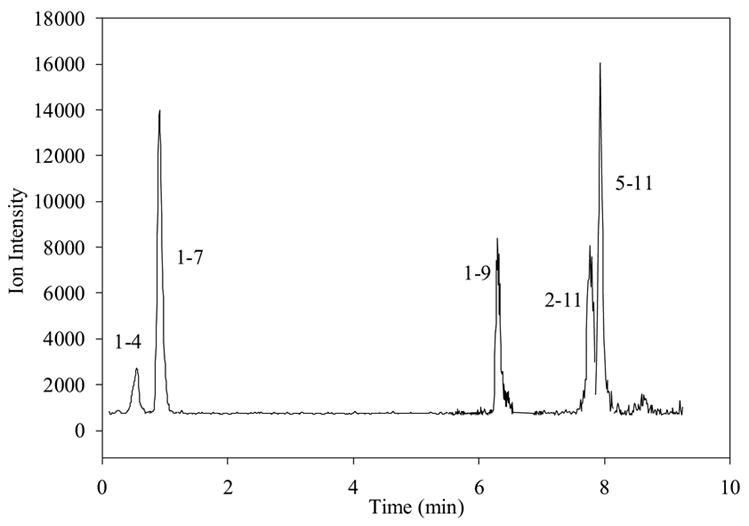
Chromatogram of low intensity metabolites after 10 μM SP has been incubated in wells with BBMECs for 5 hr; combined traces of 1-4, 1-7, 1-9, 2-11 and 5-11 are shown.
Figure 4.
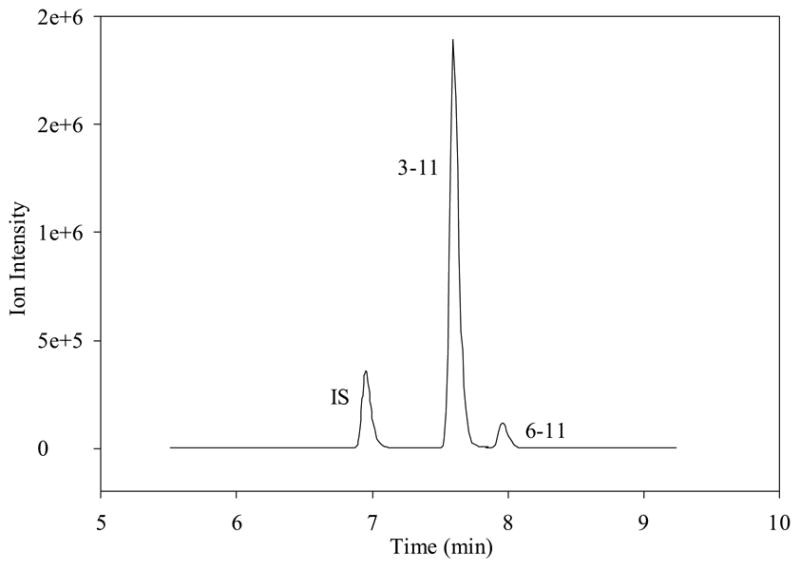
Chromatogram of high intensity metabolites after 10 μM SP has been incubated in wells with BBMECs for 5 hr; combined traces of internal standard, 3-11 and 6-11 are shown.
Figure 5.
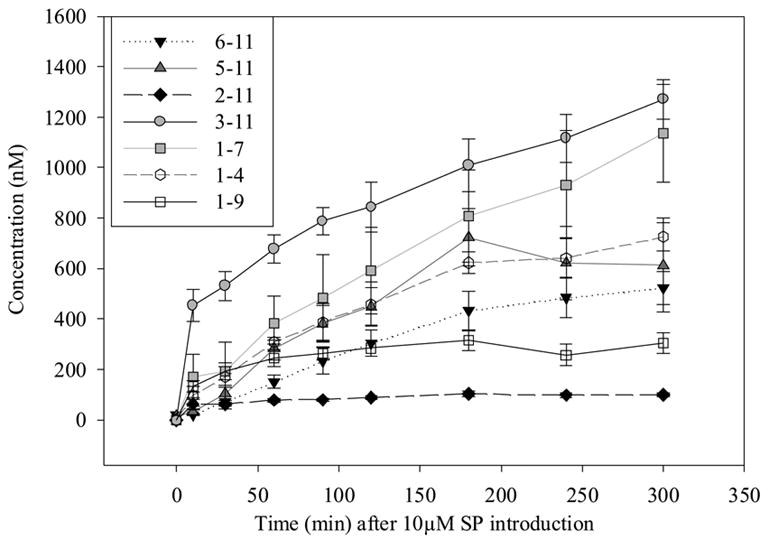
Time profile for metabolism of 10 μM SP in BBMECs (n = 4).
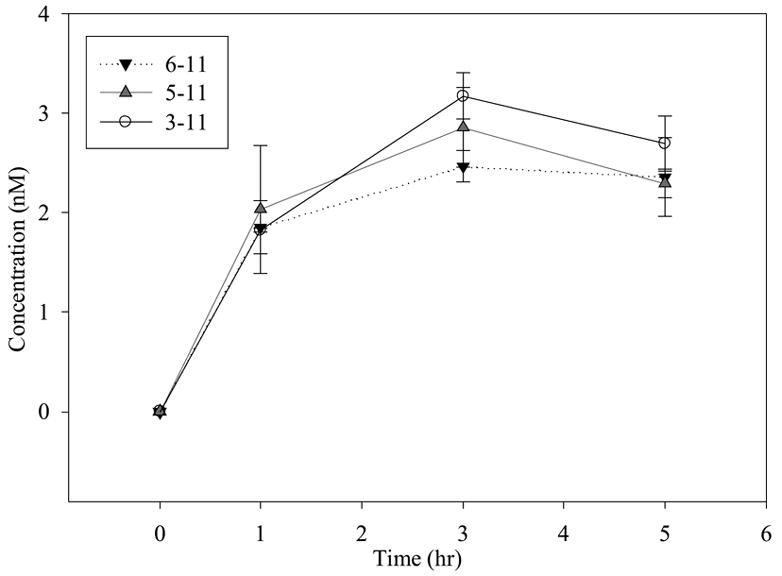
The metabolism of SP was also investigated at lower concentrations (1 μM and 100 nM) to determine if the metabolite profile changes with concentration. These concentrations were closer to those observed physiologically (Figs. 6 and 7). The major metabolite generated at high concentrations (1 μM and 100 nM) was SP 3-11; however, at 100 nM SP, the concentration of SP 3-11 generated was similar in magnitude to that of SP 5-11 and SP 6-11. Only three metabolites could be detected from the incubation at 100 nM, due to the sensitivity limit of the LC-MS/MS method. However at 1 μM SP, all the metabolites except 1-4 could be detected and quantified.
Figure 6.
Time profile for metabolism of 1 μM SP in BBMECs (n = 4).
Figure 7.
Time profile for metabolism of 100 nM SP in BBMECs (n = 4).
Metabolism comparison with the in vivo study and previous in vitro studies
The in vitro results described here indicate that SP 3-11 is the major metabolite formed at the BBB and that SP 2-11, while detected, occurs at a much lower concentration than any of the other metabolites monitored. These results were compared to previous in vivo metabolism studies [15–18]. In vivo brain microdialysis studies conducted in our lab using LC-MS/MS have shown that SP 1-7 and SP 3-11 were the major metabolites in the striatum. In addition, SP 2-11 was observed as a minor metabolite in these studies [17]. These results correlate very well with those observed in vitro using the BBMECs; SP 3-11 and SP 1-7, at 10 μM SP, were the major metabolites, and SP 2-11 was the metabolite that occurred in the lowest concentration.
Previous work in our lab on SP metabolism using BBMECs and CE-LIF also found SP 3-11 as the major metabolite [11]. Other groups have reported SP 5-11 and SP 6-11 [12] and SP 1-7 and SP 1-4 [16] as the major metabolites of SP in vivo. Our laboratory is the only group to report the appearance of SP 2-11 as a metabolite both in vivo with rats and in vitro with the BBMEC cell culture model. Because SP 2-11 occurs at very low concentrations (nM), a very sensitive analytical method was necessary for its detection.
Enzymatic cleavages and physiological importance of metabolites
Many of the metabolites of SP (Arg-Pro-Lys-Pro-Gln-Gln-Phe-Phe-Gly-Leu-Met-NH2) have been shown to exhibit important physiological effects. The major metabolite detected in the LC-MS/MS experiments, SP 3-11, results from the cleavage of SP by endopeptidase EC 3.4.21.26, a post-proline-cleaving enzyme [20, 21]. This metabolite has been shown to cause a SP-like caudally directed biting and scratching behavior when administered to mice [22]. The SP metabolite 1-7 is generated by endopeptidase 24.11 [23–25] and also by ACE [26, 27]. This metabolite has been shown to enhance dopamine release, to increase the concentration of dihydroxyphenylacetic acid in the brain [28], and to down-regulate NO synthesis [29].
Two of the metabolites that were observed in these studies (SP 1-4 and SP 5-11) are formed simultaneously by two different enzymes, endopeptidase EC 3.4.21.26 [18, 19] and SP-degrading endopeptidase [30]. Both enzymes cleave SP at the Gln5-Gln6 bond. Metabolite 1-4 has been shown to significantly increase dopamine outflow [31], while SP 5-11 increases the release of Asp, Glu, Asn, Gly, and taurine [32]. Matrix metalloproteinase-9 has been shown to cleave SP to produce SP 1-9 [33]. As with metabolite SP 1-4, SP 1-9 has been determined to significantly increase dopamine outflow [34].
The substance P metabolite 6-11 is formed by both SP-degrading endopeptidase [30] and matrix metalloproteinase-9 [33]. This metabolite was demonstrated to stimulate an eightfold increase in NK-1R phosphorylation [35], and has also been shown to decrease striatal dopamine release [36]. While the metabolite SP 2-11 has been shown to be produced by the hydrolysis of the Arg1-Pro2 bond with aminopeptidase P [37], there have been no reports to date of its biological activity.
The results presented here, when taken in conjunction with similar results obtained from in vivo studies, indicate that the BBB and other endothelial tissues constitute the major sites for the metabolism of SP released in the periphery and, thus, play an important role in the pharmacological and toxic effects of SP metabolites.
Conclusion
The results of SP metabolism at the BBB from this study correlate well with in vivo results obtained using LC-MS/MS analysis as well as with previous work using BBMECs. Two previously unreported metabolites, SP 5-11 and SP 6-11, were found to be produced and were detected at physiologically relevant concentrations. This study also demonstrates that BBMECs can potentially be used to investigate the metabolism of neuropeptides at the BBB without the need for complex in vivo experimental procedures.
Footnotes
Publisher's Disclaimer: This is a PDF file of an unedited manuscript that has been accepted for publication. As a service to our customers we are providing this early version of the manuscript. The manuscript will undergo copyediting, typesetting, and review of the resulting proof before it is published in its final citable form. Please note that during the production process errors may be discovered which could affect the content, and all legal disclaimers that apply to the journal pertain.
References
- 1.Griebel G. Pharmacol Ther. 1999;82:1–61. doi: 10.1016/s0163-7258(98)00041-2. [DOI] [PubMed] [Google Scholar]
- 2.Holmes A, Helig M, Rupniak NM, Steckler T, Griebel G. Trends Pharmacol Sci. 2003;24:580–588. doi: 10.1016/j.tips.2003.09.011. [DOI] [PubMed] [Google Scholar]
- 3.Chappa AK, Desino KE, Lunte SM, Audus KL. In: The Handbook of Biologically Active Peptides. Kastin AJ, editor. Elsevier; 2006. in press. [Google Scholar]
- 4.Somogyvari-Vigh A, Kastin AJ, Liao J, Zadina JE, Pan W. Exp Brain Res. 2004;156:224–230. doi: 10.1007/s00221-003-1774-0. [DOI] [PMC free article] [PubMed] [Google Scholar]
- 5.Wu D. NeuroRx. 2005;2:120–128. doi: 10.1602/neurorx.2.1.120. [DOI] [PMC free article] [PubMed] [Google Scholar]
- 6.Mantyh PW, Rogers SD, Honore P, Allen BJ, Ghilardi JR, Li J, Daughters RS, Lappi DA, Wiley RG, Simone DA. Science. 1997;278:275–279. doi: 10.1126/science.278.5336.275. [DOI] [PubMed] [Google Scholar]
- 7.Miller DW, Audus KL, Borchardt RT. J Tiss Cult Meth. 1992;14:217–224. [Google Scholar]
- 8.Baranczyk-Kuzma A, Audus KL. J Cereb Blood Flow Metab. 1987;7:801–805. doi: 10.1038/jcbfm.1987.137. [DOI] [PubMed] [Google Scholar]
- 9.Thompson SE, Audus KL. Peptides. 1994;15:109–116. doi: 10.1016/0196-9781(94)90178-3. [DOI] [PubMed] [Google Scholar]
- 10.Diz DI, Jessup JA, Westwood BM, Bosch SM, Vinsant S, Gallagher PE, Averill DB. Clin Exp Pharmacol Physiol. 2002;29:473–482. doi: 10.1046/j.1440-1681.2002.03659.x. [DOI] [PubMed] [Google Scholar]
- 11.Freed AL, Audus KL, Lunte SM. Electrophoresis. 2001;22:3778–3784. doi: 10.1002/1522-2683(200109)22:17<3778::AID-ELPS3778>3.0.CO;2-E. [DOI] [PubMed] [Google Scholar]
- 12.Andren PE, Caprioli RM. J Mass Spectrom. 1995;30:817–824. [Google Scholar]
- 13.Audus KL, Ng L, Wang W, Borchardt RT. In: Models for Assessing Drug Absorption and Metabolism. Borchardt RT, Smith PL, Wilson G, editors. Plenum Press; NY: 1996. [Google Scholar]
- 14.Griffiths WJ, Jonsson AP, Liu S, Rai DK, Wang Y. Biochem J. 2001;355:545–61. doi: 10.1042/bj3550545. [DOI] [PMC free article] [PubMed] [Google Scholar]
- 15.Kostel KL, Lunte SM. J Chromatogr B Biomed Sci Appl. 1997;695:27–38. doi: 10.1016/s0378-4347(97)00173-4. [DOI] [PubMed] [Google Scholar]
- 16.Whelpton RA, Michael-Titus T, Stephens SM, Yau KW, Fengas D. J Chromatogr B Biomed Sci Appl. 1998;716:95–106. doi: 10.1016/s0378-4347(98)00334-x. [DOI] [PubMed] [Google Scholar]
- 17.Freed AL, Cooper JD, Davies MI, Lunte SM. J Neurosci Methods. 2001;109:23–29. doi: 10.1016/s0165-0270(01)00397-1. [DOI] [PubMed] [Google Scholar]
- 18.Michael-Titus AT, Fernandes K, Setty H, R Whelpton. Neuroscience. 2002;110:277–286. doi: 10.1016/s0306-4522(01)00530-9. [DOI] [PubMed] [Google Scholar]
- 19.Cooper JD. Ph.D. Dissertation. The University of Kansas; [Google Scholar]
- 20.Blumberg S, Teichberg VI, Charli JL, Hersh LB, McKelvy JF. Brain Research. 1980;192:477–486. doi: 10.1016/0006-8993(80)90898-7. [DOI] [PubMed] [Google Scholar]
- 21.Nyberg F, Le Greves P, Sundqvist C, Terenius L. Biochem Biophys Res Commun. 1984;125:244–250. doi: 10.1016/s0006-291x(84)80360-5. [DOI] [PubMed] [Google Scholar]
- 22.Igwe OJ, Sun X, Larson AA. Neuroscience. 1990;36:535–542. doi: 10.1016/0306-4522(90)90003-3. [DOI] [PubMed] [Google Scholar]
- 23.Horsthemke B, Schulz M, Bauer K. Biochem Biophys Res Commun. 1984;125:728–733. doi: 10.1016/0006-291x(84)90599-0. [DOI] [PubMed] [Google Scholar]
- 24.Matsas R, Kenny AJ, Turner AJ. Biochem J. 1984;223:433–440. doi: 10.1042/bj2230433. [DOI] [PMC free article] [PubMed] [Google Scholar]
- 25.Hall ME, Miley F, Stewart JM. Peptides. 1989;10:895–901. doi: 10.1016/0196-9781(89)90132-0. [DOI] [PubMed] [Google Scholar]
- 26.Yokosawa H, Endo S, Ogura Y, Ishii S. Biochem Biophys Res Commun. 1983;116:735–742. doi: 10.1016/0006-291x(83)90586-7. [DOI] [PubMed] [Google Scholar]
- 27.Thiele EA, Strittmatter SM, Snyder SH. Biochem Biophys Res Commun. 1985;128:317–324. doi: 10.1016/0006-291x(85)91681-x. [DOI] [PubMed] [Google Scholar]
- 28.Zhou Q, Nyberg F. Neurosci Lett. 2002;320:117–120. doi: 10.1016/s0304-3940(01)02564-2. [DOI] [PubMed] [Google Scholar]
- 29.Kovacs KJ, Cai Y, Larson AA. Eur J Neurosci. 2001;14:577–584. doi: 10.1046/j.0953-816x.2001.01675.x. [DOI] [PubMed] [Google Scholar]
- 30.Endo S, Yokosawa H, Ishii S. J Biochem (Tokyo) 1988;104:999–1006. doi: 10.1093/oxfordjournals.jbchem.a122599. [DOI] [PubMed] [Google Scholar]
- 31.Khan S, Whelpton R, Michael-Titus AT. Neurosci Lett. 1996;205:33–36. doi: 10.1016/0304-3940(96)12363-6. [DOI] [PubMed] [Google Scholar]
- 32.Skilling SR, Smullin DH, Beitz AJ, Larson AA. J Neurosci. 1990;10:1309–1318. doi: 10.1523/JNEUROSCI.10-04-01309.1990. [DOI] [PMC free article] [PubMed] [Google Scholar]
- 33.Backstrom JR, Toekes ZA. J Neurochem. 1995;64:1312–1318. doi: 10.1046/j.1471-4159.1995.64031312.x. [DOI] [PubMed] [Google Scholar]
- 34.Khan S, Sandhu J, Whelpton R, Michael-Titus AT. Neuropeptides. 1998;32(6):519–526. doi: 10.1016/s0143-4179(98)90080-4. [DOI] [PubMed] [Google Scholar]
- 35.Vigna SR. Neuropeptides. 2001;35:24–31. doi: 10.1054/npep.2000.0840. [DOI] [PubMed] [Google Scholar]
- 36.Reid MS, Herrera-Marschitz M, Terenius L, Ungerstedt U. Brain Res. 1990;526:228–234. doi: 10.1016/0006-8993(90)91226-7. [DOI] [PubMed] [Google Scholar]
- 37.Harbeck HT, Mentlein R. Eur J Biochem. 1991;198:451–458. doi: 10.1111/j.1432-1033.1991.tb16035.x. [DOI] [PubMed] [Google Scholar]