

Abstract
Organophosphates affect mammalian brain development through a variety of mechanisms beyond their shared property of cholinesterase inhibition. We used microarrays to characterize similarities and differences in transcriptional responses to chlorpyrifos and diazinon, assessing defined gene groupings for the pathways known to be associated with the mechanisms and/or outcomes of chlorpyrifos-induced developmental neurotoxicity. We exposed neonatal rats to daily doses of chlorpyrifos (1 mg/kg) or diazinon (1 or 2 mg/kg) on postnatal days 1-4 and evaluated gene expression profiles in brainstem and forebrain on day 5; these doses produce little or no cholinesterase inhibition. We evaluated pathways for general neural cell development, cell signaling, cytotoxicity and neurotransmitter systems, and identified significant differences for >60% of 252 genes. Chlorpyrifos elicited major transcriptional changes in genes involved in neural cell growth, development of glia and myelin, transcriptional factors involved in neural cell differentiation, cAMP-related cell signaling, apoptosis, oxidative stress, excitotoxicity, and development of neurotransmitter synthesis, storage and receptors for acetylcholine, serotonin, norepinephrine and dopamine. Diazinon had similar effects on many of the same processes but also showed major differences from chlorpyrifos. Our results buttress the idea that different organophosphates target multiple pathways involved in neural cell development but also that they deviate in key aspects that may contribute to disparate neurodevelopmental outcomes. Equally important, these pathways are compromised at exposures that are unrelated to biologically significant cholinesterase inhibition and its associated signs of systemic toxicity. The approach used here demonstrates how planned comparisons with microarrays can be used to screen for developmental neurotoxicity.
Keywords: Brain development, Chlorpyrifos, Diazinon, Microarrays, Neurotoxicity, Organophosphate insecticides
INTRODUCTION
Despite their widespread use [17], organophosphate insecticides are a major concern for human health because of their propensity to damage the developing brain at exposures below the threshold for signs of systemic intoxication [55,56,62,72,73,86,87,108]. Although it was originally thought that these agents act solely through inhibition of cholinesterase and consequent cholinergic hyperstimulation, it is now evident that there are multiple mechanisms that contribute to neurodevelopmental abnormalities [10,17,42,73,74,77,112]. Accordingly, whereas all the organophosphates share cholinesterase as a target, they are likely to differ to a greater or lesser extent in their effects unrelated to that particular mechanism. Indeed, chlorpyrifos (CPF), the best-studied agent, affects brain development through diverse targets such as oxidative stress, cell signaling cascades, expression and function of nuclear transcription factors, and neuronal-glial cell interactions [42,73,86,87,89], mechanisms that may be shared in varying degrees by other organophosphates [1,67,73,75,86,87,91,110].
We recently compared the thresholds for cholinesterase inhibition, systemic toxicity and several developmental neurotoxicity endpoints for CPF, diazinon (DZN) and parathion [50,91,97] and found distinct disparities in both the sensitivity of various pathways involved in cell differentiation as well as in outcomes related to abnormal brain development. These findings point to the need to screen the various organophosphates for similarities and differences in their targeting of the key pathways that contribute to their ultimate neurodevelopmental consequences. Profiling of gene transcription responses in these pathways represents a potentially valuable and informative approach to identification of common and disparate mechanisms of neural damage. To date, this strategy has been applied with only a handful of genes at a time and yet has yielded some promising results, including demonstrations of effects on the expression of factors involved in neural growth, glial cell development, myelination, apoptosis, muscarinic acetylcholine receptors (mAChRs) and acetylcholinesterase splice variants that typify neural damage and repair [13,27,50]. With gene microarray techniques, cell culture systems of tumor lines expressing neurohumoral characteristics further indicate a broader range of potential target pathways [61,63]. In the current study, we cast a broader net for in vivo effects of organophosphates on brain development by using microarrays to conduct planned comparisons of families of genes based on the known pathway targets of CPF, both for mechanism of brain cell damage and the types of neurons ultimately affected [42,87-89]. In essence, we used CPF as a method of validation of the microarray results because the phenotypic outcomes of CPF treatment are already established. We then compared the results for CPF with those for DZN, for which far less is known, in order to emphasize points of similarity and difference that may enable the prediction of disparities in the ultimate neurodevelopmental outcomes of these two organophosphates. We concentrated on doses that evoke no cholinesterase inhibition or barely-detectable inhibition, too low to elicit any signs of cholinergic hyperstimulation [97,100]. For our evaluations of gene transcription, we chose specific pathways involved in: (a) neural cell growth and neurite formation; (b) transcription factors and cell signaling cascades that mediate neural cell differentiation; (c) cytotoxic events including oxidative stress, apoptosis and expression of ionotropic glutamate receptors (iGluRs); and (d) neurotransmitter pathways known to be especially targeted by CPF. The latter include acetylcholine (ACh) and the monoamines, serotonin (5HT), dopamine and norepinephrine; in addition, we compared effects on metabotropic glutamate receptors (mGluRs), which are not involved in excitotoxicity, to those on the iGluRs. Our assessments were conducted in two brain regions that differ both in anatomical attributes as well as in maturational timetables [81]. The brainstem develops earliest of the regions and contains many of the cell bodies for the neural pathways targeted by CPF, whereas the forebrain develops later and contains a high concentration of the nerve terminal zones to which the cells originating in the brainstem project.
METHODS
Animal treatments
All experiments were carried out in accordance with federal and state guidelines and with prior approval of the Duke University Institutional Animal Care and Use Committee; all animals were treated humanely and with due care for alleviation of distress. Timed-pregnant Sprague–Dawley rats (Charles River, Raleigh, NC) were housed in breeding cages, with a 12 h light–dark cycle and free access to food and water. On the day of birth, all pups were randomized and redistributed to the dams with a litter size of 9-10 to maintain a standard nutritional status. CPF and DZN (both from Chem Service, West Chester, PA) were dissolved in dimethylsulfoxide to provide consistent absorption [109] and were injected subcutaneously in a volume of 1 ml/kg once daily on postnatal days 1-4; control animals received equivalent injections of the dimethylsulfoxide vehicle. For both agents, we utilized doses below the threshold for growth retardation and systemic toxicity [16,91,109]: 1 mg/kg for CPF and 1 or 2 mg/kg for DZN. This CPF treatment and the higher dose of DZN produce neurotoxicity in developing rat brain while eliciting less than 20% cholinesterase inhibition, well below the 70% threshold necessary for symptoms of cholinergic hyperstimulation [20], whereas the lower dose of DZN produces no measurable inhibition in male neonates [86,87,97,100,109]. These treatments thus resemble the nonsymptomatic exposures reported in pregnant women [32] and are within the range of expected fetal and childhood exposures after routine home application or in agricultural communities [43,70]. On postnatal day 5 (24 hr after the last dose), one male pup was selected from each of five litters in each treatment group. Animals were decapitated, the cerebellum was removed and the brainstem and forebrain were separated by a cut made rostral to the thalamus. Tissues were weighed and flash-frozen in liquid nitrogen and maintained at -45° C until analyzed. Each tissue contributed a single determination; that is, tissues were not pooled but rather were analyzed individually, so that the number of determinations in each case represents the number of animals in each treatment group.
Microarray determinations
Tissues were thawed and total RNA was isolated using the Aurum total RNA Fatty and Fibrous Tissue Kit (Bio-Rad Laboratories, Hercules, CA), with RNA quality verified using the RNA LabChip Kit and the Agilent 2100 Bioanalyzer (Agilent Technologies, Palo Alto, CA). An aliquot of each sample used in the study was withdrawn and combined to make a reference RNA preparation to be included on each array. RNA amplification was carried out using a commercial kit (Low RNA Input Fluorescent Linear Amplification Kit; Agilent). Each RNA sample was annealed with a primer containing a polydT and a T7 polymerase promoter. Reverse transcriptase produced a first and second strand cDNA. T7 RNA polymerase then created cRNA from the double stranded cDNA by incorporating cyanine-3 (for the reference RNA) or cyanine-5 (for the sample RNA) labeled CTP, and the quality of the labeled cRNA was again verified and the absolute concentration was measured spectrophotometrically. For each pair of reference cRNA and experimental cRNA hybridized to an array, equal amounts of cRNA (0.75 μg) were hybridized using a commercial kit (In situHybridization Kit-Plus; Agilent). Hybridization was performed at 60°C for 17 hr with Agilent Whole Rat Genome Arrays (G4131A). The arrays were washed with Agilent’s SSPE Wash Protocol using a solution of 6× SSPE, 0.005% N-lauroylsarcosine, a solution of 0.06× SSPE, 0.005% N-lauroylsarcosine, and Agilent’s Stabilization and Drying Solution. The arrays were scanned on an Agilent G2565BA Microarray Scanner and data from the scans were compiled with Agilent Feature Extraction Software 8.1. The steps from RNA amplification through extraction of the scanner output data were performed by a private contractor (Cogenics, Research Triangle Park, NC).
Array normalizations and error detection were carried out using Silicon Genetics’ GeneSpring GX Version 7.2 (Agilent), via the Enhanced Agilent Feature Extraction Import Preprocessor. First, values of poor quality intensity and low dependability were removed using a “filter on flags” feature, where standardized software algorithms determined which spots were “present”, “marginal”, or “absent;” spots were considered “present” only where the output was uniform, not saturated and significant above background, whereas spots that satisfied the main requirements but were outliers relative to the typical values for the other genes were considered “marginal.” Only the values that were considered to be present or marginal were retained for further analysis.
Data were normalized in three steps, using the algorithms supplied with the Feature Extraction software. The first step divides the signal in the Cy5 channel (sample RNA) by that in the Cy3 channel (reference RNA), to give the measured ratio for each gene in the array. The second normalization adjusts the total signal of each chip to a standard value (“normalize to 50th percentile”) determined by the median of the all the reliable values on the chip; this renders the output of each chip comparable to that of every other chip in the study. The third normalization step is applied to each gene across all the arrays in the study (“normalize to median”): the median of all the values obtained for a given gene is calculated and used as the normalization standard for that gene, so that, regardless of absolute differences in the expression of the various genes, they are placed on the same scale for comparison.
After normalization, one final quality-control filter was applied, where genes showing excessive biologic variability were discarded; the criterion for retention was that more than half of the 8 treatment × region groupings had to have coefficients of variation <30%.
In many cases, the arrays contain multiple probes for the same gene and/or replicates of the same probe in different locations on the chip, and these were used to verify the reliability of values and the validity of the measures on the chip. In these cases, to avoid artificially inflating the number of positive findings, we limited each gene to a single set of values, selecting those obtained for the probe showing the smallest intragroup (treatment, region) variance; the other values for that gene were used only to corroborate direction and magnitude of change. Through these procedures, we identified five defective arrays with sequential production numbers, for which one corner of the array showed a nonuniform overall difference in brightness that affected the readings in that region of the chip. The affected samples were reevaluated on replacement arrays that did not repeat the problem. Our experiment design ensured that the replacement readings were distributed among all the treatment groups, since our sample sequence was control, CPF, DZN 1 mg/kg, DZN 2 mg/kg; thus we did not run the risk of generating a spurious apparent treatment effect from differences among arrays. The defective arrays did allow us to perform an additional quality control evaluation, since most of the spots on the defective arrays were in the portion that did not show the defect. Comparing the values on the replacement arrays to the valid portions of the defective arrays produced a close correspondence of values (correlation coefficient = 0.98).
In compiling our results, readings from “predicted” sequences (i.e. derived by an algorithm) were used only where an alternative probe was not available for that gene. Finally, spots that were based on partial sequence homologies but not definitively identified (designated as “-like”) were not included.
Statistical procedures
Because of the requirement to normalize the data across arrays and within each gene, the absolute values for a given gene are meaningless; only the relative differences between regions and treatments can be compared. Accordingly, results for the regional differences in gene expression in control rats are presented as means and standard errors of the normalized ratios for each gene, but the effects of the treatments are given as the percentage change from control to allow for visual comparison of the relative changes evoked for each gene, regardless of its control ratio. However, statistical comparisons were based on the actual ratios (log-transformed, since the data are in the form of ratios) rather than the percent change.
Our design involved a large number of planned comparisons, so it was important to consider the false positive rate (FPR) and to protect against type 1 errors from repeated testing of the same data base. Accordingly, before subdividing the data into families of genes related to specific processes, or looking at effects on individual genes, we performed a global ANOVA incorporating all treatments, both regions and all genes in a single comparison. Lower-order ANOVAs were then carried out as permitted by the interactions of treatment × region and treatment × gene that justified subdivisions of the data set. Finally, differences for individual treatments for a specified gene in a single brain region were evaluated with Fisher’s Protected Least Significant Difference; however, where there was no treatment × region interaction for a given gene, only the main treatment effect was reported without subtesting of effects in individual regions. For ANOVA results, main effects were considered significant at p < 0.05 (two-tailed, since we were interested in both increases and decreases in gene expression); for treatment × region interactions at p < 0.1, we also examined whether lower-order main effects were detectable after subdivision into the separate regions [99]. Where p-values were obtained that were < 0.0001, we reported them only to that number.
In addition to these parametric tests of the direction and magnitude of changes in gene expression, we evaluated the incidence of significant differences as compared to the FPR, using Fisher’s Exact Test. Again, this was evaluated on the global data set in an initial comparison and then verified each time a subdivision of the data was created. For these tests, a one-tailed criterion of p < 0.05 was applied, since only an increase above the FPR would be predicted; finding a significant decrease in the incidence of detected differences relative to the FPR would be biologically implausible and statistically meaningless. In creating the subdivisions of genes related to the putative targets for the developmental neurotoxicity of CPF and DZN, we included all genes encoding proteins of a related class, whether or not their products have actually been examined for specific outcomes: e.g. all the adrenergic and cholinergic receptor genes, all the genes for subtypes of adenylyl cyclase (AC), phosphodiesterase (PDE), protein kinase A (PKA), protein kinase C (PKC), etc. If anything, this would increase the number of “negative” findings, making statistical significance vs. the FPR harder to achieve. Genes of a given family that are not reported either do not have a definitively-identified probe on the chip or the values did not pass the quality control filters.
RESULTS
Our planned comparisons approach included 252 of the genes that passed quality control filters. The global ANOVA indicated significant treatment effects that were restricted to specific genes and regions: p < 0.0001 for interactions of treatment × gene and treatment × region × gene, with both regions individually showing significant (p < 0.0001) interactions of treatment × gene. This global test justified the examination of values for individual genes in each region. In addition, looking at each gene across the two regions, we found significant treatment effects for 151 out of the 252 genes evaluated (60%) as compared to a prediction of only 13 genes (5%) based on the FPR (p < 0.0001). This relationship held true for each of the mechanistically-based subdivisions described below.
General neural cell development
In control neonatal rats, the genes associated with neural cell growth and extension of neurites showed a regional hierarchy consistent with the earlier maturation of the brainstem as compared to the forebrain. On postnatal day 5, an age where the forebrain is undergoing rapid general growth, gap43 expression was significantly higher than in the brainstem, whereas the opposite was seen for genes encoding the neurofilament proteins (nfl, nef3, nefh) associated with axonal and dendritic outgrowth, events that are characteristic of a later stage of differentiation (Table 1). Although there were only a few regional differences in the genes for glial cell development (Table 2), genes associated with myelination again showed consistently higher expression in the brainstem, as expected from the differing timetables for oligodendrocyte development in the two regions (Table 3).
TABLE 1. Gene Expression Profiles in Control Brain Regions: Neural Growth-Related.
| Protein encoded | Gene | Genbank | Brainstem | Forebrain |
|---|---|---|---|---|
| growth-associated protein 43 | gap43 | NM017195 | 0.84 ± 0.03 | 1.02 ± 0.04* |
| neurofilament light polypeptide | nfl | NM031783 | 1.67 ± 0.09* | 0.65 ± 0.05 |
| neurofilament 3 medium polypeptide | nef3 | NM017029 | 1.34 ± 0.02* | 0.60 ± 0.02 |
| neurofilament heavy polypeptide | nefh | NM012607 | 2.26 ± 0.18* | 0.44 ± 0.02 |
Significantly higher than in the other region.
TABLE 2. Gene Expression Profiles in Control Brain Regions: Glia-Related.
| Protein encoded | Gene | Genbank | Brainstem | Forebrain |
|---|---|---|---|---|
| glial fibrillary acidic protein | gfap | NM017009 | 1.06 ± 0.01 | 1.13 ± 0.10 |
| glial-derived neurotrophic factor | gdnf | NM019139 | 0.90 ± 0.05 | 0.98 ± 0.03 |
| glial-derived neurotrophic factor α1 receptor | gfra1 | NM012959 | 1.09 ± 0.07* | 0.87 ± 0.04 |
| glial-derived neurotrophic factor α2 receptor | gfra2 | NM012750 | 1.48 ± 0.04* | 0.54 ± 0.01 |
| glial-derived neurotrophic factor α3 receptor | gfra3 | NM053398 | 1.02 ± 0.03 | 1.04 ± 0.03 |
| glial-derived neurotrophic factor α4 receptor | gfra4 | NM023967 | 1.05 ± 0.06 | 1.03 ± 0.08 |
| glial maturation factor β | gmfb | NM031032 | 0.98 ± 0.01 | 1.21 ± 0.02* |
| glial maturation factor γ | gmfg | BE113966 | 0.98 ± 0.02 | 0.99 ± 0.02 |
| neuron-glia CAM-related cell adhesion molecule | nrcam | NM013150 | 1.10 ± 0.05 | 1.01 ± 0.04 |
| glial high-affinity glutamate transporter, member 2 | slc1a2 | NM017215 | 1.13 ± 0.05 | 1.08 ± 0.07 |
| glial high-affinity glutamate transporter, member 3 | slc1a3 | NM019225 | 1.02 ± 0.02 | 1.04 ± 0.02 |
| astroglial high-affinity cationic amino acid transporter, member 2 | slc7a2 | U53927 | 0.91 ± 0.07 | 1.15 ± 0.10 |
Significantly higher than in the other region.
TABLE 3. Gene Expression Profiles in Control Brain Regions: Myelination-Related.
| Protein encoded | Gene | Genbank | Brainstem | Forebrain |
|---|---|---|---|---|
| myelin-associated glycoprotein | mag | NM017190 | 1.60 ± 0.04* | 0.61 ± 0.06 |
| myelin basic protein | mbp | NM017026 | 1.41 ± 0.06* | 0.66 ± 0.02 |
| myelin-associated oligodendrocytic basic protein | mobp | NM012720 | 1.22 ± 0.08* | 0.97 ± 0.04 |
| myelin oligodendrocyte protein | mog | NM022668 | 1.03 ± 0.02 | 0.99 ± 0.01 |
| myelin protein zero | mpz | NM017027 | 1.51 ± 0.07* | 0.88 ± 0.05 |
| myelin basic protein expression factor 2, repressor | myef2 | XM342510 | 0.96 ± 0.02 | 0.96 ± 0.07 |
| myelin transcription factor 1 | myt1 | XM342605 | 1.13 ± 0.10* | 0.81 ± 0.05 |
| oligodendrocyte-myelin glycoprotein | omg | NM001005898 | 1.24 ± 0.06* | 0.80 ± 0.02 |
Significantly higher than in the other region.
Turning to the effects of CPF and DZN on expression of these gene families, we found 15 genes with significant differences (main treatment effect or treatment × region interaction) out of a total of 24 genes (63%), compared to a calculated FPR of only 1 gene (p < 0.0001). Multivariate ANOVA (all treatments, all genes, both regions) indicated a significant main treatment effect (p < 0.0003) and an interaction of treatment × gene (p < 0.0009). For CPF (Fig. 1A), gap43 was significantly elevated in the brainstem and nefh tended to be reduced by the same proportion, although the effect did not pass the threshold for statistical significance. For the lower dose of DZN (Fig. 1B), the same induction of brainstem gap43 was obtained, as well as significant increases in nef3. Raising the DZN dose to 2 mg/kg (Fig. 1C) produced further increments in brainstem gap43, a significant increase in nef3 and a significant decrease in brainstem nefh; the magnitude of the latter effect was comparable to, and not statistically distinguishable from the nonsignificant decrease in nefh seen with CPF.
Fig. 1.
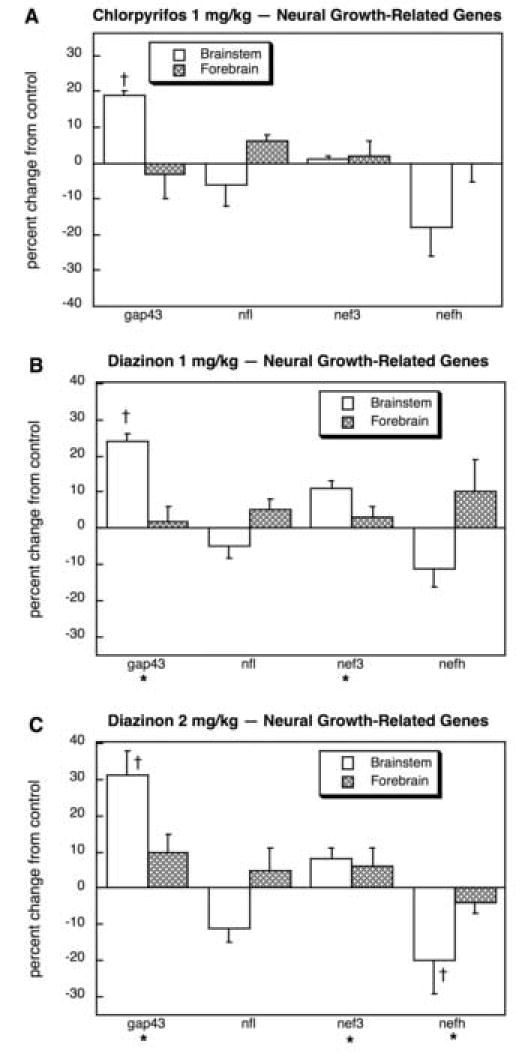
Effects of 1 mg/kg/day CPF (A), 1 mg/kg/day of DZN (B), or 2 mg/kg/day of DZN (C) on expression of neural growth-related genes, presented as the percentage change from control values (Table 1). Asterisks shown below each gene denote a significant main treatment effect. Daggers denote genes for which a treatment × region interaction was detected and show the individual regions for which treatment effects were present. Multivariate ANOVA (all treatments, all genes, both regions) indicates a significant treatment × gene interaction (p < 0.03).
Across all the genes related to glial development, CPF evoked a general decrement in expression (main treatment effect, p < 0.002) superimposed on effects targeted toward specific genes and regions (Fig. 2A). There were substantial decrements for gfap in both regions and for gfra4 in the brainstem, as well as smaller reductions in nrcam and slc1a2, and for gmfb in the forebrain. Only gfra2 showed a statistically significant increase and the magnitude of that effect was small (<10%). For 1 mg/kg of DZN (Fig. 2B), the overall effects were far less notable (no significant main treatment effect) and gfap was unaffected. However, we still obtained the significant decreases in slc1a2 and forebrain gmfb, as well as a small decrement in slc1a3. Raising the DZN dose to 2 mg/kg (Fig. 2C) produced a pattern quite similar to that seen with CPF: overall reductions in gene expression (main treatment effect, p < 0.004), with significant decrements in gfap and slc1a2, and in forebrain gmfb.
Fig. 2.
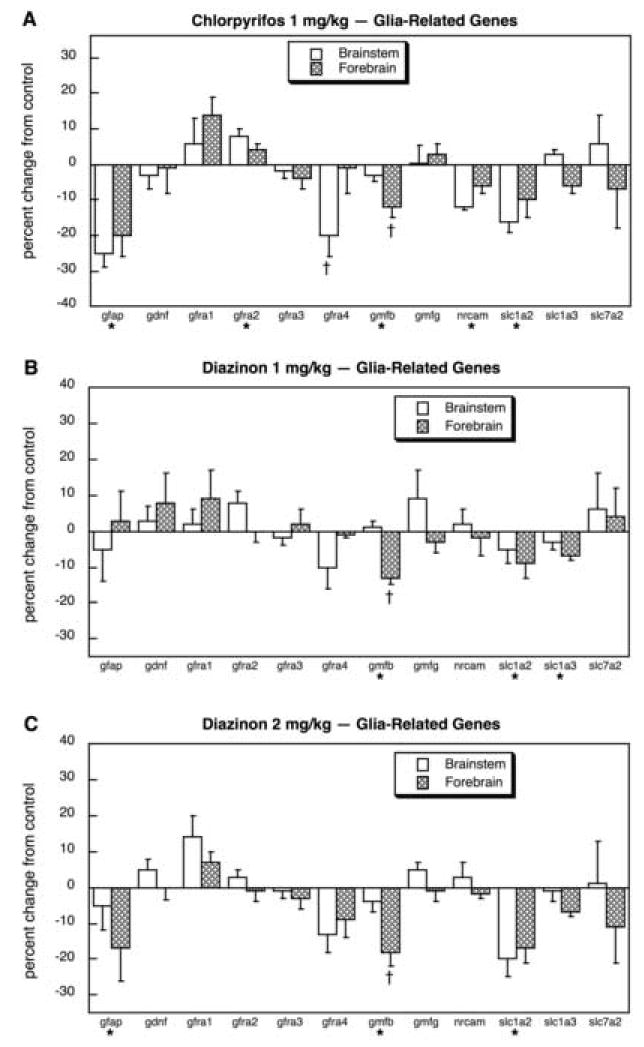
Effects of 1 mg/kg/day CPF (A), 1 mg/kg/day of DZN (B), or 2 mg/kg/day of DZN (C) on expression of glia-related genes, presented as the percentage change from control values (Table 2). Asterisks shown below each gene denote a significant main treatment effect. Daggers denote genes for which a treatment × region interaction was detected and show the individual regions for which treatment effects were present. Multivariate ANOVA (all treatments, all genes, both regions) indicates a significant main treatment effect (p < 0.0006) and a treatment × gene interaction (p < 0.02).
For myelin-related genes, CPF again evoked an overall decrease in gene expression (main treatment effect, p < 0.04) as well as regionally-selective effects on specific genes (Fig. 3A). The largest effects were on mobp and brainstem mpz, although a small, significant decrease was also seen for forebrain mog; although there were comparable decreases in mag, these did not achieve statistical significance because of higher variability, but the direction and magnitude of change are consistent with earlier findings [13]. In contrast to the effects of CPF, neither treatment with 1 mg/kg DZN (Fig. 3B) or 2 mg/kg DZN (Fig. 3C) had an overall effect on myelin gene expression, nor was there a significant reduction in mobp; also the decrease in brainstem mpz expression was notably smaller than was seen with CPF. On the other hand DZN treatment evoked increases in myef2 and myt1 expression in the forebrain, effects that were not seen with CPF; at the lower dose of DZN, these effects were discernible but did not achieve statistical significance (Fig. 3B) whereas they were much more robust at the higher dose and reached significance (Fig. 3C).
Fig. 3.
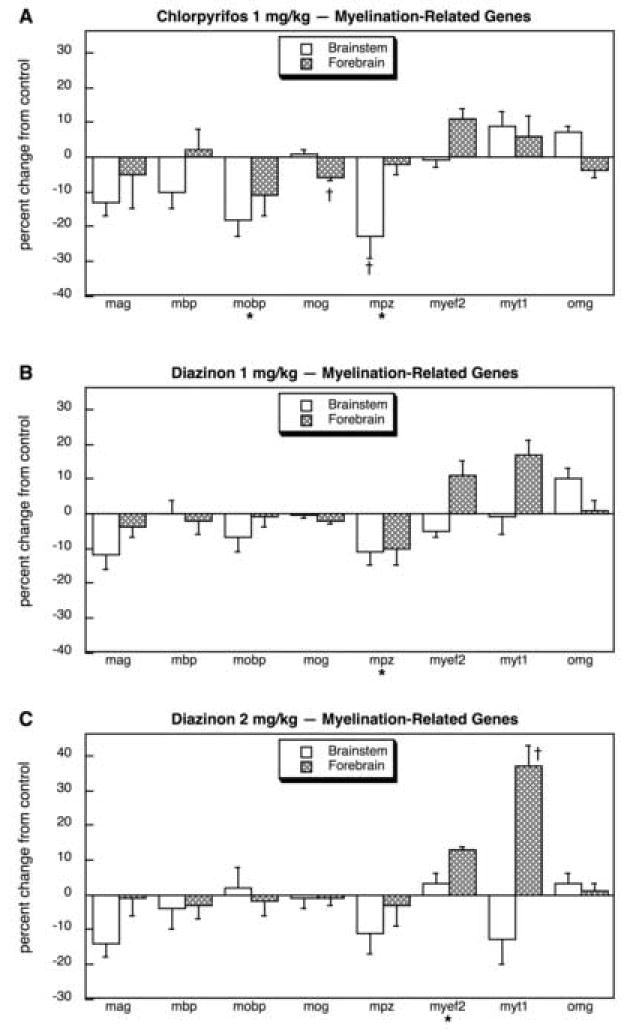
Effects of 1 mg/kg/day CPF (A), 1 mg/kg/day of DZN (B), or 2 mg/kg/day of DZN (C) on expression of myelination-related genes, presented as the percentage change from control values (Table 3). Asterisks shown below each gene denote a significant main treatment effect. Daggers denote genes for which a treatment × region interaction was detected and show the individual regions for which treatment effects were present. Multivariate ANOVA (all treatments, all genes, both regions) indicates interactions of treatment × region (p < 0.05) and treatment × gene × region (p < 0.008).
Transcriptional control and cell signaling
In control animals, the forebrain showed consistently higher expression of the genes encoding the nuclear transcription factors known to operate in the transition from neural cell replication to differentiation (Table 4). Across the wider family of genes related to signaling through AC, G-proteins, PDEs, PKA and PKC, 36 genes showed significantly higher expression in the forebrain as compared to only 17 with higher expression in the brainstem (Table 5).
TABLE 4. Gene Expression Profiles in Control Brain Regions: Transcription Factor-Related (AP-1, Sp1, CREB).
| Protein encoded | Gene | Genbank | Brainstem | Forebrain |
|---|---|---|---|---|
| adaptor protein complex AP-1, β1subunit | ap1b1 | NM017277 | 0.90 ± 0.04 | 1.22 ± 0.09* |
| adaptor protein complex AP-1, γ1subunit | ap1g1 | XM341686 | 0.96 ± 0.07 | 1.23 ± 0.06* |
| adaptor protein complex AP-1, γ2subunit | ap1g2 | XM214197 | 0.94 ± 0.07 | 1.23 ± 0.14 |
| adaptor protein complex AP-1,μ 1subunit | ap1m1 | XM240364 | 0.85 ± 0.04 | 1.45 ± 0.10* |
| adaptor protein complex AP-1, σ1subunit | ap1s1 | XM341052 | 0.95 ± 0.01 | 1.04 ± 0.01* |
| cyclic AMP responsive element binding protein 1 | creb1 | NM134443 | 1.01 ± 0.07 | 1.24 ± 0.06* |
| cyclic AMP responsive element binding protein 3 | creb3 | XM216492 | 0.85 ± 0.04 | 1.08 ± 0.03* |
| Sp1 transcription factor | sp1 | NM012655 | 1.01 ± 0.03 | 0.93 ± 0.04 |
Significantly higher than in the other region.
TABLE 5. Gene Expression Profiles in Control Brain Regions: Cell Signaling-Related.
| Protein encoded | Gene | Genbank | Brainstem | Forebrain |
|---|---|---|---|---|
| AC1 | adcy1 | XM223616 | 1.16 ± 0.08 | 1.09 ± 0.08 |
| AC2 | adcy2 | NM031007 | 1.16 ± 0.01* | 0.91 ± 0.03 |
| AC3 | adcy3 | NM130779 | 0.93 ± 0.06 | 1.20 ± 0.07* |
| AC4 | adcy4 | NM019285 | 1.03 ± 0.08* | 0.78 ± 0.07 |
| AC5 | adcy5 | NM022600 | 0.91 ± 0.02 | 1.11 ± 0.03* |
| AC6 | adcy6 | L01115 | 0.83 ± 0.02 | 1.13 ± 0.03* |
| AC7 | adcy7 | NP337670 | 1.01 ± 0.06 | 1.08 ± 0.15 |
| AC8 | adcy8 | NM017142 | 1.51 ± 0.06* | 0.64 ± 0.01 |
| AC9 | adcy9 | XM220178 | 0.91 ± 0.10 | 0.98 ± 0.11 |
| Soluble AC | sac | NM021684 | 1.34 ± 0.10* | 0.97 ± 0.11 |
| AC activating polypeptide 1 | adcyap1 | NM016989 | 1.15 ± 0.09* | 0.87 ± 0.02 |
| AC activating polypeptide 1 receptor 1 | adcyap1r1 | NM133511 | 1.00 ± 0.06 | 0.97 ± 0.05 |
| Inhibitory G-protein αi1 | gnai1 | NM013145 | 0.91 ± 0.04 | 1.13 ± 0.03* |
| Inhibitory G-protein αi2 | gnai2 | NM031035 | 0.93 ± 0.02 | 1.00 ± 0.02* |
| Inhibitory G-protein αi3 | gnai3 | NM013106 | 0.99 ± 0.02 | 1.08 ± 0.01* |
| stimulatory G-protein αs | gnas | L10326 | 1.26 ± 0.06* | 0.73 ± 0.03 |
| G-protein α11 | gna11 | NM031033 | 0.97 ± 0.01 | 1.25 ± 0.10* |
| G-protein α12 | gna12 | NM031034 | 0.91 ± 0.04 | 1.46 ± 0.15* |
| G-protein α13 | gna13 | NM001013119 | 1.16 ± 0.14* | 0.65 ± 0.19 |
| G-protein α14 | gna14 | XM234115 | 0.79 ± 0.03 | 1.11 ± 0.03* |
| G-protein α15 | gna15 | NM053542 | 0.98 ± 0.08 | 1.04 ± 0.07 |
| G-protein αo | gnao | NM017327 | 0.73 ± 0.03 | 1.19 ± 0.07* |
| G-protein αq | gnaq | NM031036 | 0.84 ± 0.06 | 1.26 ± 0.05* |
| G-protein αt1 | gnat1 | XM343480 | 1.00 ± 0.03 | 0.99 ± 0.04 |
| G-protein αt3 | gnat3 | NM173139 | 1.08 ± 0.04 | 1.02 ± 0.09 |
| G-protein αz | gnaz | NM013189 | 0.94 ± 0.02 | 1.00 ± 0.03 |
| G-protein β1 | gnb1 | NM030987 | 0.82 ± 0.01 | 1.30 ± 0.07* |
| G-protein β2 | gnb2 | NM031037 | 0.66 ± 0.01 | 1.33 ± 0.06* |
| G-protein β4 | gnb4 | NM001013910 | 0.84 ± 0.03 | 1.15 ± 0.07* |
| G-protein β5 | gnb5 | NM031770 | 0.74 ± 0.02 | 1.30 ± 0.08* |
| G-protein γ3 | gng3 | AF022088 | 0.99 ± 0.03 | 0.98 ± 0.05 |
| G-protein γ4 | gng4 | AF022089 | 0.99 ± 0.02 | 1.01 ± 0.02 |
| G-protein γ5 | gng5 | NM024377 | 1.31 ± 0.06* | 0.80 ± 0.02 |
| G-protein γ7 | gng7 | NM024138 | 0.69 ± 0.08 | 1.62 ± 0.06* |
| G-protein γ8 | gng8 | NM139185 | 1.00 ± 0.04 | 0.96 ± 0.03 |
| G-protein γ10 | gng10 | NM053660 | 0.86 ± 0.03 | 1.18 ± 0.05* |
| G-protein γ11 | gng11 | NM022396 | 1.24 ± 0.03* | 0.90 ± 0.02 |
| G-protein γ12 | gng12 | XM578287 | 1.22 ± 0.04* | 0.89 ± 0.04 |
| G-protein-coupled receptor kinase 1 | grk1 | NM001012200 | 0.76 ± 0.06 | 1.31 ± 0.13* |
| arrestin β1 | arrb1 | NM012910 | 1.11 ± 0.04 | 1.02 ± 0.02 |
| arrestin β2 | arrb2 | NM012911 | 0.84 ± 0.08 | 0.97 ± 0.03 |
| cyclic nucleotide PDE 1 | cnp1 | NM012809 | 1.09 ± 0.01* | 0.92 ± 0.07 |
| PDE 1A | pde1a | NM030871 | 0.84 ± 0.04 | 1.41 ± 0.11* |
| PDE 1B | pde1b | NM022710 | 0.96 ± 0.02 | 1.04 ± 0.02* |
| PDE 1C | pde1c | NM031078 | 1.24 ± 0.09* | 0.83 ± 0.04 |
| PDE 2A | pde2a | NM031079 | 0.46 ± 0.04 | 1.43 ± 0.10* |
| PDE 3A | pde3a | NM017337 | 1.15 ± 0.13 | 0.90 ± 0.11 |
| PDE 3B | pde3b | NM017229 | 1.08 ± 0.03* | 0.96 ± 0.04 |
| PDE 4A | pde4a | NM013101 | 0.97 ± 0.03 | 0.97 ± 0.04 |
| PDE 4B | pde4b | NM017031 | 0.99 ± 0.02 | 0.98 ± 0.05 |
| PDE 4D | pde4d | L27060 | 1.07 ± 0.07 | 1.02 ± 0.06 |
| PDE 5A | pde5a | AY155460 | 1.00 ± 0.01 | 1.16 ± 0.06* |
| PDE 7A | pde7a | XM215540 | 0.92 ± 0.02 | 1.13 ± 0.03* |
| PDE 8A | pde8a | NM198767 | 0.91 ± 0.04 | 0.89 ± 0.13 |
| cyclic AMP-specific PDE 8B | rnpde8b | NM199268 | 0.90 ± 0.16 | 1.11 ± 0.14 |
| PDE 9A | pde9a | NM138543 | 0.92 ± 0.03 | 1.06 ± 0.04* |
| PDE 10A | pde10a | NM022236 | 0.63 ± 0.06 | 1.42 ± 0.07* |
| PDE 11A | pde11a | AB059361 | 0.99 ± 0.08 | 0.92 ± 0.09 |
| PKA α1 | prkaa1 | NM019142 | 0.74 ± 0.08 | 1.13 ± 0.09* |
| PKA α2 | prkaa2 | NM023991 | 0.86 ± 0.03 | 1.06 ± 0.04* |
| PKA β1 | prkab1 | NM031976 | 1.10 ± 0.02* | 0.91 ± 0.05 |
| PKA β2 | prkab2 | NM022627 | 0.91 ± 0.08 | 0.79 ± 0.07 |
| PKA αcatalytic | prkaca | XM341661 | 1.06 ± 0.06 | 0.95 ± 0.05 |
| PKA βcatalytic | prkacb | XM227829 | 0.88 ± 0.09 | 0.93 ± 0.03 |
| PKA γ1 | prkag1 | NM013010 | 0.95 ± 0.02 | 1.07 ± 0.04* |
| PKA γ2 | prkag2 | NM184051 | 0.97 ± 0.05 | 1.08 ± 0.03 |
| PKA 1 αregulatory | prkar1a | NM013181 | 0.83 ± 0.03 | 1.18 ± 0.04* |
| PKA 2 αregulatory | prkar2a | NM019264 | 1.20 ± 0.07* | 0.88 ± 0.11 |
| PKA 2 βregulatory | prkar2b | XM343046 | 0.76 ± 0.03 | 1.24 ± 0.04* |
| PKA inhibitor β | pkib | NM012627 | 1.00 ± 0.06 | 0.87 ± 0.05 |
| PKC α | prkca | XM343975 | 0.97 ± 0.07 | 1.06 ± 0.09 |
| PKC β1 | prkcb1 | NM012713 | 0.92 ± 0.03 | 1.11 ± 0.03* |
| PKC γ | prkcc | NM012628 | 0.89 ± 0.02 | 1.09 ± 0.02* |
| PKC δ | prkcd | NM133307 | 0.78 ± 0.02 | 1.19 ± 0.04* |
| PKC ε | prkce | NM017171 | 0.95 ± 0.04 | 1.10 ± 0.05* |
| PKC η | prkch | NM031085 | 1.27 ± 0.11 | 1.00 ± 0.08 |
| PKC λ | pkcl | XM342223 | 0.98 ± 0.06 | 1.02 ± 0.05 |
| PKC μ | prkcm | XM234108 | 1.12 ± 0.10 | 0.92 ± 0.06 |
| PKC ν | prkcn | XM233808 | 1.09 ± 0.10* | 0.75 ± 0.06 |
| PKCθ | prkcq | XM341553 | 1.21 ± 0.09 | 1.02 ± 0.06 |
| PKC ζ | prkcz | NM022507 | 1.12 ± 0.06* | 0.92 ± 0.03 |
| PKC binding protein 1 | prkcbp1 | XM215942 | 0.85 ± 0.03 | 1.05 ± 0.10 |
| PKC-binding protein α | prkcabp | NM053460 | 0.86 ± 0.02 | 1.08 ± 0.04* |
| PKC-binding protein β15 | pkcbpb15 | NM021764 | 0.96 ± 0.01 | 1.18 ± 0.08* |
| PKC-binding protein δ | prkcdbp | NM134449 | 1.00 ± 0.02 | 1.07 ± 0.05 |
Significantly higher than in the other region.
In brain regions of the animals exposed to CPF or DZN, we found a high rate of significant differences for the families of genes involved in transcriptional control and cell signaling: 51 genes out of 95 (54%), as against the FPR of only 5 (p < 0.0001). Multivariate ANOVA (all treatments, all genes, both regions) indicated interactions of treatment × gene (p < 0.0001) and treatment × gene × region (p < 0.0001). For the genes related to the AP-1 nuclear transcription factor, CPF treatment produced a significant overall decrement in expression in the forebrain (main treatment effect, p < 0.0001), with the greatest effect seen for ap1g2 (Fig. 4A); in contrast, there was strong induction of the same gene in the brainstem. The CREB-related genes were not significantly affected by CPF treatment but sp1 was increased in the forebrain. For the low dose of DZN, the overall decrease in AP-1-related genes fell just short of statistical significance (p < 0.08) but there was a significant drop in ap1m1 (Fig. 4B); we did not find an increase in brainstem ap1g2 as had been seen for CPF. Importantly, though, there was a significant decrease in creb1 expression, an effect that was not elicited by CPF. Increasing the DZN dose to 2 mg/kg (Fig. 4C) enhanced the overall impact on AP-1 genes, so that the main treatment effect did achieve statistical significance (p < 0.009) but the actions directed toward ap1g2 (increase in brainstem, decrease in forebrain) remained notably smaller than for CPF treatment. The higher dose of DZN also elicited a greater fall in creb1 and decreased sp1 expression in the brainstem; again, these effects were not shared by CPF.
Fig. 4.
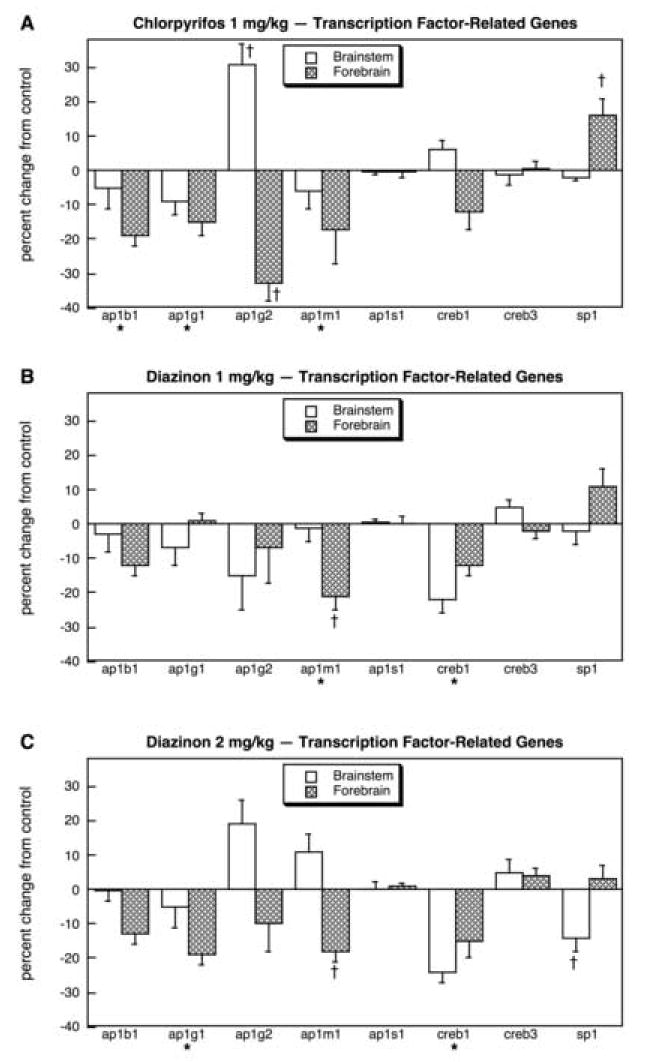
Effects of 1 mg/kg/day CPF (A), 1 mg/kg/day of DZN (B), or 2 mg/kg/day of DZN (C) on expression of transcription factor-related genes, presented as the percentage change from control values (Table 4). Asterisks shown below each gene denote a significant main treatment effect. Daggers denote genes for which a treatment × region interaction was detected and show the individual regions for which treatment effects were present. Multivariate ANOVA (all treatments, all genes, both regions) indicates a significant main treatment effect (p < 0.007) and interactions of treatment × gene (p < 0.008), treatment × region (p < 0.005) and treatment × gene × region (p < 0.0001).
Because of the large group of genes sampled for cell signaling, we divided them into six logical subcategories: AC and its modulators, G-protein α subunits, G-protein β and γ subunits and regulators of G-protein-coupled receptors (GPCRs), PDEs, PKAs and their modulators, and PKCs and their modulators. CPF exposure produced substantial reductions in adcy1 in both brain regions and sac in the forebrain, whereas significant increases were seen for adcy4 and adcy9, as well as smaller effects on one of the AC regulatory proteins, adcyap1 (Fig. 5A). In contrast, 1 mg/kg of DZN had noticeably less effect (Fig. 5B). Raising the DZN dose to 2 mg/kg (Fig. 5C) produced a pattern somewhat similar to that of CPF, evidenced by significant reductions in adcy1 and sac, and stimulation of adcy4 and adcyap1. However, there were also distinct differences between the effects of CPF and the higher dose of DZN. The latter evoked much larger increases in adcy4 in the forebrain, induced brainstem adcy7, and suppressed adcy8, whereas it did not affect adcy9.
Fig. 5.
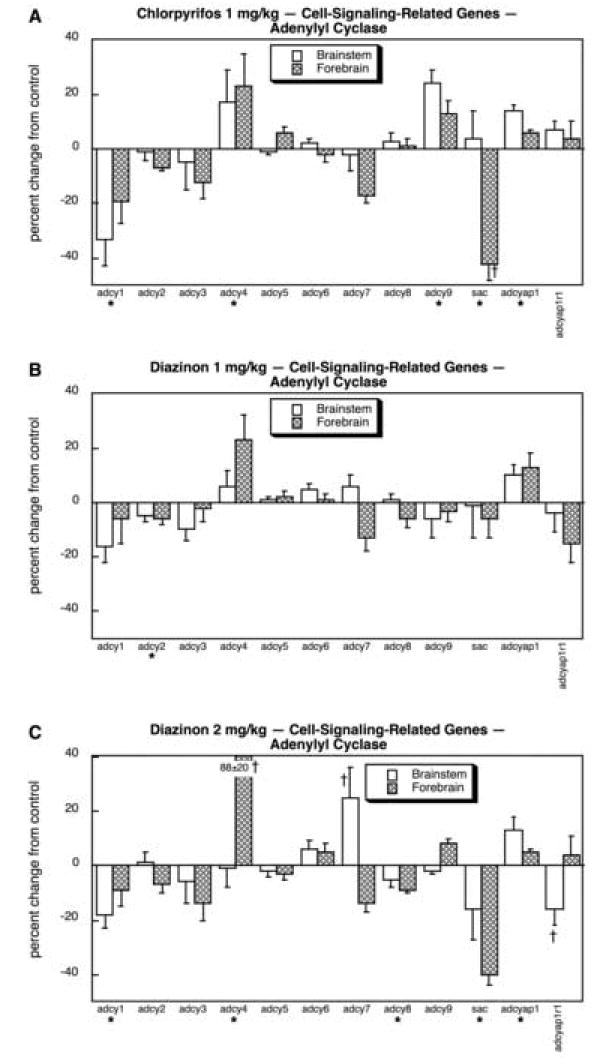
Effects of 1 mg/kg/day CPF (A), 1 mg/kg/day of DZN (B), or 2 mg/kg/day of DZN (C) on expression of the subset of cell signaling-related genes for adenylyl cyclase subtypes and their modulators, presented as the percentage change from control values (Table 5). Asterisks shown below each gene denote a significant main treatment effect. Daggers denote genes for which a treatment × region interaction was detected and show the individual regions for which treatment effects were present. Multivariate ANOVA (all treatments, all genes, both regions) indicates interactions of treatment × gene (p < 0.0001) and treatment × gene × region (p < 0.0004).
CPF and DZN treatments both had substantial effects on expression of the genes encoding Gprotein α-subunits. For CPF (Fig. 6A), the largest effects were on gna12 (suppressed in the forebrain) and gna13 (reduced in the brainstem, augmented in the forebrain); we also found small but significant stimulation of gnai2 and gna14, but inhibition of gnai3. The lower dose of DZN also targeted the same set of genes, producing effects of similar magnitude and direction to those seen for CPF (Fig. 6B). However, DZN also strongly induced brainstem gnat1 and slightly stimulated gnaz, effects that were not seen for CPF; effects on gna11 were also somewhat more robust than those for CPF, so that with DZN the reductions became statistically significant whereas they were not significant for CPF. Raising the dose of DZN to 2 mg/kg (Fig. 6C) gave essentially similar patterns to those seen at the lower dose, except that the reduction in gnaqbecame large enough to achieve statistical significance; again, this effect was not seen for CPF.
Fig. 6.
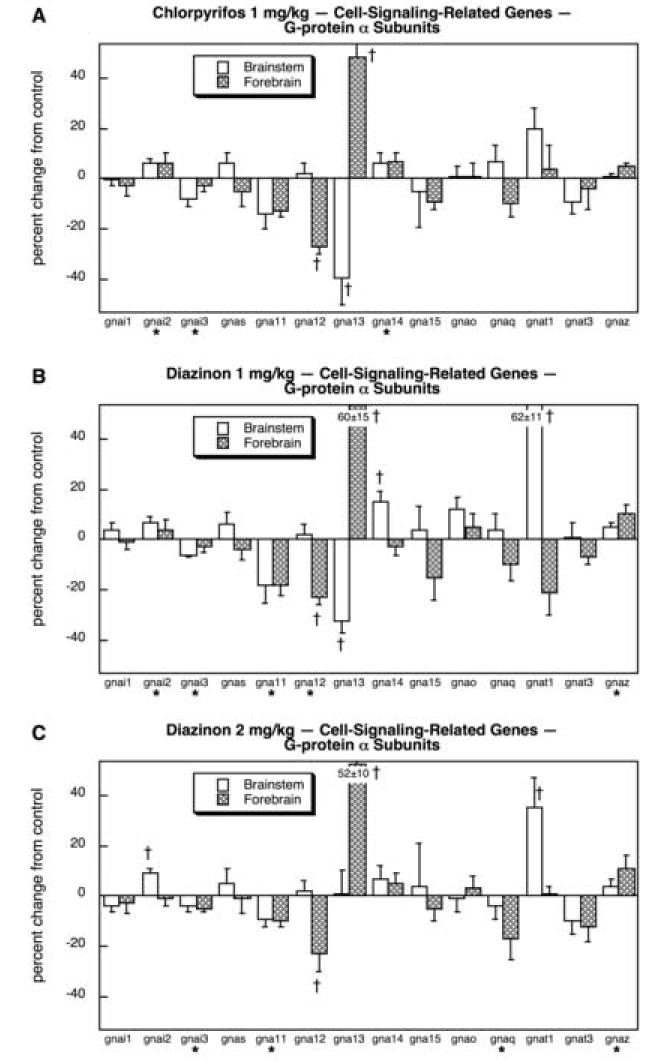
Effects of 1 mg/kg/day CPF (A), 1 mg/kg/day of DZN (B), or 2 mg/kg/day of DZN (C) on expression of the subset of cell signaling-related genes related to G-protein α subunits, presented as the percentage change from control values (Table 5). Asterisks shown below each gene denote a significant main treatment effect. Daggers denote genes for which a treatment × region interaction was detected and show the individual regions for which treatment effects were present. Multivariate ANOVA (all treatments, all genes, both regions) indicates interactions of treatment × gene (p < 0.009) and treatment × gene × region (p < 0.0001).
In general, the effects on G-protein β and γ subunits and GPCR regulatory proteins were less notable than those on α-subunits. For CPF, the only statistically significant effects were a small reduction in gng12 and arrb1 (Fig. 7A). DZN had more substantial effects. At the lower dose, DZN shared the effects of CPF on gng12 and arrb1 but also strongly induced brainstem gnb5 and grk1 (Fig. 7B). Raising the DZN dose to 2 mg/kg produced a similar pattern, with even stronger stimulation of grk1 (Fig. 7C).
Fig. 7.
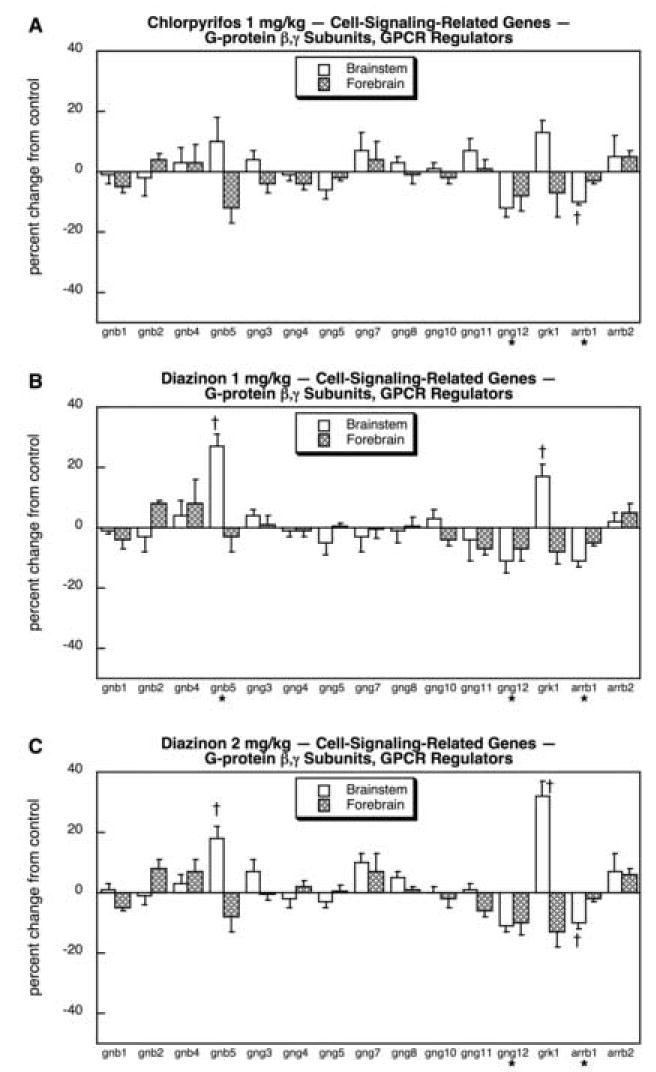
Effects of 1 mg/kg/day CPF (A), 1 mg/kg/day of DZN (B), or 2 mg/kg/day of DZN (C) on expression of the subset of cell signaling-related genes for G-protein β,γ subunits, and to regulation of G-protein-coupled receptor (GPCR) function, presented as the percentage change from control values (Table 5). Asterisks shown below each gene denote a significant main treatment effect without a treatment × region interaction, without lower-order tests for each region. Daggers denote genes for which a treatment × region interaction was detected and show the individual regions for which treatment effects were present. Multivariate ANOVA (all treatments, all genes, both regions) indicates an interaction of treatment × gene (p < 0.05).
CPF exposure had a significant effect on the expression of several of the PDE genes, with the largest changes seen for pde1c and pde8a (Fig. 8A). For both, values were increased markedly in the forebrain, whereas the brainstem showed a decrease in pde1cexpression. Smaller inhibitory effects were seen for cnp1 and pde5a, whereas a slight stimulation was obtained for dpde1. With exposure to 1 mg/kg of DZN, we saw an entirely different spectrum of changes in PDE gene expression (Fig. 8B). The main targets for CPF, pde1c and pde8a, were not significantly affected by the low dose of DZN and instead, there were large changes in pde3a; however, just as for the genes targeted by CPF, the pattern of change was a decrease in the brainstem and an increase in the forebrain. Additional effects were both similar to those of CPF (reduced pde5a, pde10a) and dissimilar (reduced forebrain pde4d for DZN but not CPF). Raising the DZN dose to 2 mg/kg elicited changes in PDE gene expression that shared the attributes of both the lower dose of DZN and of CPF (Fig. 8C): reductions in brainstem pde1c and pde3a as well as in pde5a and pde10a, increases in forebrain pde1c, pde3a and pde8a as well as dpde1. In addition, the higher DZN exposure produced changes not seen with the lower dose or with CPF, namely reduced pde1a and increased pde11a.
Fig. 8.
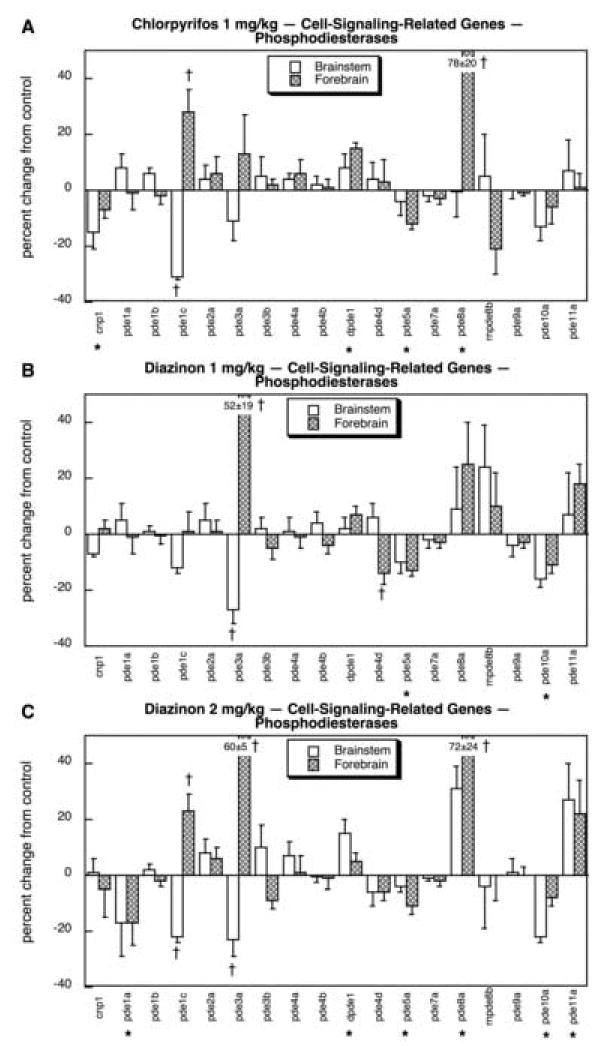
Effects of 1 mg/kg/day CPF (A), 1 mg/kg/day of DZN (B), or 2 mg/kg/day of DZN (C) on expression of the subset of cell signaling-related genes for phosphodiesterases, presented as the percentage change from control values (Table 5). Asterisks shown below each gene denote a significant main treatment effect. Daggers denote genes for which a treatment × region interaction was detected and show the individual regions for which treatment effects were present. Multivariate ANOVA (all treatments, all genes, both regions) indicates interactions of treatment × gene (p < 0.0004 and treatment × gene × region (p < 0.0001).
Further downstream from the synthesis and degradation of cAMP, we assessed the impact of organophosphate treatments on genes related to PKA and its modulatory proteins. CPF exposure increased the expression of prkaa1 and pkib in both regions and of prkar2b in the brainstem and prkab2 in the forebrain (Fig. 9A). Only one gene showed a significant decrease, brainstem prkag2. At 1 mg/kg, DZN elicited a pattern similar to that seen for CPF (Fig. 9B): increases in prkaa1, prkab2 and pkib and a decrease in brainstem prkag2. At the higher dose, DZN also stimulated prkab2 and pkib but there were also several differences (Fig. 9C): prkaa1 was no longer upregulated and prkar2a was suppressed; for the latter gene, the same trend toward a decrease had been seen with CPF and DZN 1 mg/kg but the decline was magnified at the higher dose of DZN and thus became statistically significant.
Fig. 9.
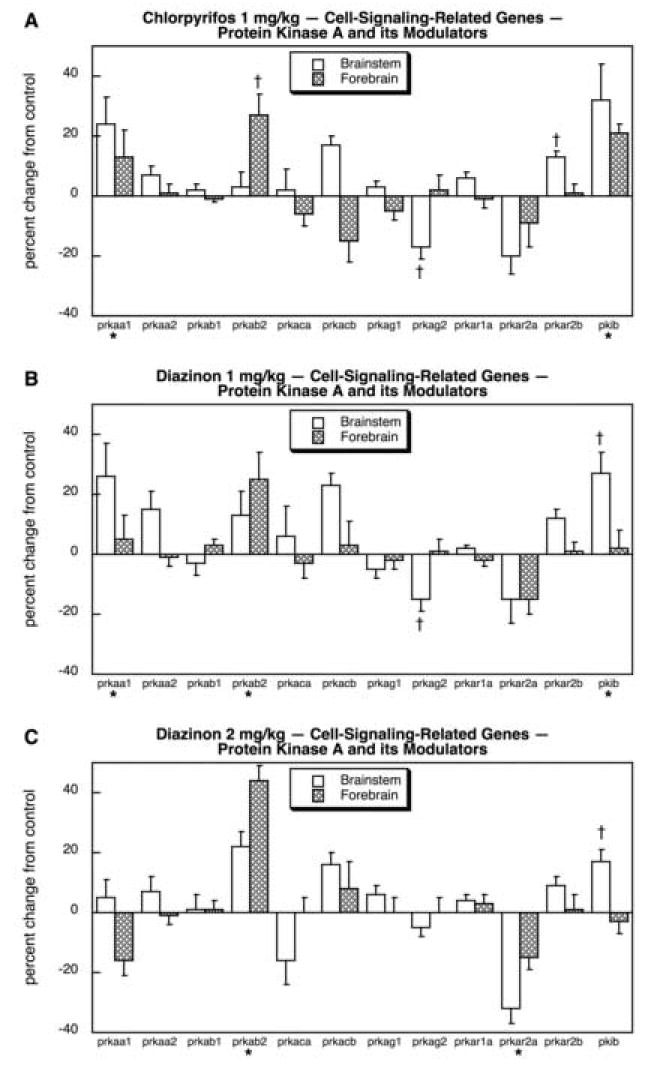
Effects of 1 mg/kg/day CPF (A), 1 mg/kg/day of DZN (B), or 2 mg/kg/day of DZN (C) on expression of the subset of cell signaling-related genes for protein kinase A subtypes and their modulators, presented as the percentage change from control values (Table 5). Asterisks shown below each gene denote a significant main treatment effect. Daggers denote genes for which a treatment × region interaction was detected and show the individual regions for which treatment effects were present. Multivariate ANOVA (all treatments, all genes, both regions) indicates an interaction of treatment × gene (p < 0.0001).
The final set of cell-signaling-related genes comprised those related to PKC and its modulators. In general, a lower proportion of these genes were targeted by the organophosphates than for most of the other cell signaling groupings: 4 genes out of 15 (27%) vs. 41 out of 72 (57%, p < 0.03). For CPF exposure, there was a significant decrease in prkch and an increase in forebrain prkcn (Fig. 10A). At the lower dose, DZN had a significant effect on only forebrain prkcn (Fig. 10B), the same gene showing upregulation for CPF. Increasing the DZN exposure to 2 mg/kg produced a pattern similar to that of CPF (suppression of prkch, increase in forebrain prkcn) but also produced significant upregulation of prkcabp and forebrain pkcl, and suppression of prkcq and brainstem prkcm. All of these additional changes were present to a smaller extent for CPF and/or low-dose DZN, so that the higher DZN exposure merely magnified these underlying effects past the threshold for statistical significance.
Fig. 10.
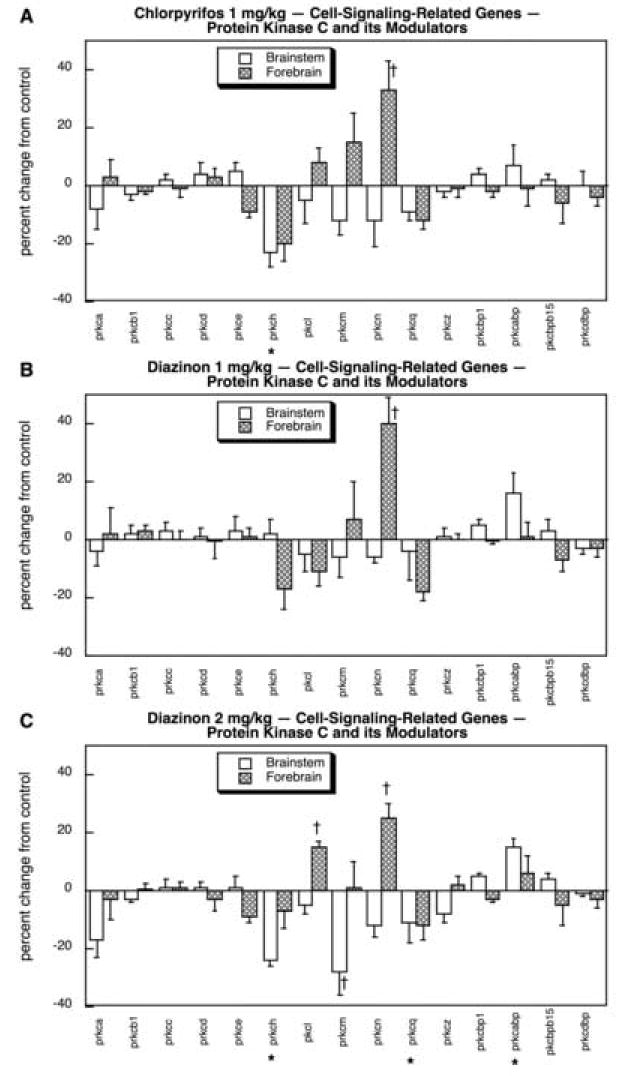
Effects of 1 mg/kg/day CPF (A), 1 mg/kg/day of DZN (B), or 2 mg/kg/day of DZN (C) on expression of the subset of cell signaling-related genes for protein kinase C subtypes and their modulators, presented as the percentage change from control values (Table 5). Asterisks shown below each gene denote a significant main treatment effect. Daggers denote genes for which a treatment × region interaction was detected and show the individual regions for which treatment effects were present. Multivariate ANOVA (all treatments, all genes, both regions) indicates interactions of treatment × gene (p < 0.04), treatment × region (p < 0.02) and treatment × gene × region (p < 0.05).
Cytotoxicity
In control animals, among all the genes evaluated for indices of cytotoxicity (apoptosis-related, oxidative stress-related, iGluRs), there were strong regional differences in basal expression. For apoptosis components, 4 genes were expressed at significantly higher levels in the brainstem whereas 7 showed greater values in the forebrain (Table 6). For oxidative stress, there was a much more clear-cut preferential effect in the brainstem, where 15 genes showed higher expression than in the forebrain as compared to only 3 genes with higher values in the forebrain (Table 7). For iGluR-related genes, the regional disparities were evenly distributed between the two regions, with 5 showing higher expression in the brainstem and 6 in the forebrain (Table 8).
TABLE 6. Gene Expression Profiles in Control Brain Regions: Apoptosis-Related.
| Protein encoded | Gene | Genbank | Brainstem | Forebrain |
|---|---|---|---|---|
| B-cell leukemia/lymphoma 2 | bcl2 | AF149299 | 0.96 ± 0.04 | 1.02 ± 0.03 |
| bcl2-associated death promoter | bad | NM022698 | 0.80 ± 0.04 | 1.23 ± 0.04* |
| bcl2-associated athanogene 1 | bag1 | XM216377 | 0.96 ± 0.02 | 1.20 ± 0.04* |
| bcl2 antagonist/killer 1 | bak1 | NM053812 | 1.06 ± 0.02 | 0.99 ± 0.04 |
| bcl2-associated X-protein | bax | AF235993 | 0.93 ± 0.01 | 1.10 ± 0.03* |
| bcl2-associated transcription factor 1 | bclaf1 | XM214967 | 0.73 ± 0.07 | 1.27 ± 0.02* |
| bcl2 modifying factor | bmf | NM139258 | 1.14 ± 0.06 | 0.98 ± 0.05 |
| caspase 1 | casp1 | NM012762 | 1.25 ± 0.08 | 0.96 ± 0.10 |
| caspase 2 | casp2 | NM022522 | 0.83 ± 0.02 | 1.07 ± 0.03* |
| caspase 3 | casp3 | NM012922 | 0.83 ± 0.03 | 1.35 ± 0.02* |
| caspase 4 | casp4 | NM053736 | 1.39 ± 0.04* | 0.82 ± 0.04 |
| caspase 6 | casp6 | NM031775 | 1.43 ± 0.12* | 0.88 ± 0.03 |
| caspase 7 | casp7 | NM022260 | 1.25 ± 0.04* | 0.82 ± 0.02 |
| caspase 9 | casp9 | NM031632 | 0.84 ± 0.01 | 0.99 ± 0.03* |
| caspase 12 | casp12 | NM130422 | 1.04 ± 0.04* | 0.90 ± 0.02 |
| apoptosis-related caspase activation inhibitor | aven | XM230438 | 1.01 ± 0.04 | 1.03 ± 0.03 |
| tumor protein 53 (p53) | tp53 | NM030989 | 0.83 ± 0.08 | 0.88 ± 0.16 |
Significantly higher than in the other region.
TABLE 7. Gene Expression Profiles in Control Brain Regions: Oxidative Stress-Related.
| Protein encoded | Gene | Genbank | Brainstem | Forebrain |
|---|---|---|---|---|
| superoxide dismutase 1 | sod1 | NM017050 | 1.29 ± 0.03* | 0.69 ± 0.02 |
| superoxide dismutase 2 | sod2 | NM017051 | 1.17 ± 0.03* | 0.85 ± 0.03 |
| superoxide dismutase 3 | sod3 | NM012880 | 1.18 ± 0.05* | 0.99 ± 0.04 |
| catalase | cat | NM012520 | 0.97 ± 0.04 | 0.94 ± 0.04 |
| glutathione peroxidase 1 | gpx1 | NM030826 | 1.15 ± 0.03* | 0.94 ± 0.03 |
| glutathione peroxidase 2 | gpx2 | NM183403 | 1.09 ± 0.09 | 0.86 ± 0.10 |
| glutathione peroxidase 3 | gpx3 | NM022525 | 1.07 ± 0.04* | 0.73 ± 0.08 |
| glutathione peroxidase 4 | gpx4 | BQ190299 | 1.02 ± 0.03 | 1.06 ± 0.09 |
| glutathione peroxidase 6 | gpx6 | NM147165 | 1.03 ± 0.03 | 1.06 ± 0.04 |
| glutathione peroxidase 7 | gpx7 | XM216473 | 1.19 ± 0.05* | 0.92 ± 0.02 |
| glutathione reductase | gsr | NM053906 | 1.01 ± 0.05 | 0.99 ± 0.05 |
| glutathione synthetase | gss | NM012962 | 1.00 ± 0.01 | 0.99 ± 0.03 |
| glutathione S-transferase α2 | gsta2 | NM017013 | 1.02 ± 0.05 | 1.33 ± 0.10* |
| glutathione S-transferase α4 | gsta4 | XM217195 | 1.26 ± 0.05* | 0.79 ± 0.04 |
| glutathione S-transferase α5 | gsta5 | NM031509 | 1.44 ± 0.04* | 0.85 ± 0.06 |
| glutathione S-transferase μ1 | gstm1 | NM017014 | 0.91 ± 0.02 | 1.02 ± 0.05 |
| glutathione S-transferase μ2 | gstm2 | NM031154 | 0.96 ± 0.03 | 1.02 ± 0.05 |
| glutathione S-transferase μ3 | gstm3 | NM031154 | 1.19 ± 0.07* | 1.00 ± 0.04 |
| glutathione S-transferase μ4 | gstm4 | NM020540 | 0.94 ± 0.03 | 0.87 ± 0.03 |
| glutathione S-transferase μ5 | gstm5 | NM172038 | 1.21 ± 0.04* | 0.76 ± 0.02 |
| glutathione S-transferase μ6 | gstm6 | XM215682 | 1.03 ± 0.05 | 0.86 ± 0.07 |
| glutathione S-transferase ω1 | gsto1 | NM001007602 | 0.83 ± 0.01 | 1.14 ± 0.02* |
| glutathione S-transferase ω2 | gsto2 | NM001012071 | 1.08 ± 0.07 | 1.06 ± 0.04 |
| glutathione S-transferase π1 | gstp1 | NM012577 | 0.89 ± 0.01 | 1.13 ± 0.03* |
| glutathione S-transferase π2 | gstp2 | NM138974 | 1.02 ± 0.01 | 1.01 ± 0.03 |
| glutathione S-transferase θ1 | gstt1 | NM053293 | 1.02 ± 0.02* | 0.70 ± 0.08 |
| glutathione S-transferase θ2 | gstt2 | NM012796 | 0.93 ± 0.05 | 1.03 ± 0.06 |
| microsomal glutathione S-transferase 1 | mgst1 | NM134349 | 1.51 ± 0.15* | 0.68 ± 0.01 |
| microsomal glutathione S-transferase 2 | mgst2 | XM215562 | 1.20 ± 0.22 | 1.26 ± 0.15 |
| microsomal glutathione S-transferase 3 | mgst3 | XM213943 | 1.03 ± 0.03* | 0.95 ± 0.01 |
| glutathione S-transferase, mitochondrial | gst13-13 | NM181371 | 1.08 ± 0.03* | 0.81 ± 0.02 |
| glutathione S-transferase, yc2 subunit | yc2 | NM001009920 | 1.20 ± 0.01* | 0.91 ± 0.03 |
Significantly higher than in the other region.
TABLE 8. Gene Expression Profiles in Control Brain Regions: Glutamate Receptor-Related.
| Protein encoded | Gene | Genbank | Brainstem | Forebrain |
|---|---|---|---|---|
| ionotropic GluR AMPA 1 | gria1 | NM031608 | 0.93 ± 0.04 | 1.24 ± 0.11* |
| ionotropic GluR AMPA 2 | gria2 | NM017261 | 0.96 ± 0.03 | 1.15 ± 0.04* |
| ionotropic GluR AMPA 3 | gria3 | NM032990 | 0.82 ± 0.04 | 1.08 ± 0.05* |
| ionotropic GluR AMPA 4 | gria4 | NM017263 | 0.69 ± 0.04 | 1.57 ± 0.11* |
| ionotropic GluR δ1 | grid1 | NM024378 | 0.89 ± 0.04 | 1.11 ± 0.06* |
| ionotropic GluR δ2 | grid2 | NM024379 | 1.28 ± 0.03* | 0.70 ± 0.04 |
| ionotropic GluR kainate 2 | grik2 | NM019309 | 0.91 ± 0.04 | 1.08 ± 0.04* |
| ionotropic GluR kainate 3 | grik3 | NM181373 | 0.90 ± 0.06 | 1.03 ± 0.04 |
| ionotropic GluR kainate 4 | grik4 | NM012572 | 0.98 ± 0.01 | 1.11 ± 0.06 |
| ionotropic GluR kainate 5 | grik5 | NM017262 | 0.88 ± 0.03 | 1.32 ± 0.07* |
| ionotropic GluR NMDA 1 | grin1 | NM017010 | 1.03 ± 0.01* | 0.94 ± 0.05 |
| ionotropic GluR NMDA 2A | grin2a | NM012573 | 0.73 ± 0.03 | 1.06 ± 0.05* |
| ionotropic GluR NMDA 2B | grin2b | NM012574 | 0.86 ± 0.03 | 1.18 ± 0.04* |
| ionotropic GluR NMDA 2C | grin2c | NM012575 | 0.99 ± 0.04 | 0.86 ± 0.06 |
| ionotropic GluR NMDA 2D | grin2d | NM022797 | 0.84 ± 0.02 | 1.06 ± 0.04* |
| ionotropic GluR NMDA 3A | grin3a | AF061945 | 0.92 ± 0.04 | 0.91 ± 0.05 |
| ionotropic GluR NMDA 3B | grin3b | NM133308 | 1.06 ± 0.07 | 0.96 ± 0.08 |
| metabotropic GluR 1 | grm1 | NM017011 | 1.28 ± 0.04* | 0.75 ± 0.02 |
| metabotropic GluR 2 | grm2 | XM343470 | 1.02 ± 0.04 | 0.89 ± 0.04 |
| metabotropic GluR 3 | grm3 | M92076 | 0.78 ± 0.02 | 1.21 ± 0.07* |
| metabotropic GluR 4 | grm4 | NM022666 | 1.30 ± 0.04* | 0.72 ± 0.04 |
| metabotropic GluR 5 | grm5 | NM017012 | 0.87 ± 0.06 | 1.22 ± 0.05* |
| metabotropic GluR 6 | grm6 | NM022920 | 0.92 ± 0.07 | 1.07 ± 0.14 |
| metabotropic GluR 7 | grm7 | NM031040 | 1.00 ± 0.02 | 0.98 ± 0.05 |
| metabotropic GluR 7B | grm7b | X96790 | 1.01 ± 0.06 | 0.85 ± 0.05 |
| metabotropic GluR 8 | grm8 | Y11153 | 1.76 ± 0.03* | 0.62 ± 0.05 |
Significantly higher than in the other region.
Neonatal exposure to organophosphates evoked major changes in gene expression in these pathways, with significant differences for 35 out of the 56 genes (63%), vs. the FPR of 3 (p < 0.0001). Multivariate ANOVA (all treatments, all genes, both regions) indicated interactions of treatment × gene (p < 0.0001), treatment × region (p < 0.05) and treatment × gene × region (p < 0.004). Of the 17 apoptosis-related genes, CPF exposure evoked significant overall increases in tp53 and regionally-selective upregulation (brainstem) of casp9 and casp 12 (Fig. 11A); bag1 showed a small but significant reduction in the forebrain. Treatment with 1 mg/kg of DZN evoked similar stimulation of tp53, casp9 and casp12 but failed to evoke significant reductions in bag1 and instead, suppressed bmf and casp4 (Fig. 11B). At the higher dose, DZN again elicited effects sharing those of both the low DZN dose and of CPF (Fig. 11C): increases in tp53, casp9 and casp12 and suppression of bag1, but also significant reductions in bax and casp1.
Fig. 11.
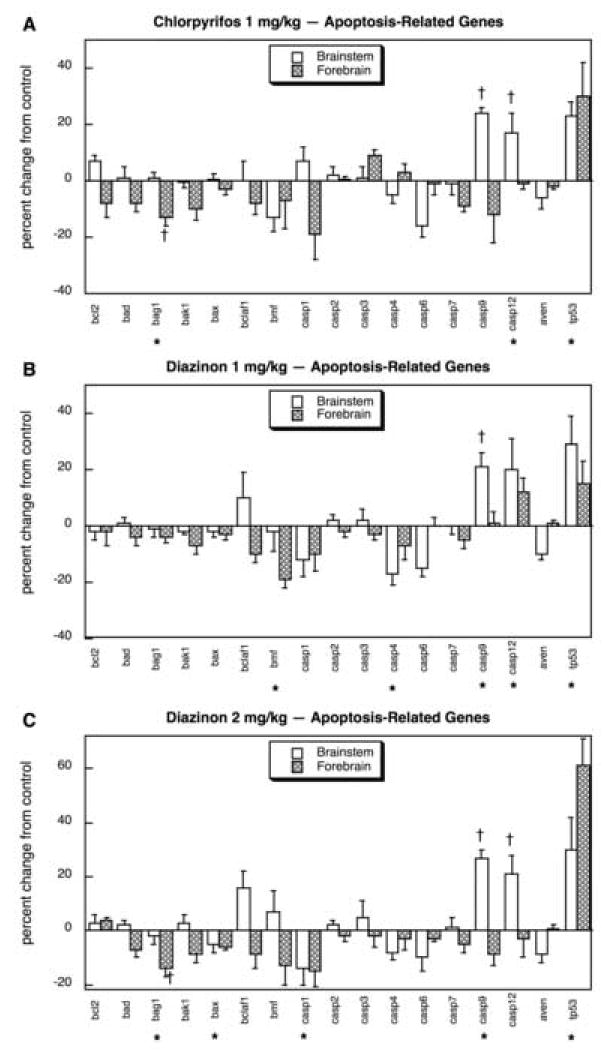
Effects of 1 mg/kg/day CPF (A), 1 mg/kg/day of DZN (B), or 2 mg/kg/day of DZN (C) on expression of apoptosis-related genes, presented as the percentage change from control values (Table 6). Asterisks shown below each gene denote a significant main treatment effect. Daggers denote genes for which a treatment × region interaction was detected and show the individual regions for which treatment effects were present. Multivariate ANOVA (all treatments, all genes, both regions) indicates interactions of treatment × gene (p < 0.001) and treatment × region (p < 0.05).
Oxidative stress again appeared to be a major target for organophosphate effects, with 18 out of the 32 genes showing significant differences. Because of the larger number of genes in this set, we separated the glutathione S-transferases from the rest of the group. For the other oxidative stress-related genes, CPF exposure produced small but significant overall upregulation of sod1 and cat, and downregulation of sod3 (Fig. 12A). For gpx4 and gsr, there were strong regional differences in the effects of CPF, with the brainstem showing upregulation of gpx4 whereas the forebrain showed downregulation of gpx4 and upregulation of gsr. The low dose of DZN also upregulated sod1 but the changes in sod3 and cat did not achieve statistical significance (Fig. 12B); effects on gpx4 and gsr were similar to those of CPF but in addition, DZN reduced gpx7 significantly. At the higher dose, DZN affected sod1, sod3 and gpx4 with the same pattern as seen for CPF but also caused significant downregulation of gpx2 and gsr in the brainstem (Fig. 12C). Among the 20 mRNAs encoding glutathione S-transferase subtypes, CPF evoked significant changes in 7 (Fig. 13A): gstm1, gstm4, gstm5 and gstt1 were upregulated whereas gsta2, gstm3 and mgst2 were suppressed. At 1 mg/kg, DZN exposure had virtually an identical pattern of effects (Fig. 13B); the higher dose of DZN also was similar (Fig. 13C), although some of the differences did not achieve statistical significance because of slightly higher variability.
Fig. 12.
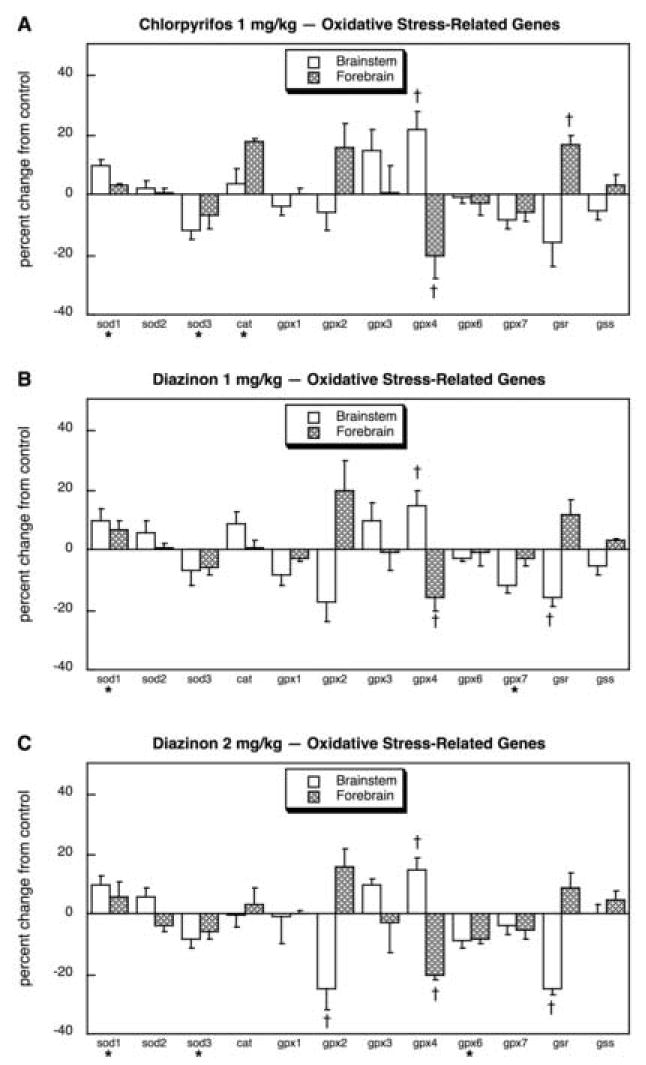
Effects of 1 mg/kg/day CPF (A), 1 mg/kg/day of DZN (B), or 2 mg/kg/day of DZN (C) on expression of oxidative stress-related genes, presented as the percentage change from control values (Table 7). Asterisks shown below each gene denote a significant main treatment effect. Daggers denote genes for which a treatment × region interaction was detected and show the individual regions for which treatment effects were present. Multivariate ANOVA (all treatments, all genes, both regions) indicates an interaction of treatment × gene × region (p < 0.0004).
Fig. 13.
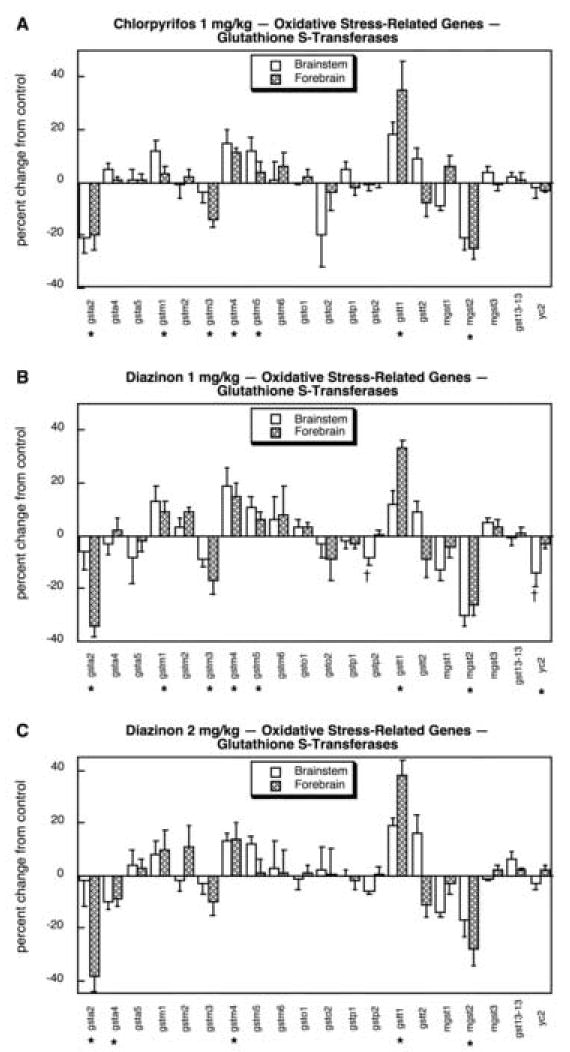
Effects of 1 mg/kg/day CPF (A), 1 mg/kg/day of DZN (B), or 2 mg/kg/day of DZN (C) on expression of oxidative stress-related genes for glutathione S-transferases, presented as the percentage change from control values (Table 7). Asterisks shown below each gene denote a significant main treatment effect. Daggers denote genes for which a treatment × region interaction was detected and show the individual regions for which treatment effects were present. Multivariate ANOVA (all treatments, all genes, both regions) indicates an interaction of treatment × gene (p < 0.0001).
More than half of the iGluR genes, 9 out of 17, showed significant effects of organophosphate exposure. CPF evoked regionally-selective upregulation of gria, grid1, grin2a and grin2b, as well as global upregulation of grin3a and downregulation of grik4 (Fig. 14A). The low dose of DZN (Fig. 14B) evoked fewer significant changes, with just two genes showing upregulation (grin2a, grin2c). Increasing the DZN dose (Fig. 14C) revealed significant decreases in gria1 and gria2 as well as an increase in grin2a, albeit the latter effect was smaller than that seen with CPF. We confirmed that the effects of CPF on iGluR gene expression were in fact significantly greater than those of DZN (main treatment effect, p < 0.005).
Fig. 14.
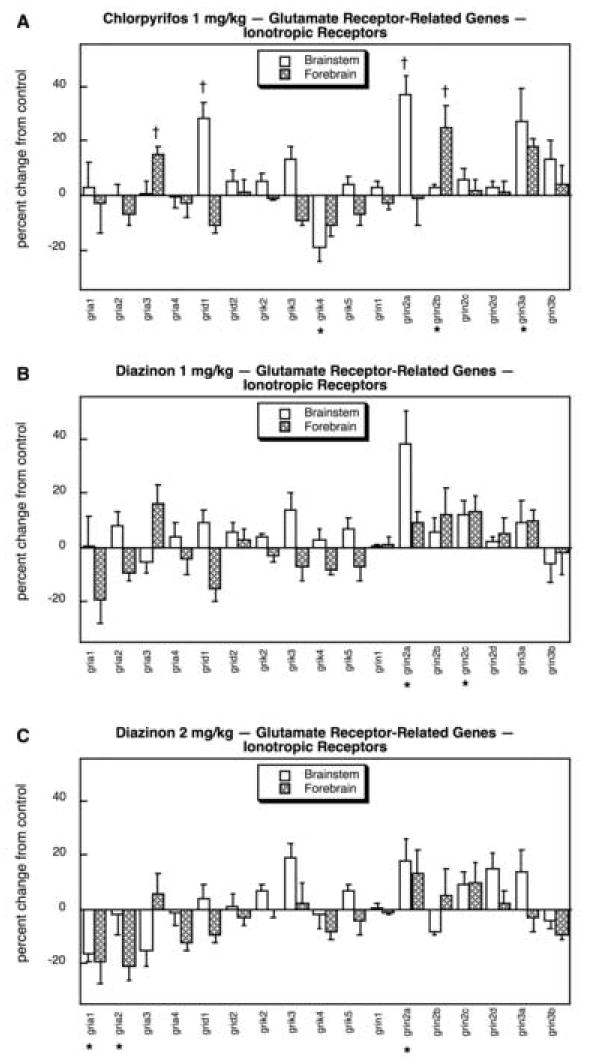
Effects of 1 mg/kg/day CPF (A), 1 mg/kg/day of DZN (B), or 2 mg/kg/day of DZN (C) on expression of glutamate receptor-related genes for the ionotropic receptor subtypes, presented as the percentage change from control values (Table 8). Asterisks shown below each gene denote a significant main treatment effect. Daggers denote genes for which a treatment × region interaction was detected and show the individual regions for which treatment effects were present. Multivariate ANOVA (all treatments, all genes, both regions) indicates a significant main treatment effect (p < 0.003) and interactions of treatment × gene (p < 0.0002) and treatment × region (p < 0.05).
Neurotransmitter systems
In control rats, there was no clear regional hierarchy for the distribution of mRNAs encoding mGluRs (Table 8): out of 9 genes, 3 were more highly expressed in the brainstem and 2 in the forebrain. The situation was quite different for ACh (Table 9). For the genes expressed by ACh neurons themselves, namely those involved in the synthesis, storage and degradation of ACh, there was a preponderance of higher values in the brainstem (4 out of 7 genes, slc5a7, slc18a3, ache, bche) than in the forebrain (1 gene, hache). In contrast, the expression of ACh receptor genes showed preferentially higher values in the forebrain (7 genes), the locus for ACh synaptic targets, than in the brainstem (3 genes). This pattern was repeated for 5HT (Table 10). All four of the genes involved in neurotransmitter synthesis, storage and degradation that showed regional preference were more highly expressed in the brainstem rather than the forebrain. In comparison, the 5HT receptor genes did not show this preference: only 3 genes out of 14 displayed a significant regional hierarchy, with two genes showing higher values in the brainstem and one in the forebrain. Likewise, for catecholaminergic (norepinephrine, dopamine) neurons (Table 11), the genes associated with presynaptic functions showed a penchant for higher values in the brainstem vs. the forebrain whereas those associated with receptors and modulators of receptor signaling were evenly distributed between those showing higher levels in one region or the other.
TABLE 9. Gene Expression Profiles in Control Brain Regions: ACh-Related.
| Protein encoded | Gene | Genbank | Brainstem | Forebrain |
|---|---|---|---|---|
| choline acetyltransferase | chat | XM224626 | 1.20 ± 0.08 | 1.12 ± 0.07 |
| choline transporter, member 7 | slc5a7 | NM053521 | 1.51 ± 0.09* | 0.58 ± 0.02 |
| choline transporter, member 8 | slc6a8 | NM017348 | 0.99 ± 0.08 | 1.14 ± 0.05 |
| vesicular ACh transporter, member 3 | slc18a3 | NM031663 | 1.64 ± 0.03* | 0.51 ± 0.04 |
| acetylcholinesterase | ache | NM172009 | 1.31 ± 0.06* | 0.62 ± 0.08 |
| acetylcholinesterase, glycolipid-anchored form | hache | X70140 | 0.91 ± 0.01 | 1.05 ± 0.02* |
| butyrylcholinesterase | bche | NM022942 | 1.20 ± 0.09* | 0.72 ± 0.05 |
| m1AChR | chrm1 | NM080773 | 0.89 ± 0.07 | 1.06 ± 0.04 |
| m2AChR | chrm2 | NM031016 | 1.07 ± 0.05* | 0.90 ± 0.01 |
| m3AChR | chrm3 | NM012527 | 1.06 ± 0.02* | 0.93 ± 0.02 |
| m4AChR | chrm4 | XM345403 | 0.50 ± 0.03 | 1.76 ± 0.06* |
| m5AChR | chrm5 | NM017362 | 0.99 ± 0.17 | 1.46 ± 0.14 |
| α2 nAChR | chrna2 | NM133420 | 0.93 ± 0.08 | 0.91 ± 0.03 |
| α3 nAChR | chrna3 | NM052805 | 1.48 ± 0.12* | 0.96 ± 0.03 |
| α4 nAChR | chrna4 | NM024354 | 0.87 ± 0.05 | 1.20 ± 0.11* |
| α5 nAChR | chrna5 | NM017078 | 0.88 ± 0.06 | 1.26 ± 0.11* |
| α6 nAChR | chrna6 | NM057184 | 1.27 ± 0.18 | 0.91 ± 0.08 |
| α7 nAChR | chrna7 | NM012832 | 1.15 ± 0.09 | 1.13 ± 0.09 |
| α9 nAChR | chrna9 | NM022930 | 0.86 ± 0.06 | 1.27 ± 0.13* |
| α10 nAChR | chrna10 | NM022639 | 1.02 ± 0.16 | 0.78 ± 0.16 |
| β2 nAChR | chrnb2 | NM019297 | 0.77 ± 0.07 | 0.97 ± 0.05 |
| β3 nAChR | chrnb3 | NM133597 | 0.87 ± 0.18 | 1.78 ± 0.16* |
| β4 nAChR | chrnb4 | NM052806 | 0.93 ± 0.02 | 1.03 ± 0.08 |
| ∂ nAChR | chrnd | NM019298 | 1.12 ± 0.20 | 0.96 ± 0.05 |
| ε nAChR | chrne | NM017194 | 0.79 ± 0.06 | 1.45 ± 0.10* |
| γ nAChR | chrng | NM019145 | 0.91 ± 0.06 | 1.25 ± 0.10* |
Significantly higher than in the other region.
TABLE 10. Gene Expression Profiles in Control Brain Regions: 5HT-Related.
| Protein encoded | Gene | Genbank | Brainstem | Forebrain |
|---|---|---|---|---|
| Tryptophan hydroxylase | tph | X53501 | 1.09 ± 0.06* | 0.84 ± 0.02 |
| presynaptic 5HT transporter, member 4 | slc6a4 | NM013034 | 1.52 ± 0.08* | 0.72 ± 0.03 |
| vesicular monoamine transporter, member 1 | slc18a1 | NM013152 | 0.94 ± 0.14 | 0.91 ± 0.02 |
| vesicular monoamine transporter, member 2 | slc18a2 | NM013031 | 2.32 ± 0.09* | 0.17 ± 0.07 |
| monoamine oxidase A | maoa | XM343764 | 1.07 ± 0.04 | 1.01 ± 0.07 |
| monoamine oxidase B | maob | NM013198 | 1.11 ± 0.03* | 0.91 ± 0.05 |
| 5HT1Areceptor | htr1a | NM012585 | 0.98 ± 0.09 | 1.02 ± 0.02 |
| 5HT1B receptor | htr1b | NM022225 | 0.96 ± 0.13 | 0.99 ± 0.08 |
| 5HT1D receptor | htr1d | NM012852 | 1.01 ± 0.02 | 0.93 ± 0.04 |
| 5HT1F receptor | htr1f | NM021857 | 0.98 ± 0.14 | 0.95 ± 0.07 |
| 5HT2A receptor | htr2a | NM017254 | 0.90 ± 0.01 | 0.99 ± 0.02 |
| 5HT2A receptor | htr2a (alt. splice) | AF203812 | 0.72 ± 0.09 | 0.86 ± 0.17 |
| 5HT2B receptor | htr2b | NM017250 | 1.07 ± 0.08 | 0.98 ± 0.09 |
| 5HT2C receptor | htr2c | NM012765 | 1.02 ± 0.05 | 1.17 ± 0.13 |
| 5HT3A receptor | htr3a | NM024394 | 0.99 ± 0.02 | 1.02 ± 0.04 |
| 5HT3B receptor | htr3b | NM022189 | 0.90 ± 0.02 | 1.02 ± 0.07 |
| 5HT5A receptor | htr5a | NM013148 | 1.15 ± 0.03* | 0.97 ± 0.03 |
| 5HT5B receptor | htr5b | XM341111 | 1.27 ± 0.03* | 0.82 ± 0.01 |
| 5HT6 receptor | htr6 | NM024365 | 0.79 ± 0.09 | 0.99 ± 0.06 |
| 5HT7 receptor | htr7 | NM022938 | 0.87 ± 0.03 | 1.06 ± 0.04* |
Significantly higher than in the other region.
TABLE 11. Gene Expression Profiles in Control Brain Regions: Catecholamine-Related.
| Protein encoded | Gene | Genbank | Brainstem | Forebrain |
|---|---|---|---|---|
| tyrosine hydroxylase | th | NM012740 | 1.36 ± 0.05* | 0.61 ± 0.04 |
| dopamine β-hydroxylase | dbh | NM013158 | 0.92 ± 0.07 | 0.89 ± 0.03 |
| presynaptic dopamine transporter, member 2 | slc6a3 | NM012694 | 2.36 ± 0.15* | 0.11 ± 0.02 (marginally detected) |
| presynaptic norepinephrine transporter, member 3 | slc6a2 | NM031343 | 1.02 ± 0.05 | 0.86 ± 0.05 |
| chromogranin A | chga | NM021655 | 0.93 ± 0.03 | 0.87 ± 0.04 |
| chromogranin B | chgb | NM012526 | 1.13 ± 0.02* | 0.79 ± 0.02 |
| D1Adopamine receptor | drd1a | A44P557376 | 0.46 ± 0.03 | 1.46 ± 0.12* |
| D2dopamine receptor | drd2 | NM012547 | 1.01 ± 0.01 | 1.05 ± 0.03 |
| D3dopamine receptor | drd3 | NM017140 | 1.08 ± 0.01* | 0.89 ± 0.03 |
| D4dopamine receptor | drd4 | NM012944 | 1.44 ± 0.08* | 0.87 ± 0.03 |
| D5dopamine receptor | drd5 | NM012768 | 1.07 ± 0.03* | 0.97 ± 0.02 |
| α1A-adrenergic receptor | adra1a | NM017191 | 1.02 ± 0.13 | 1.43 ± 0.10* |
| α1B-adrenergic receptor | adra1b | NM016991 | 1.28 ± 0.05* | 0.79 ± 0.03 |
| α1D-adrenergic receptor | adra1d | NM024483 | 1.07 ± 0.02* | 0.84 ± 0.02 |
| α2A-adrenergic receptor | adra2a | NM012739 | 0.90 ± 0.03 | 1.01 ± 0.04 |
| α2B-adrenergic receptor | adra2b | NM138505 | 1.05 ± 0.01* | 0.91 ± 0.04 |
| α2C-adrenergic receptor | adra2c | NM138506 | 0.90 ± 0.03 | 1.24 ± 0.06* |
| β1-adrenergic receptor | adrb1 | NM012701 | 1.03 ± 0.02 | 1.03 ± 0.03 |
| β2-adrenergic receptor | adrb2 | NM012492 | 0.89 ± 0.03 | 0.91 ± 0.04 |
| β3-adrenergic receptor | adrb3 | NM013108 | 1.07 ± 0.02 | 1.08 ± 0.09 |
| β1-adrenergic receptor kinase | adrbk1 | NM012776 | 0.93 ± 0.04 | 1.34 ± 0.12* |
| β2-adrenergic receptor kinase | adrbk2 | NM012897 | 0.55 ± 0.16 | 0.71 ± 0.13* |
Significantly higher than in the other region.
The following are shared with 5HT and appear in Table 10maoa, maob, slc18a1, slc18a2.
Across all the determinations for the neurotransmitter systems evaluated here (mGluRs, ACh, 5HT, dopamine, norepinephrine), the proportion of genes showing significant effects of organophosphate exposure was high, 50 out of 77 (65%), compared to the FPR of 4 (p < 0.0001). Multivariate ANOVA (all treatments, all genes, both regions) indicated interactions of treatment × gene (p < 0.0001), treatment × region (p < 0.009) and treatment × gene × region (p < 0.0001). In contrast to the situation seen for iGluRs involved in the excitotoxicity of the organophosphates, mGluR genes showed relatively few (3 out of 9 genes), modest changes. For CPF, there was a barely-detectable (but statistically significant) increase in grm2 and a more robust effect on grm7b (Fig. 15A). The same pattern was obtained at 1 mg/kg of DZN (Fig. 15B); at the higher dose, we again observed a small increase in grm2 but no change in grm7b, and there was significant decrease in grm8 (Fig. 15C).
Fig. 15.
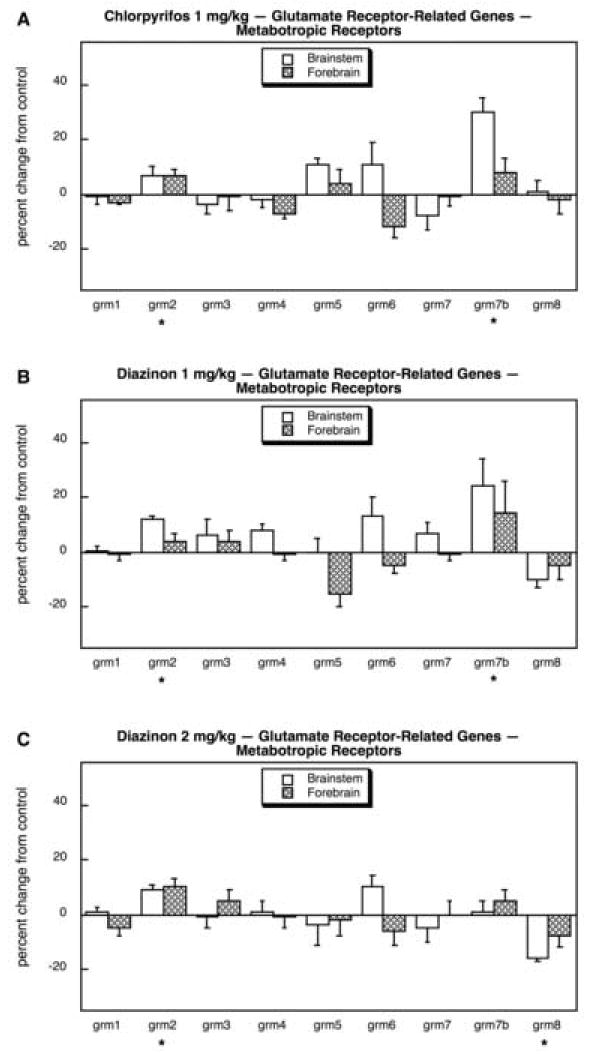
Effects of 1 mg/kg/day CPF (A), 1 mg/kg/day of DZN (B), or 2 mg/kg/day of DZN (C) on expression of glutamate receptor-related genes for the metabotropic receptor subtypes, presented as the percentage change from control values (Table 8). Asterisks shown below each gene denote a significant main treatment effect. Daggers denote genes for which a treatment × region interaction was detected and show the individual regions for which treatment effects were present. Multivariate ANOVA (all treatments, all genes, both regions) indicates interactions of treatment × gene (p < 0.003) and treatment × region (p < 0.05).
Unlike the situation for mGluR genes, for ACh systems, there was a considerably higher incidence of changes evoked by organophosphate exposure, with nearly two-thirds (17 out of 26) of the genes showing significant effects. Considering the processes involved in ACh synthesis, storage and degradation, CPF evoked a robust deficit in brainstem chat, which encodes choline acetyltransferase, the enzyme that synthesizes ACh (Fig. 16A); a smaller, but significant reduction was also seen in one of the choline transporter genes, slc6a8, but notably there were no detectable effects on any of the genes encoding cholinesterase proteins (ache, hache, bche). At 1 mg/kg, DZN also caused a significant reduction in chat expression but the decrease in slc6a8 was too small to achieve statistical significance (Fig. 16B); in addition, slc5a7 showed an increase in the brainstem, an effect that was not detected for CPF. At 2 mg/kg, DZN again reduced chat without significantly affecting slc6a8, and also induced brainstem slc5a7 just as was seen at the lower DZN dose (Fig. 16C). In addition, slc5a7 was significantly reduced in the forebrain, a direction of change that was also seen for CPF and DZN 1 mg/kg but that had been too small to meet the statistical criterion for those two treatments.
Fig. 16.
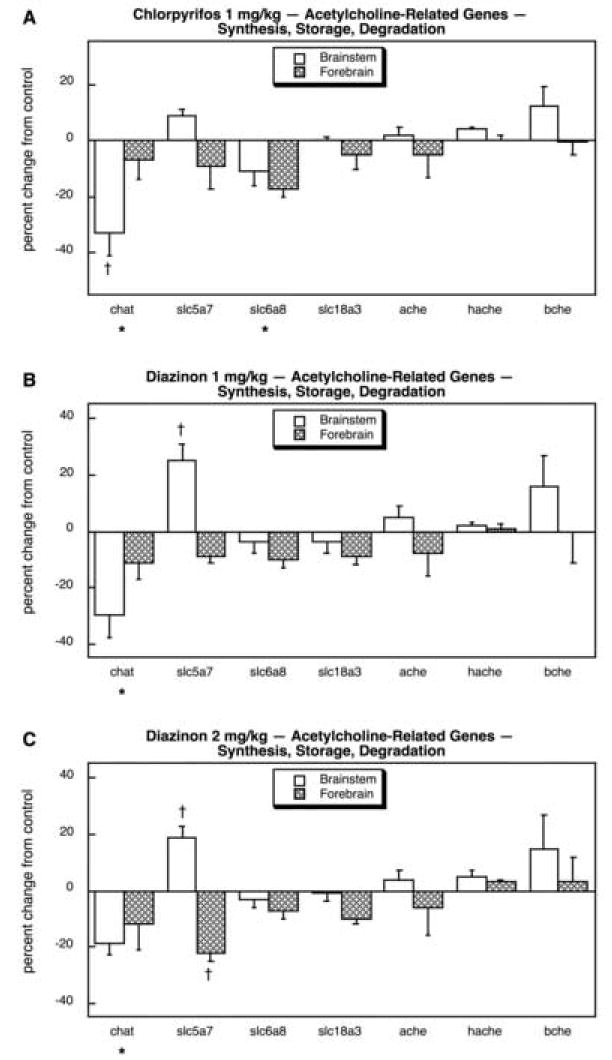
Effects of 1 mg/kg/day CPF (A), 1 mg/kg/day of DZN (B), or 2 mg/kg/day of DZN (C) on expression of acetylcholine-related genes for neurotransmitter synthesis, storage and degradation, presented as the percentage change from control values (Table 9). Asterisks shown below each gene denote a significant main treatment effect. Daggers denote genes for which a treatment × region interaction was detected and show the individual regions for which treatment effects were present. Multivariate ANOVA (all treatments, all genes, both regions) indicates an interaction of treatment × gene (p < 0.05).
Among the mAChR genes, CPF reduced the expression of only chrm5 while producing a small, significant increase in chrm2 (Fig. 17A). The lower dose of DZN also suppressed forebrain chrm5 and chrm2 but reduced brainstem chrm2 slightly (Fig. 17B), and the same pattern was seen for the higher DZN dose with the addition of an increase in brainstem chrm1 (Fig. 17C). In contrast, there were much more widespread changes in expression of the nicotinic AchR (nAChR) genes (11 out of 14; also note the different scale for Fig. 18 as compared to Fig. 17) and there were substantial differences in the effects of CPF and DZN. CPF exposure suppressed the mRNA encoding the α7 nAChR subunit (chrna7) as well as the genes for forebrain chrnb3 and chrne (Fig. 18A); chrna10 was highly induced in the forebrain. DZN produced a much more widespread effect on nAChR genes. At 1 mg/kg (Fig. 18B) there were reductions in chrna3, chrna7 (forebrain), chrna9, chrnb3 (forebrain) and chrne (forebrain); increases were seen for chrna2 and chrnb2, and for chrnd in the forebrain. At the higher dose of DZN (Fig. 18C) we obtained a similar overall pattern but also detected a suppression of chrngthat had not been seen at the lower dose.
Fig. 17.
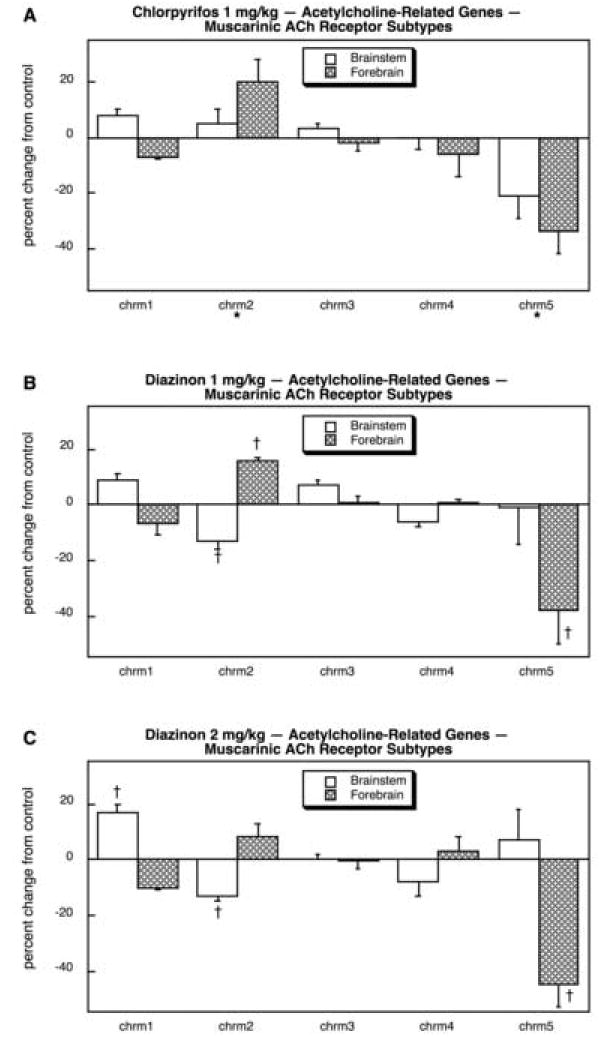
Effects of 1 mg/kg/day CPF (A), 1 mg/kg/day of DZN (B), or 2 mg/kg/day of DZN (C) on expression of acetylcholine-related genes for muscarinic ACh receptor subtypes, presented as the percentage change from control values (Table 9). Asterisks shown below each gene denote a significant main treatment effect. Daggers denote genes for which a treatment × region interaction was detected and show the individual regions for which treatment effects were present. Multivariate ANOVA (all treatments, all genes, both regions) indicates interactions of treatment × gene (p < 0.05) and treatment × gene × region (p < 0.007).
Fig. 18.
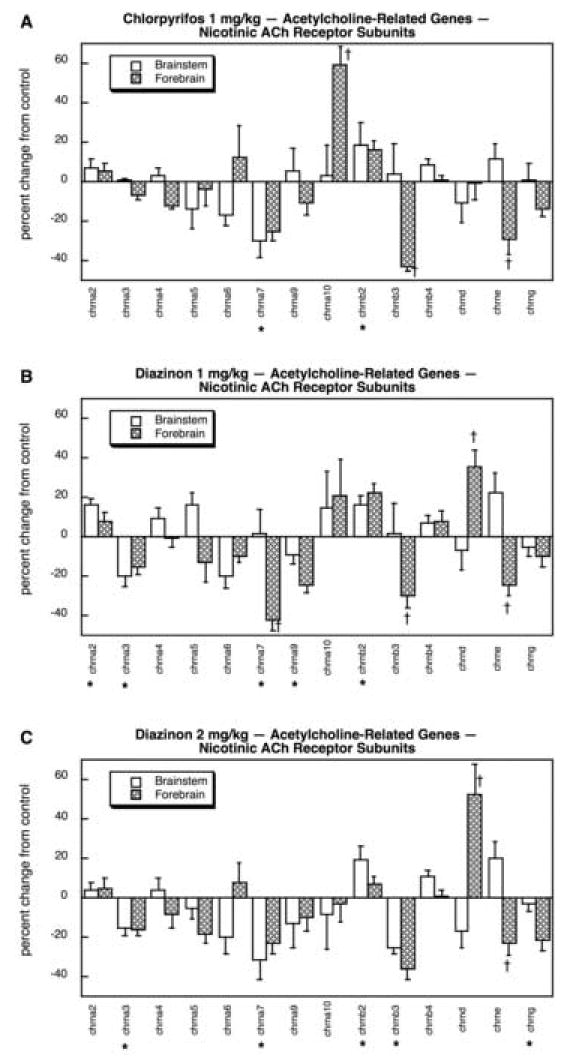
Effects of 1 mg/kg/day CPF (A), 1 mg/kg/day of DZN (B), or 2 mg/kg/day of DZN (C) on expression of acetylcholine-related genes for nicotinic ACh receptor subunits, presented as the percentage change from control values (Table 9). Asterisks shown below each gene denote a significant main treatment effect. Daggers denote genes for which a treatment × region interaction was detected and show the individual regions for which treatment effects were present. Multivariate ANOVA (all treatments, all genes, both regions) indicates interactions of treatment × gene (p < 0.05) and treatment × gene × region (p < 0.1).
Genes related to 5HT systems also showed major changes in response to organophosphate exposure (14 out of 20 genes). Of those involved in 5HT synthesis, storage and degradation, there was significant overall induction of tph and of forebrain slc18a2 (Fig. 19A). The same pattern was seen with the low dose of DZN (Fig. 19B) as well as with the high dose (Fig. 19C). Across the 14 different 5HT receptor genes, each of the treatments elicited a significant overall increase in gene expression (main effect of treatment, p < 0.05 for CPF, p < 0.03 for DZN 1 mg/kg, p < 0.0004 for DZN 2 mg/kg). For CPF (Fig. 20A), large inductions were seen for the alternative splice variant of htr2a and for forebrain htr6, whereas smaller decrements were seen for htr1a (forebrain) and htr2b (brainstem). The low dose of DZN (Fig. 20B) had even more robust effects on 5HT receptor gene expression (9 out of 14 genes affected), with significant increments in htr1b (forebrain), htr2a, the alternate splice variant of htr2a (brainstem), htr3b (brainstem), htr5a (forebrain), htr5b, htr6 (brainstem) and htr7 (brainstem); reductions were limited to htr2c and htr5a (brainstem). Notably, though, whereas CPF caused a large increase in htr2a (alternate splice) in the forebrain, DZN did not. Raising the DZN dose to 2 mg/kg extended the alterations to include a massive increase in htr1f in the forebrain that was not seen with CPF or with DZN at the lower dose but also attenuated some of the effects of DZN on the other receptor genes (Fig. 20C).
Fig. 19.
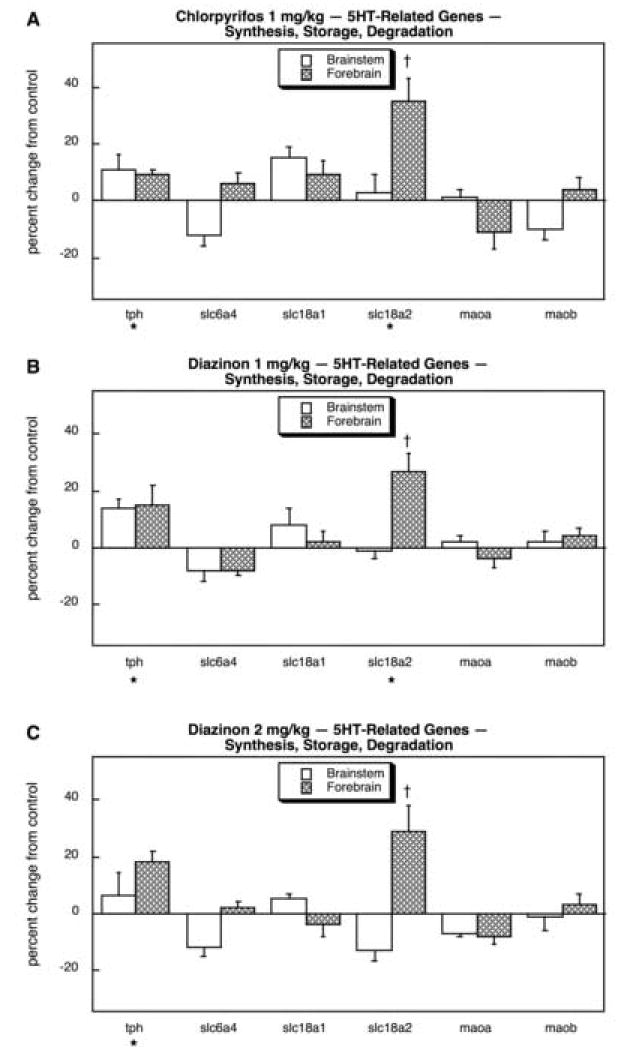
Effects of 1 mg/kg/day CPF (A), 1 mg/kg/day of DZN (B), or 2 mg/kg/day of DZN (C) on expression of 5HT-related genes for neurotransmitter synthesis, storage and degradation, presented as the percentage change from control values (Table 10). Asterisks shown below each gene denote a significant main treatment effect. Daggers denote genes for which a treatment × region interaction was detected and show the individual regions for which treatment effects were present. Multivariate ANOVA (all treatments, all genes, both regions) indicates interactions of treatment × gene (p < 0.02), treatment × region (p < 0.1) and treatment × gene × region (p < 0.08).
Fig. 20.
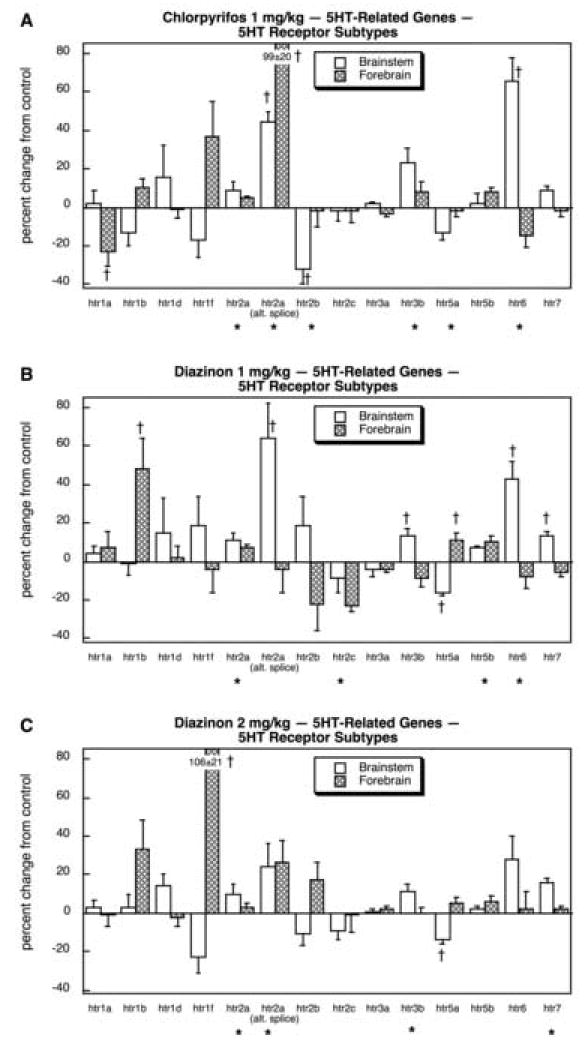
Effects of 1 mg/kg/day CPF (A), 1 mg/kg/day of DZN (B), or 2 mg/kg/day of DZN (C) on expression of 5HT receptor genes, presented as the percentage change from control values (Table 10). Asterisks shown below each gene denote a significant main treatment effect. Daggers denote genes for which a treatment × region interaction was detected and show the individual regions for which treatment effects were present. Multivariate ANOVA (all treatments, all genes, both regions) indicates a significant main treatment effect (p < 0.009) and interactions of treatment × gene (p < 0.0001), treatment × region (p < 0.0001) and treatment × gene × region (p < 0.0001).
As was true for 5HT systems, we also found major targeting of catecholaminergic systems (dopamine, norepinephrine) by the organophosphates, with two-thirds (17 out of 26) of the genes showing significant treatment differences; this includes four genes shared with 5HT systems (slc18a1, slc18a2, maoa, maob) of which only one (slc18a2) was positive, so that in terms of the unique genes studied, we actually identified changes in nearly 75%. Looking first at the components related to catecholamine synthesis and storage, we found overall upregulation (main effect) for each of the treatments, connoting promotion of the catecholaminergic phenotype: p < 0.004 for CPF, p < 0.0003 for DZN 1 mg/kg, p < 0.02 for DZN 2 mg/kg. This reflected small but extremely consistent increases in all six genes across both brain regions. For CPF (Fig. 21A), the differences were individually significant for dbh, slc6a2 (forebrain), chga and chgb. For DZN 1 mg/kg (Fig. 21B), the statistically significant effects extended to include th, and much the same pattern was seen at 2 mg/kg (Fig. 21C). In contrast, the effects on dopamine receptor genes appeared to be relatively minor. CPF produced a small (but significant) reduction in drd2 and a more impressive decline in drd4 in the brainstem (Fig. 22A). For DZN, the effect on drd4 was also seen at either 1 mg/kg (Fig. 22B) or 2 mg/kg (Fig. 22C). However, the effects on adrenergic receptor genes and modulators of adrenergic receptor function were far more robust and widespread. CPF exposure evoked a large reduction in adra1a, along with smaller but significant decrements in adra1d, adra2c (forebrain), adrb1, adrb3 and adrbk1 (Fig. 23A). A substantial increase was seen in adrbk2, along with a minor increase in adr2a (forebrain). Exposure to either the lower (Fig. 23B) or higher (Fig. 23C) dose of DZN produced virtually the same patterns.
Fig. 21.
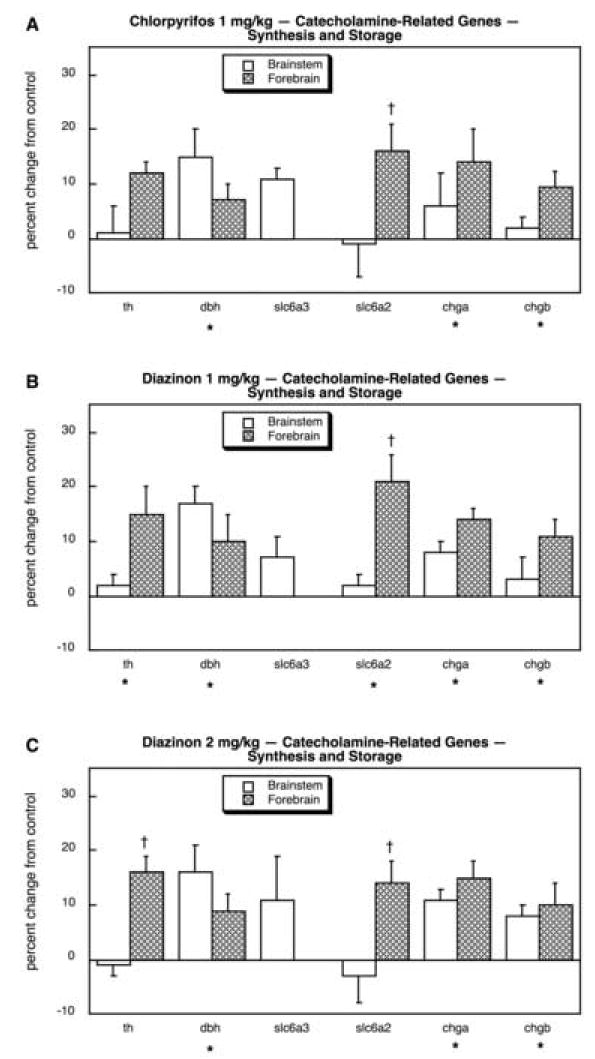
Effects of 1 mg/kg/day CPF (A), 1 mg/kg/day of DZN (B), or 2 mg/kg/day of DZN (C) on expression of catecholamine-related genes for neurotransmitter synthesis and storage and degradation, presented as the percentage change from control values (Table 11). Asterisks shown below each gene denote a significant main treatment effect. Daggers denote genes for which a treatment × region interaction was detected and show the individual regions for which treatment effects were present. Four genes related to storage and degradation of catecholamines (maoa, maob, slc18a1, slc18a2) are the same as those for 5HT (Fig. 19) and are not repeated here. Forebrain values for slc6a3 are not shown because this gene was only marginally detectable. Multivariate ANOVA (all treatments, all genes, both regions) indicates a significant main treatment effect (p < 0.004).
Fig. 22.
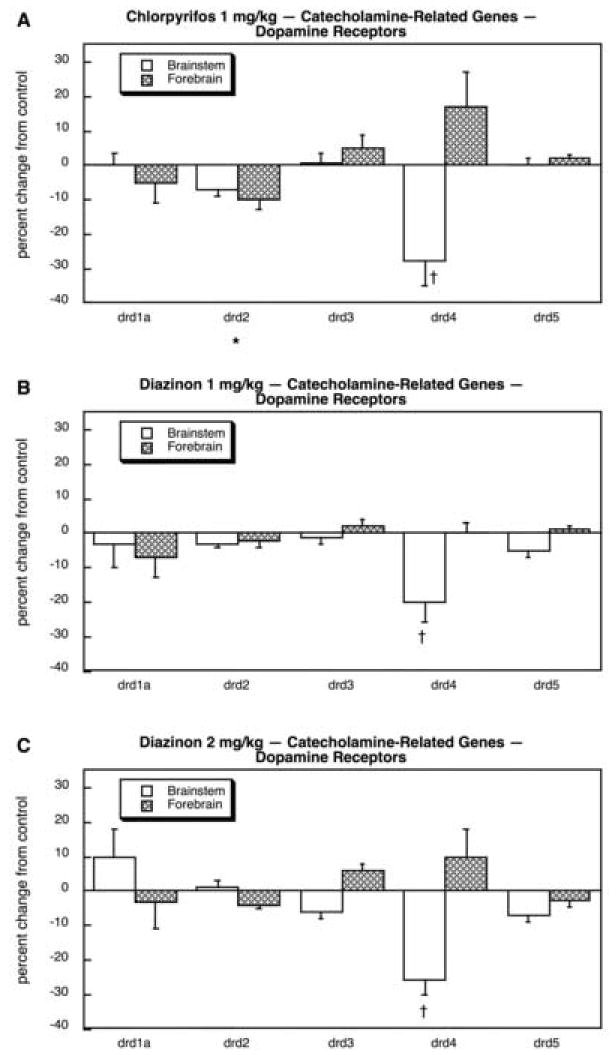
Effects of 1 mg/kg/day CPF (A), 1 mg/kg/day of DZN (B), or 2 mg/kg/day of DZN (C) on expression of dopamine receptor genes, presented as the percentage change from control values (Table 11). Asterisks shown below each gene denote a significant main treatment effect. Daggers denote genes for which a treatment × region interaction was detected and show the individual regions for which treatment effects were present. Multivariate ANOVA (all treatments, all genes, both regions) indicates an interaction of treatment × gene × region (p < 0.03).
Fig. 23.
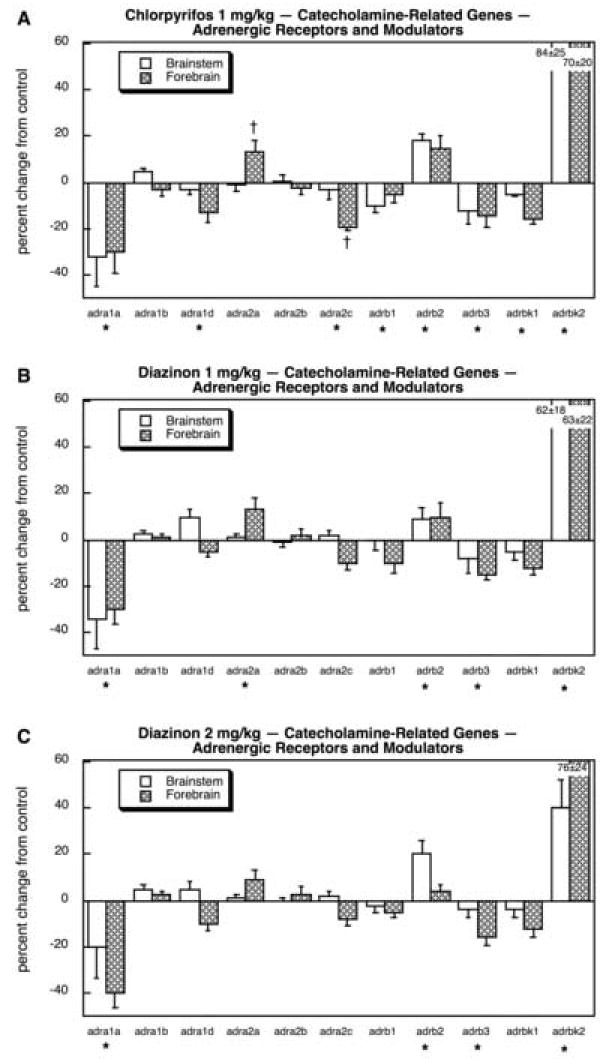
Effects of 1 mg/kg/day CPF (A), 1 mg/kg/day of DZN (B), or 2 mg/kg/day of DZN (C) on expression of adrenergic receptor genes and their modulators, presented as the percentage change from control values (Table 11). Asterisks shown below each gene denote a significant main treatment effect. Daggers denote genes for which a treatment × region interaction was detected and show the individual regions for which treatment effects were present. Multivariate ANOVA (all treatments, all genes, both regions) indicates an interaction of treatment × gene (p < 0.0001).
DISCUSSION
Strategic issues and limitations
In the current study, we used planned comparisons of defined groupings of genes defining the pathways known to be associated with the mechanisms and/or outcomes of CPF-induced developmental neurotoxicity, rather than relying on a genomewide approach. The disadvantage of this strategy is that it does not identify completely novel or unsuspected targets. On the other hand, there are distinct benefits that outweigh this liability. First, inclusion of all 42,000 transcripts generates over 2000 false-positive changes that can be accounted for only with statistical procedures that are unrelated to the biological factors that are the actual objective of the study. For example, the Bonferroni correction becomes so conservative with this large number of comparisons that few if any changes then meet the required statistical criterion. The Benjamini-Hochberg correction, although less restrictive, focuses the conclusions on genes with large fold-changes whether or not these are related to the direct biological targets of the treatment; highly-regulated genes or genes with slow turnover times tend to have small variabilities but also small fold-changes, and are thus discarded in the statistical manipulations. Similarly, the standard analytic techniques for examination of the global genomic response, such as principal component analysis, do not incorporate the fact that genes in the same pathway may bear a reciprocal relationship to each other. This is especially important for neurotransmitter systems, where presynaptic hyperactivity will upregulate genes involved in neurotransmitter synthesis and storage, while downregulating the genes related to postsynaptic receptors and signaling. For our purposes, the important factors are whether genes in a defined, related pathway show coordinated changes, regardless of the absolute magnitude or even the direction of change. With planned comparisons, we were able to restrict our analysis to 252 genes that define the target pathways, thus generating no more than 13 false-positive measurements, whereas we found significant changes in 60% of the genes, thus verifying the validity and power of this approach. It should be noted that our strongly positive findings have been achieved while examining <1% of the transcripts available from the entire rat genome, so much more information can be harvested from these determinations than have been done here. Thus, the current approach does not preclude spreading a wider net in future examinations of the data base and, having validated the interpretability of the transcriptional changes obtained in defined pathways, we fully intend to search for new mechanisms and consequences in future evaluations.
Although, as detailed below, we found clear-cut alterations in the target pathways for mechanisms and outcomes, in many cases the magnitude of the changes in gene expression were small (<50%) when compared to the fold-change achievable with in vitro studies of pesticide neurotoxicity [63]. This is not surprising, given that the brain regions are extremely heterogeneous, containing numerous types of cells and neurotransmitters, so that relatively large changes in mRNA expression in a small cluster of cells are likely to be diluted out by inclusion of larger, unaffected cell types or brain regions. Indeed, even when animals are treated with organophosphate doses above the threshold for outright signs of systemic toxicity or even lethality, the magnitude of gene expression changes in brain regions in vivo rarely exceeds 10-30% [13,28,30]. This provides yet another reason why the absolute fold-change is not necessarily a good determinant of what pathways are most critically affected by organophosphate exposure; rather, it is the coordinated pattern of changes in multiple genes in the pathway that is more important. Finally, although cell cultures may yield greater fold-changes for specific genes affected by toxicant exposure, they preclude detection of effects consequent to cell-to-cell interactions that critically define the development of the brain in vivo, so that studies of the type conducted here remain essential, albeit more challenging than comparable in vitro determinations.
Ideally, the transcriptional response to a developmental neurotoxicant should be examined not only in closely-defined brain regions but also over a detailed temporal course. Here, we examined only a single time point, 24 hr after the final dose of CPF or DZN; this limitation is a reflection of the practical difficulties of examining every possible combination of treatment, dose, region and time point that would be required to define all the essential parameters (limited chiefly by factors of cost, technical time and complexity). Without a full time course, however, it is difficult to interpret the meaning of the direction or magnitude of change for a specific gene. For example, a decrease could reflect the direct effect of CPF or DZN, or alternatively could be a rebound suppression after a period of stimulation. We can actually infer that some of the changes reflect this dichotomy by comparing the actions of the low and high dose of DZN. A direct effect should show a monotonic dose-effect relationship, viz. a greater effect with DZN 2 than with 1 mg/kg; however, for rebound changes the two doses could exert opposite effects at a single time point (e.g. a rebound could occur at the low dose whereas the high dose may still show the direct effect). The same issue can be raised where the results in the two brain regions reflect changes in opposite directions: there may actually be major regional differences, or alternatively one region may show recovery and rebound changes more quickly than the other. Our data show numerous examples of these disparities in the dose-effect relationships for DZN or in the effects on brainstem vs. forebrain.
An additional factor is that we restricted our analysis to males, a limitation imposed primarily by practical considerations of technical capabilities and cost. There are numerous studies showing significant sex differences in the pathways analyzed in our study and in the responses of these pathways to organophosphate exposure [3,6,26,60,79,89,90,94,96], and there is every reason to believe that transcriptional profiles will similarly exhibit major disparities between effects on males on females. This is obviously a subject for future study. We also did not carry out RT-PCR verification of the numerous changes seen in our array results. Verification is typically required for array studies in which all the genes on the array are evaluated, a small number found to be positive, and there are a large number of false positives (e.g. the >2000 genes that would be false positives if we had considered all 42,000 probes on the array). The PCR technique is then required to ensure that the individual genes that are interpreted as being changed are not among the false positives. For our study, we did a planned comparison of only 252 genes (only 13 false positives), found alterations in over 60% of these genes, and for interpretation, relied primarily on multiple gene changes in a given pathway rather than changes in any one gene. The odds of all those genes being false positives is astronomically small. However, even for individual genes, there were multiple probes and multiple spots on a given array (see Methods), so the changes cannot be “chance.” Unlike typical array studies, where a single sample derived from multiple animals might be evaluated, we evaluated individual animals and tissues, so again it is inconceivable that one could statistically produce these outcomes by accident. However, the best verification is that we included a positive control (CPF) for which the phenotypic outcomes are known for the actual proteins encoded by the genes in these pathways. In each case where we identify a gene expression profile below, we compare these to what is known about the effect on the proteins and function of that pathway.
Because of the complexity of the results, the discussion below will deal separately with each class of effects before providing a general conclusion.
Gene expression in normal development
We found notable differences in gene expression patterns between the brainstem and the forebrain and in general, these were consonant with the maturational timetables of the two regions and with the relative distribution of neuronal cell bodies as distinct from nerve terminal projections. The brainstem matures earlier than the forebrain [81]. Accordingly, on postnatal day 5, neurogenesis is much more complete in the brainstem and this region is further along the path to generation of neuritic projections (axons, dendrites) and myelin; on the other hand, at the same stage, the forebrain is undergoing its major growth spurt [33,81]. In keeping with these maturational differences, gap43, a gene related to neural growth, was more highly expressed in the forebrain whereas the neurofilament genes related to neurite formation and the genes encoding myelin-related proteins showed preferential expression in the brainstem. Similarly, cellular oxygen demand increases as differentiation proceeds, so that oxidative stress genes showed higher values in the brainstem; cell signaling processes, which are especially active as cells make the transition from replication to differentiation, were correspondingly expressed to a greater extent in the forebrain. The neuronal cell bodies for ACh, 5HT and catecholamine systems are largely located in the brainstem, and we found higher values for gene expression related to the synthesis and storage of these neurotransmitters in the brainstem. On the other hand, the genes for postsynaptic receptors had higher expression in the location of the nerve terminal zones of the forebrain. Thus, in addition to being informative about the underlying disparities in the regional expression of various gene families in the developing brain, the correspondence of these patterns to known maturational and anatomic differences serves as a validation for the overall approach taken here. The regional dissimilarities also interact with the effects of CPF and DZN, likely contributing to the ultimate differences in the regional targeting of neurotransmitter systems by these two organophosphates [50,86,87,89,91,97].
CPF and DZN effects on general neural cell development
Both CPF and DZN had significant effects on genes related to neural cell growth, glial cell development and myelination. The two most prominent targets for growth-related genes were gap43, which was increased by the organophosphate treatments, and nefh, which was reduced. The rise in gap43 is likely to represent an adaptive elevation to maintain overall brain growth in the face of toxicant exposures that are inherently growth-suppressing; in this study, we focused on exposures that lie below the threshold for impairment of either somatic or brain region growth, so that increased gap43 expression reflects the activation of genes required to offset the direct effects of the organophosphates. Hence, this adjustment is a molecular event that corresponds to the classical “brain sparing” that is characteristic of developmental exposures to growth-suppressing events [12,34]. On the other hand, the deficit in nefh, which encodes one of the neurofilament proteins involved in development of axons and dendrites, is likely to reflect a specific interference of the organophosphates with the development of neuritic projections, an outcome that has been noted with in vitro models [8,31,101] and is also known to occur with in vivo exposure to CPF [86,87,89]. The targeting of the brainstem for nefh suppression is consistent with the fact that the projections originate in the cell bodies within this region, and at this early stage of development, neuritic development is far more active than in the later-developing forebrain. In adults, studies with toxic exposures to sarin similarly have found suppression of nefh expression [28], so this particular effect may be “developmental” only in the sense that it can be obtained at otherwise subtoxic doses, whereas higher exposures are required to see the effect in adults. Interestingly, we also found a smaller but statistically significant increase in nef3 expression, which may represent a rebound from earlier suppression by the organophosphates, but may also represent a specific increase related to the fact that the organophosphates can have opposing effects on development of axons vs. dendrites [46].
At low level exposures, CPF is actually more toxic toward the development of astroglial cells than toward neurons [39,41,66,116] and in the present study, CPF produced a consistent suppression of genes associated with glial cell development. Interestingly, we saw a reduction in expression of the gene encoding glial fibrillary acidic protein, the prototypic astroglial biomarker [69], whereas other investigators using higher exposures that exceed the thresholds for biologically significant cholinesterase inhibition, signs of systemic toxicity and/or growth suppression, found increases in gfap [13,63]. Again, it is important to separate direct effects on glia from indirect effects related to reactive gliosis that occurs in response to neuronal cell injury [69]. Indeed, it is extremely likely that the effects on gfap are biphasic both with regard to dose and time, with early phases and low doses reflecting the direct injury to glial cells [39,66,116] and later phases and/or higher doses representing the superimposition of reactive gliosis (which increases gfap) on the direct gliotoxic actions. In support of this interpretation, our earlier evaluations with the CPF regimen used in the present study show no long-term net changes in glial fibrillary acidic protein levels [37], as expected from initial suppression and subsequent rebound (adaptive) elevations in the mRNA encoding the protein. Similarly, in adults given highly toxic treatments with sarin (0.5 × LD50), gfap is induced only for a brief period and other genes related to structural features also show the biphasic effects predicted for direct suppression followed by adaptive responses [28,30].
Our results point further to myelination as a potential target for adverse effects of organophosphates on the developing brain. CPF produced a consistent pattern of suppression of myelin-related genes, with the strongest effects on mobp and mpz. In vitro studies or in vivo evaluations that use higher doses above the threshold for systemic toxicity or growth impairment have identified mag as an additional target [13,63] and here we saw a tendency toward that effect (decreased by CPF or by either dose of DZN), although it did not achieve statistical significance at our lower, subtoxic exposures. Notably, we did not see significant changes in mbp, in keeping with earlier work showing no change in its protein product, myelin basic protein, using this particular CPF regimen [38]. This demonstrates the advantage of using microarrays to look at multiple genes related to a single cell type (oligodendrocytes) or target process (myelination) as opposed to evaluating a single gene or protein; in this case, the adverse effect on myelination are more evident than from examining just mag or mbp. We also found that DZN is distinctly different from CPF for effects on myelin, with far less of a decrease in mobp and mpz, but strong induction of myef2 and myt1, effects that were not seen for CPF. These observations suggest that the effects of the two organophosphates on oligodendrocytes are likely to differ in a major way, with potentially different outcomes for myelination even at comparable bioeffective exposures.
CPF and DZN effects on transcription control and cell signaling
The adverse effects of CPF on brain development prominently feature mechanisms centered around cell signaling cascades that control the expression and function of nuclear transcription factors required for neural cell differentiation [17,22,36,47,64,65,83,100,106]. Among the best studied is the pathway connecting GPCRs to the generation of cAMP and the downstream effectors controlled by cAMP, such as PKA and the transcription factors AP-1, Sp1 and CREB. In the current study, organophosphate exposure had profound effects on expression profiles for all three transcription factors, multiple forms of AC and PKA and their regulators, several of the PDEs which are responsible for cAMP breakdown, and the G-protein subunits themselves. Both CPF and DZN evoked widespread reductions in gene expression related to the AP-1 transcription factor, most prominently in the forebrain, the region undergoing more rapid growth and differentiation at the time of measurement (postnatal day 5). Nevertheless, there were some notable differences between CPF and DZN: first, CPF had a greater adverse overall effect on the AP-1 gene family, whereas DZN had additional effects on creb1 and sp1 that were not shared by CPF. The relative lack of effect of CPF on creb1 may seem surprising in light of the known effects of CPF on the function of this transcription factor [83] but it must be kept in mind that the primary action of CPF is likely to be on the phosphorylation state of CREB protein rather than on the transcriptional control of protein synthesis [83]. This points out an important limitation of the microarrray approach, which can detect only those changes that involve altered gene expression, and not any posttranscriptional modifications that may be equally important for functional outcomes.
Our results also indicate that AC itself is a major target for the effects of organophosphates unrelated to anticholinesterase actions [17,86,87,89,112]. Both CPF and DZN altered the expression of genes encoding multiple subtypes of AC as well as those for modulators of AC activity. Although the overall patterns for the two agents bore general similarities, there were some disparities in the magnitude of effect (e.g. greater effect of CPF on adcy1, greater effect of DZN on forebrain adcy4) that are likely to contribute further to differences in neurodevelopmental outcomes. The same basic findings were obtained for gene expression related to G-protein α-subunits, which are the actual proteins that transduce GPCR signals into stimulation or inhibition of cAMP formation: CPF and DZN produced major alterations in a wide variety of these genes with generally similar patterns (e.g. gna12, gna13, gna14, gnai2, gnai3) but some divergences (e.g. gnat1, gnaz, gnaq). One notable distinction was seen for grk1, which encodes the receptor kinase that uncouples G-proteins from their ability to signal through α-subunits: DZN had a much greater effect than CPF, suggesting a greater potential impact on receptor coupling capabilities and therefore on the efficiency of receptor signaling in general. As deficiencies in GPCR function have already been clearly established for CPF [17,64,106,114], we expect that this might be an even greater problem with DZN exposure. The specificity of these actions was demonstrated further by the relative sparsity of effects on the genes encoding the β and γ subunits of the heterotrimeric G-proteins, which showed only sporadic differences of generally smaller magnitude.
Downstream from the generation of cAMP, a wide variety of PDEs showed either up- or downregulation in response to CPF or DZN exposure and for these, there were marked differences between the two agents in terms of the specific PDEs affected, the regional targets, and the direction and magnitude of effects. CPF and low dose DZN exposure had the most disparate patterns of altered gene expression, whereas raising the DZN dose gave both patterns superimposed as well as some unique actions. Accordingly, there are basic underlying differences between the actions of CPF and DZN on PDE gene expression but some convergence at higher DZN doses which produce comparable cholinesterase inhibition to CPF [97,100]; there may thus be a transition from cholinesterase-independent to cholinesterase-related alterations as the dose is increased. In either case, because the PDEs terminate cell signaling events through their ability to hydrolyze cAMP, these alterations will actually influence the ability of the cells to transduce signals regardless of which receptor or G-proteins initiate the response, since these enzymes do not distinguish among the different potential mechanisms by which cAMP production is evoked. Accordingly, alterations in the spectrum of PDE expression will cause global changes in cAMP signaling rather than targeting a specific receptor signal. The disparities between CPF and DZN are therefore highly likely to contribute in a major way to ultimate differences in neurodevelopmental and behavioral sequelae.
The generation and degradation of cAMP ultimately converge on the activity of protein kinases that use cAMP to initiate protein phosphorylation, notably the PKA family. It is therefore of critical importance that both CPF and DZN produced major changes in gene expression related to the various PKAs and their modulators expressed in the developing brain. In general, these showed overall upregulation, possibly in reaction to the general impairment of AC signaling as noted in previous work with CPF exposure [17,64,100,106,114]. Here, too, CPF and DZN showed many basic similarities in gene expression patterns but also a few notable differences, particularly with the higher dose of DZN: loss of the prkaa1 stimulation seen with the other two treatments, and suppression of prkar2a. Accordingly, the cAMP signaling cascade seems to be a major target for adverse effects of organophosphates on brain development at virtually all levels: GPCR modulators, G-protein α-subunits, AC, PDEs and downstream signaling targets such as PKA and its modulators and, as described earlier, nuclear transcription factors that are known to be the targets for PKA phosphorylation (AP-1, Sp1, CREB). Even further, as will be discussed below, the genes related to receptor desensitization of adrenergic GPCRs are also prominently affected, which would amplify potential signaling defects for specific receptors. Finally, the selectivity of these actions is further demonstrated by the less notable impact on PKC and its modulators, which showed a much lower proportion of affected genes. That does not rule out the potential participation of post-transcriptional effects on PKC activity as a contributor to the developmental neurotoxicity of the organophosphates [112] but on the other hand it does point to more global effects on cAMP-directed mechanisms.
CPF and DZN cytotoxicity
At high doses, neuronal apoptosis and oxidative stress are wellestablished consequences of CPF exposure, both in vitro and in vivo [9,18,23,42,51,76,82,93]. Adult animals treated with systemically toxic doses of sarin show major changes in the expression of apoptosis-related genes [28]. In the current study, systemically subtoxic doses of CPF or DZN elicited changes in nearly half of the genes in the pathways for apoptosis and oxidative stress, confirming that, in the developing brain, neural cell damage occurs even at doses well below the thresholds for signs of intoxication or biologically significant cholinesterase inhibition. For apoptosis, the strongest effects were on tp53, casp9 and casp12, although other genes also showed smaller effects; the main point is that a high percentage of the overall genes sampled (8 out of 17 genes in the apoptosis pathway) showed significant differences. The same effects were seen for genes related to the generation of oxidative stress, where both CPF and DZN affected a wide range of genes in the sod, gpx and gst families, totaling 18 genes showing changes out of 32 assessed. For apoptosis, although CPF and DZN shared the effects for the three main genes, DZN had more widespread effects on bax, bmf, casp1 and casp4, implying that DZN may produce greater apoptosis than CPF. This interpretation is in keeping with recent findings that also indicate greater adverse effects from DZN from the standpoint of cell differentiation and expression of acetylcholinesterase splice variants associated with neuronal damage [50,92].
Part of the central nervous system damage caused by high doses of organophosphates results from excitotoxicity mediated by the amino acid, glutamate, through its actions on iGluRs [42] and in the adult, sarin administration at 0.5 × LD50 alters the expression of genes encoding these receptors [30]. In our studies with neonatal rats, we found major effects on iGluRs after exposure to either CPF or DZN in doses below the threshold for any signs of systemic toxicity. However, CPF exerted more substantial effects than did DZN, implying that, unlike the situation for apoptotic endpoints, CPF is likely to elicit greater excitotoxicity. This could come about in two ways. First, CPF is known to interact directly with ion channel receptors that gate calcium entry into the cell, notably the nAChRs [54,98]. To our knowledge, no one has explored a potentially similar effect on iGluR-gated channels, but if this does take place, then our results would predict a greater effect for CPF as compared to DZN. The second possibility is an indirect effect resulting from the underlying alterations in brain development, where effects on iGluRs might occur secondarily to alterations in the development of glutamate pathways. In that case, however, one would expect to see comparable changes in mGluRs. However, we actually found only sporadic effects on mGluRs without any major differences between the two agents. Our results thus point toward a specific role for iGluR-mediated mechanisms in the developmental neurotoxicity of organophosphates, and more particularly for that of CPF.
CPF and DZN effects on neurotransmitter systems
Given the minor actions of CPF or DZN treatment on mGluRs, we next turned our attention to neurotransmitter classes that are known to be highly targeted for disruption by developmental exposure to CPF [86,87,89]: ACh and the monoamine transmitters, 5HT, dopamine and norepinephrine. First and foremost, we did not observe any signs of upregulation of cholinesterase-related genes, as would be expected from biologically significant degrees of cholinesterase inhibition consequent to the actions of chlorpyrifos oxon or diazoxon, the active metabolites that are primarily responsible for anticholinesterase effects. In contrast to our results in neonatal rats given low doses of CPF or DZN, ache is highly induced when sarin is given to adult rats in doses above the threshold for lethality [29]. Given the small degree of cholinesterase inhibition by the treatments used here [97,100], there is likely to be a rapid synthesis of new enzyme molecules that offsets any inhibition simply because of the high rate of growth in the neonate and consequent rapid rise in new cholinesterase molecules [57]; under those circumstances, transcriptional activation is probably not necessary to maintain the normal level of enzyme protein. On the other hand, the probes for ache and hache on the array do not encompass different splice variants that may be preferentially induced by organophosphate treatment. Indeed, using a reverse transcriptasepolymerase chain reaction approach, we recently identified selective upregulation of the acetylcholinesterase synaptic splice variant, AChE-S, by the same DZN treatment used here, whereas CPF was ineffective. Because AChE-S is specifically associated with neurotoxic endpoints [21,71,85,102], our negative findings for global ache expression may be misleading in that effects on a specific splice variant may be masked by dilution of the mRNA from this subtype with unaffected variants. This points out an additional limitation of the microarray approach in situations where probes for multiple splice variants are not present on the array.
Notably, we did not see global downregulation of mAChR-related genes, unlike the situation reported for organophosphate treatments that exceed the threshold for biologically significant degrees of cholinesterase inhibition and consequent cholinergic hyperstimulation [13,14,28]. This is also consistent with the fact that we used relatively low CPF and DZN doses and is reinforced by the absence of major reductions in m1AChR or m2AChR receptor proteins [91,100]. However, we did see a large drop in chrm5 in the forebrain, a receptor subtype that has been only rarely examined; this might then represent a specific, direct effect on development of AChR signaling, rather than indirect effects mediated by ACh excess. Indeed, it is important to note that the m5AChR is strongly associated with dopamine projections, where they are responsible for activating dopamine synaptic function [113]. The mRNAs encoding the m5AChR and the D2-dopamine receptors are colocalized near the ventrotegmental area and substantia nigra and both are lost in parallel after administration of neurotoxins that ablate dopamine neurons [105,107]. Furthermore, CPF is known to target the dopamine neurons of the nigrostriatal pathway [53], effects that are likely to account for the relationship between organophosphate exposure and higher incidence of Parkinson Disease [52]. Thus, the profound reduction in chrm5 seen here may very well represent a specific effect of the organophosphates on developing neurons of this pathway. In support of this view, earlier work with CPF shows significant long-term deficits in dopaminergic function in parallel with deficiencies in cholinergic input to these areas [4,86,87,89,96]. Taken in this light, the promotional effect on gene transcription associated with the catecholaminergic phenotype (dopamine, norepinephrine) discussed below, may represent compensatory upregulation for underlying damage to these neurons.
Among the ACh receptor families, the effects of nAChRs were much more widespread than for mAChRs, possibly a reflection of the ability of organophosphates to interact directly with these receptors and block their function [42,68,98]. This is particularly important during brain development, where the various nAChR subtypes have specific roles in neurotrophic responses, differentiation, damage/repair, neuritic outgrowth and organophosphate neurotoxicity [7,44,95,111]. As just one example, the significant reductions in chrna7, which encodes the α7 nAChR, is consistent with the targeting of this receptor subtype by developmental CPF exposure [95]. Although α7 nAChRs are sparse when compared to the more abundant α4β2 subtype, it is the α7 unit that is overexpressed during brain development [2,15,35,84,115] and is most clearly involved in neuritic outgrowth [19,78], neurotoxicity and neuroprotection [24,40,45,58,103,104]. In addition to the common effect on chrna7, CPF and DZN had substantially disparate actions on a large number of other nAChR genes, with much more widespread consequences for DZN. Thus, although they may share the α7 nAChR-related effects on factors such as neurite outgrowth and damage/repair, there are likely to be quite different outcomes for other types of effects mediated by the various nAChR subtypes (e.g. the control of many neurotransmitter systems for which nAChR activation influences synaptic function).
It is well-established that developmental exposure to CPF or DZN compromises the development of the ACh phenotype, as typified by choline acetyltransferase, the enzyme that manufactures acetylcholine, and the choline transporter which supplies the required choline precursor to the presynaptic terminal [25,49,80,91,116]. In the current study, we found significant reductions in chat, the gene encoding choline acetyltransferase, with either CPF or DZN treatment, accompanied by alterations in the expression of choline transporter genes. However, we did not observe any corresponding change in slc18a3, which is responsible for the vesicular ACh transporter protein. This was somewhat surprising, given that there is some evidence from lower organisms that the expression of the two genes is coregulated [11]; either this is not true in higher organisms, or alternatively there may be posttranscriptional regulation of mRNA levels, or differences in specific splice variants that are not represented on the microarray. In any case, the most important comparison is that for the parallel gene families for the monoamine neurotransmitters, 5HT, dopamine and norepinephrine, we obtained significant upregulation, the opposite effect from that seen for chat. Earlier work both in vivo and in vitro suggests that one of the main adverse effects of CPF on brain development is to produce inappropriate switching of the neurotransmitter phenotype, away from ACh and toward the monoamines [4-6,25,49]. Thus, whereas neonatal CPF exposure produces a deficit in hippocampal ACh innervation and activity, 5HT systems then take over the corresponding neurobehavioral functions [3,60]. Accordingly, we found consistent increases in the genes responsible for monoamine synthesis and storage, entirely in keeping with this phenotypic switch. Interestingly, these changes were not shared by the enzymes responsible for monoamine degradation, maoa and maob, which are not specific to monoamine neurons but rather are expressed ubiquitously; this points out the specificity of the induction of the essential genes delineating the monoamine phenotype. As expected from earlier studies of synaptic proteins, synaptic function and behavior [5,6,92,97], the switch from ACh to monoamine phenotypes at the transcriptional level seen here was shared equally by both CPF and DZN.
Our results for neurotransmitter receptor genes and receptor modulators further confirm the major targeting of monoamine systems by CPF and DZN. The majority of 5HT receptor genes showed significant alterations evoked either by CPF or DZN and importantly, there were major differences in the patterns elicited by the two organophosphates. In contrast, for adrenergic receptor genes, the alterations were equally widespread but CPF and DZN had relatively similar effects. It is particularly important, though, that one of the receptor modulator genes, adrbk2, showed massive upregulation. As this gene encodes a receptor kinase that desensitizes β-adrenergic receptors, this finding reinforces the deficiencies identified in other components of the cAMP pathway, as already described, except that this particular change is likely to contribute to the specific uncoupling of responses mediated by norepinephrine. Finally, the effects on dopamine receptors were far less notable than those for 5HT or norepinephrine, limited to downregulation of drd4 in the brainstem. This does not mean that dopamine systems are generally unaffected, since the presynaptic changes that dictate transmitter phenotype were robust, as discussed earlier. Rather, it means that the postsynaptic cells that are the target for the dopamine projections do not show the corresponding degree of change in receptor expression as found for the other two monoamines.
General conclusions
Our results using planned comparisons of microarray data confirm that multiple mechanisms contribute to the developmental neurotoxicity of organophosphates, over and above contributions from the shared mechanism of cholinesterase inhibition and resultant cholinergic hyperstimulation. Indeed, in the current study we used CPF and DZN regimens that were devoid of any signs of systemic toxicity and that are known to produce either no measurable inhibition of cholinesterase, or only barely-detectable inhibition, well below the 70% threshold required for cholinergic “storm” [20,97,100]. The lack of involvement of these classical organophosphate actions was confirmed by the absence of upregulation of cholinesterase-related genes or global downregulation of the principal mAChR genes that are known to be suppressed by high doses of organophosphates. Given the wealth of information available for the noncholinesterase mechanisms and targets involved in the effects of CPF on the developing brain [39,86,87,89], we assessed the effects of CPF on gene expression in defined pathways as a validation of the microarray approach and then contrasted the results with the effects of DZN, for which much less is known. Among the groupings of gene families, we were able to identify basic similarities between the two organophosphates but also some major disparities in their transcriptional effects, differences that enable a number of predictions to be made about their comparative developmental neurotoxicity.
First, CPF and DZN showed similar effects on genes involved in neural cell growth and glial cell development, reinforcing the targeting of glia by organophosphates at otherwise subtoxic exposures [39]. However CPF and DZN elicited entirely different patterns of effects on oligodendrocyte development, which lead us to believe that the two agents will show disparate effects on myelination. Second, our results with nuclear transcription factors and cell signaling mechanisms confirm that the pathway for the formation, degradation and downstream targets of cAMP is heavily targeted by organophosphates at all levels: GPCR modulators, G-protein α-subunits, AC isoforms, PDEs, PKAs and transcription factors known to contain cAMPresponsive promoters (AP-1, Sp1, CREB). These effects even extended to factors that control specific receptor linkages to the generation of cAMP, as evidenced by robust changes in grk1 and adrbk2. Again, we observed substantial differences in the effects of CPF and DZN and in light of the critical role played by these signaling and transcriptional control mechanisms in brain development, we again expect these to contribute to distinctly different neurodevelopmental and behavioral outcomes. The relatively small effects on PKC-related genes confirm that the organophosphates do not simply target every possible signaling pathway but rather have a particular impact on cAMP-related mechanisms. Third, we identified major effects of CPF on genes involved in neural cell cytotoxicity, centering around the processes of apoptosis, oxidative stress and excitotoxic iGluRs. The latter effect was clearly distinguishable from more generalized actions on glutamate neurotransmitter systems, as there were no comparable effects on mGluRs. Here again, there were major differences between the two organophosphates, with DZN producing greater effects on apoptosis-related genes whereas CPF had more prominent actions on iGluRs.
Finally, we found major alterations in the neurotransmitter pathways known to be highly targeted by organophosphates in the developing brain [86,87,89], namely ACh and the monoamines (5HT, norepinephrine, dopamine). The major effect shared by both CPF and DZN was a suppression of the development of ACh systems and promotion of monoamine systems, results at the transcriptional level that confirm earlier work on the switching of neuronal phenotype as a final outcome [4-6,25,49]. A change in transmitter phenotype is likely to produce “miswiring” of major brain circuits, where presynaptic neurons of one phenotype are juxtaposed to postsynaptic cells containing the incorrect complement of receptors and signaling pathways, effects that have already been noted as a final outcome for both ACh and 5HT systems [3,4,48,59,60]. Superimposed on these alterations, we found specific targeting of nAChR subtypes, a likely consequence of direct interaction of organophosphates with these ion channel receptors, as well as prominent effects on the receptors for the various monoamine neurotransmitters. Unlike their similar effects on the genes delineating the development of transmitter phenotype, the effects directed toward nAChRs and 5HTRs were decidedly disparate for CPF and DZN, with DZN in particular showing greater effects on the nAChR family.
Our results thus point to three important conclusions about the comparative developmental neurotoxicity of the organophosphates. First, there are potentially different neurodevelopmental outcomes from exposures to CPF as compared to DZN, and in many ways, DZN appears to elicit greater transcriptional alterations at doses of the two agents that produce either no detectable cholinesterase inhibition or barely detectable inhibition comparable to that of the chlorpyrifos regimen. Second, the disparities in their relative targeting of the various noncholinesterase mechanisms for developmental neurotoxicity means that attempts at amelioration of adverse effects on brain development may require different strategies. For example, treatments aimed at preventing oxidative stress and neural cell apoptosis can be expected to be more important for DZN whereas iGluR antagonists may work better against CPF. Last, the approach used in the present study shows how microarrays can be used to screen for developmental neurotoxicity in a planned, comparative fashion, rather than relying on changes in the global genome that may include numerous alterations unrelated to specific target mechanisms and pathways involved in defined outcomes. By using one agent with known effects as a “gold standard,” we were able to limit the testing to a relatively small number of genes (<1% of the genome), find a high proportion of significant effects, and develop a scheme whereby compounds in the same class can be compared and characterized. There is no reason why this same comparative approach cannot be used for multiple compounds in the same class or to compare the potential for developmental neurotoxicity of other classes of compounds to the identifiable effects of organophosphates.
Acknowledgments
The authors thank Drs. Elwood Linney and Seth Kullman for assistance with technical aspects and manuscript preparation.
Abbreviations
- 5HT
5-hydroxytryptamine, serotonin
- AC
adenylyl cyclase
- ACh
acetylcholine
- ANOVA
analysis of variance
- CPF
chlorpyrifos
- DZN
diazinon
- FPR
false positive rate
- GPCR
G-protein-coupled receptors
- iGluR
ionotropic glutamate receptor
- mAChR
muscarinic acetylcholine receptor
- mGluR
metabotropic glutamate receptor
- nAChR
nicotinic acetylcholine receptor
- PDE
phosphodiesterase
- PKA
protein kinase A
- PKC
protein kinase C
Footnotes
Publisher's Disclaimer: This is a PDF file of an unedited manuscript that has been accepted for publication. As a service to our customers we are providing this early version of the manuscript. The manuscript will undergo copyediting, typesetting, and review of the resulting proof before it is published in its final citable form. Please note that during the production process errors may be discovered which could affect the content, and all legal disclaimers that apply to the journal pertain.
Research was supported by NIH ES10356.
The authors state that they have no conflicts of interest.
References
- 1.Abu-Qare AW, Abou-Donia MB. Inhibition and recovery of maternal and fetal cholinesterase enzyme activity following a single cutaneous dose of methyl parathion and diazinon, alone and in combination, in pregnant rats. J Appl Toxicol. 2001;21:307–316. doi: 10.1002/jat.761. [DOI] [PubMed] [Google Scholar]
- 2.Adams CE, Broide RS, Chen Y, Winzer-Serhan UH, Henderson TA, Leslie FM, Freedman R. Development of the α7 nicotinic cholinergic receptor in rat hippocampal formation. Dev Brain Res. 2002;139:175–187. doi: 10.1016/s0165-3806(02)00547-3. [DOI] [PubMed] [Google Scholar]
- 3.Aldridge JE, Levin ED, Seidler FJ, Slotkin TA. Developmental exposure of rats to chlorpyrifos leads to behavioral alterations in adulthood, involving serotonergic mechanisms and resembling animal models of depression. Environ Health Perspect. 2005;113:527–531. doi: 10.1289/ehp.7867. [DOI] [PMC free article] [PubMed] [Google Scholar]
- 4.Aldridge JE, Meyer A, Seidler FJ, Slotkin TA. Alterations in central nervous system serotonergic and dopaminergic synaptic activity in adulthood after prenatal or neonatal chlorpyrifos exposure. Environ Health Perspect. 2005;113:1027–1031. doi: 10.1289/ehp.7968. [DOI] [PMC free article] [PubMed] [Google Scholar]
- 5.Aldridge JE, Seidler FJ, Meyer A, Thillai I, Slotkin TA. Serotonergic systems targeted by developmental exposure to chlorpyrifos: effects during different critical periods. Environ Health Perspect. 2003;111:1736–1743. doi: 10.1289/ehp.6489. [DOI] [PMC free article] [PubMed] [Google Scholar]
- 6.Aldridge JE, Seidler FJ, Slotkin TA. Developmental exposure to chlorpyrifos elicits sex-selective alterations of serotonergic synaptic function in adulthood: critical periods and regional selectivity for effects on the serotonin transporter, receptor subtypes, and cell signaling. Environ Health Perspect. 2004;112:148–155. doi: 10.1289/ehp.6713. [DOI] [PMC free article] [PubMed] [Google Scholar]
- 7.Aluigi MG, Angelini C, Falugi C, Fossa R, Genever P, Gallus L, Layer PG, Prestipino G, Rakonczay Z, Sgro M, Thielecke H, Trombino S. Interaction between organophosphate compounds and cholinergic functions during development. Chem Biol Interact. 2005;157-158:305–316. doi: 10.1016/j.cbi.2005.10.037. [DOI] [PubMed] [Google Scholar]
- 8.Axelrad JC, Howard CV, McLean WG. The effects of acute pesticide exposure on neuroblastoma cells chronically exposed to diazinon. Toxicology. 2003;185:67–78. doi: 10.1016/s0300-483x(02)00592-9. [DOI] [PubMed] [Google Scholar]
- 9.Bagchi D, Bagchi M, Hassoun EA, Stohs SJ. In vitro and in vivo generation of reactive oxygen species, DNA damage and lactate dehydrogenase leakage by selected pesticides. Toxicology. 1995;104:129–140. doi: 10.1016/0300-483x(95)03156-a. [DOI] [PubMed] [Google Scholar]
- 10.Barone S, Das KP, Lassiter TL, White LD. Vulnerable processes of nervous system development: a review of markers and methods. Neurotoxicology. 2000;21:15–36. [PubMed] [Google Scholar]
- 11.Bejanin S, Cervini R, Mallet J, Berrard S. A unique gene organization for two cholinergic markers, choline acetyltransferase and a putative vesicular transporter of acetylcholine. J Biol Chem. 1994;269:21944–21947. [PubMed] [Google Scholar]
- 12.Bell JM, Whitmore WL, Queen KL, Orband-Miller L, Slotkin TA. Biochemical determinants of growth sparing during neonatal nutritional deprivation or enhancement: ornithine decarboxylase, polyamines, and macromolecules in brain regions and heart. Pediatr Res. 1987;22:599–604. doi: 10.1203/00006450-198711000-00024. [DOI] [PubMed] [Google Scholar]
- 13.Betancourt AM, Burgess SC, Carr RL. Effect of developmental exposure to chlorpyrifos on the expression of neurotrophin growth factors and cell-specific markers in neonatal rat brain. Toxicol Sci. 2006;92:500–506. doi: 10.1093/toxsci/kfl004. [DOI] [PubMed] [Google Scholar]
- 14.Betancourt AM, Carr RL. The effect of chlorpyrifos and chlorpyrifos-oxon on brain cholinesterase, muscarinic receptor binding, and neurotrophin levels in rats following early postnatal exposure. Toxicol Sci. 2004;77:63–71. doi: 10.1093/toxsci/kfh003. [DOI] [PubMed] [Google Scholar]
- 15.Broide RS, O′Connor LT, Smith MA, Smith JAM, Leslie FM. Developmental expression of α7 neuronal nicotinic receptor messenger RNA in rat sensory cortex and thalamus. Neuroscience. 1995;67:83–94. [Google Scholar]
- 16.Campbell CG, Seidler FJ, Slotkin TA. Chlorpyrifos interferes with cell development in rat brain regions. Brain Res Bull. 1997;43:179–189. doi: 10.1016/s0361-9230(96)00436-4. [DOI] [PubMed] [Google Scholar]
- 17.Casida JE, Quistad GB. Organophosphate toxicology: safety aspects of nonacetylcholinesterase secondary targets. Chem Res Toxicol. 2004;17:983–998. doi: 10.1021/tx0499259. [DOI] [PubMed] [Google Scholar]
- 18.Caughlan A, Newhouse K, Namgung U, Xia Z. Chlorpyrifos induces apoptosis in rat cortical neurons that is regulated by a balance between p38 and ERK/JNK MAP kinases. Toxicol Sci. 2004;78:125–134. doi: 10.1093/toxsci/kfh038. [DOI] [PubMed] [Google Scholar]
- 19.Chan J, Quik M. A role for the nicotinic α-bungarotoxin receptor in neurite outgrowth in PC12 cells. Neuroscience. 1993;56:441–451. doi: 10.1016/0306-4522(93)90344-f. [DOI] [PubMed] [Google Scholar]
- 20.Clegg DJ, van Gemert M. Determination of the reference dose for chlorpyrifos: proceedings of an expert panel. J Toxicol Environ Health. 1999;2:211–255. doi: 10.1080/109374099281179. [DOI] [PubMed] [Google Scholar]
- 21.Cohen O, Erb C, Ginzberg D, Pollak Y, Seidman S, Shoham S, Yirmiya R, Soreq H. Neuronal overexpression of ‘readthrough’ acetylcholinesterase is associated with antisense-suppressible behavioral impairments. Mol Psychiat. 2002;7:874–885. doi: 10.1038/sj.mp.4001103. [DOI] [PubMed] [Google Scholar]
- 22.Crumpton TL, Seidler FJ, Slotkin TA. Developmental neurotoxicity of chlorpyrifos in vivo and in vitro: effects on nuclear transcription factor involved in cell replication and differentiation. Brain Res. 2000;857:87–98. doi: 10.1016/s0006-8993(99)02357-4. [DOI] [PubMed] [Google Scholar]
- 23.Crumpton TL, Seidler FJ, Slotkin TA. Is oxidative stress involved in the developmental neurotoxicity of chlorpyrifos? Dev Brain Res. 2000;121:189–195. doi: 10.1016/s0165-3806(00)00045-6. [DOI] [PubMed] [Google Scholar]
- 24.Dajas-Bailador F, Lima PA, Wonnacott S. The α7 nicotinic acetylcholine receptor subtype mediates nicotine protection against NMDA excitotoxicity in primary hippocampal cultures through a Ca2+ dependent mechanism. Neuropharmacology. 2000;39:2799–2807. doi: 10.1016/s0028-3908(00)00127-1. [DOI] [PubMed] [Google Scholar]
- 25.Dam K, Garcia SJ, Seidler FJ, Slotkin TA. Neonatal chlorpyrifos exposure alters synaptic development and neuronal activity in cholinergic and catecholaminergic pathways. Dev Brain Res. 1999;116:9–20. doi: 10.1016/s0165-3806(99)00067-x. [DOI] [PubMed] [Google Scholar]
- 26.Dam K, Seidler FJ, Slotkin TA. Chlorpyrifos exposure during a critical neonatal period elicits gender-selective deficits in the development of coordination skills and locomotor activity. Dev Brain Res. 2000;121:179–187. doi: 10.1016/s0165-3806(00)00044-4. [DOI] [PubMed] [Google Scholar]
- 27.Dam K, Seidler FJ, Slotkin TA. Transcriptional biomarkers distinguish between vulnerable periods for developmental neurotoxicity of chlorpyrifos: implications for toxicogenomics. Brain Res Bull. 2003;59:261–265. doi: 10.1016/s0361-9230(02)00874-2. [DOI] [PubMed] [Google Scholar]
- 28.Damodaran TV, Greenfield ST, Patel AG, Dressman HK, Lin SK, Abou-Donia MB. Toxicogenomic studies of the rat brain at an early time point following acute sarin exposure. Neurochemical Research. 2006;31:367–381. doi: 10.1007/s11064-005-9023-5. [DOI] [PubMed] [Google Scholar]
- 29.Damodaran TV, Jones KH, Patel AG, Abou-Donia MB. Sarin (nerve agent GB)-induced differential expression of mRNA coding for the acetylcholinesterase gene in the rat central nervous system. Biochem Pharmacol. 2003;65:2041–2047. doi: 10.1016/s0006-2952(03)00160-6. [DOI] [PubMed] [Google Scholar]
- 30.Damodaran TV, Patel AG, Greenfield ST, Dressman HK, Lin SM, Abou-Donia MB. Gene expression profiles of the rat brain both immediately and 3 months following acute sarin exposure. Biochem Pharmacol. 2006;71:497–520. doi: 10.1016/j.bcp.2005.10.051. [DOI] [PubMed] [Google Scholar]
- 31.Das KP, Barone S. Neuronal differentiation in PC12 cells is inhibited by chlorpyrifos and its metabolites: is acetylcholinesterase inhibition the site of action? . Toxicol Appl Pharmacol. 1999;160:217–230. doi: 10.1006/taap.1999.8767. [DOI] [PubMed] [Google Scholar]
- 32.De Peyster A, Willis WO, Molgaard CA, MacKendrick TM, Walker C. Cholinesterase and self-reported pesticide exposure among pregnant women. Arch Environ Health. 1993;48:348–352. doi: 10.1080/00039896.1993.9936724. [DOI] [PubMed] [Google Scholar]
- 33.Dobbing J, Sands J. Comparative aspects of the brain growth spurt. Early Human Dev. 1979;3:79–83. doi: 10.1016/0378-3782(79)90022-7. [DOI] [PubMed] [Google Scholar]
- 34.Dodge PR, Prensky AL, Feigin RD. In: Nutrition and the Developing Nervous System. Mosby CV, editor. St Louis MO: 1975. [Google Scholar]
- 35.Falk L, Nordberg A, Seiger A, Kjaeldgaard A, Hellstrom-Lindahl E. The α7 nicotinic receptors in human fetal brain and spinal cord. J Neurochem. 2002;80:457–465. doi: 10.1046/j.0022-3042.2001.00714.x. [DOI] [PubMed] [Google Scholar]
- 36.Garcia SJ, Seidler FJ, Crumpton TL, Slotkin TA. Does the developmental neurotoxicity of chlorpyrifos involve glial targets? Macromolecule synthesis, adenylyl cyclase signaling, nuclear transcription factors, and formation of reactive oxygen in C6 glioma cells. Brain Res. 2001;891:54–68. doi: 10.1016/s0006-8993(00)03189-9. [DOI] [PubMed] [Google Scholar]
- 37.Garcia SJ, Seidler FJ, Qiao D, Slotkin TA. Chlorpyrifos targets developing glia: effects on glial fibrillary acidic protein. Dev Brain Res. 2002;133:151–161. doi: 10.1016/s0165-3806(02)00283-3. [DOI] [PubMed] [Google Scholar]
- 38.Garcia SJ, Seidler FJ, Slotkin TA. Developmental neurotoxicity elicited by prenatal or postnatal chlorpyrifos exposure: effects on neurospecific proteins indicate changing vulnerabilities. Environ Health Perspect. 2003;111:297–303. doi: 10.1289/ehp.5791. [DOI] [PMC free article] [PubMed] [Google Scholar]
- 39.Garcia SJ, Seidler FJ, Slotkin TA. Developmental neurotoxicity of chlorpyrifos: targeting glial cells. Environ Toxicol Pharmacol. 2005;19:455–461. doi: 10.1016/j.etap.2004.12.007. [DOI] [PubMed] [Google Scholar]
- 40.Guan ZZ, Zhang X, Mousavi M, Tian JY, Unger C, Nordberg A. Reduced expression of neuronal nicotinic acetylcholine receptors during the early stages of damage by oxidative stress in PC12 cells. J Neurosci Res. 2001;66:551–558. doi: 10.1002/jnr.1245. [DOI] [PubMed] [Google Scholar]
- 41.Guizzetti M, Pathak S, Giordano G, Costa LG. Effect of organophosphorus insecticides and their metabolites on astroglial cell proliferation. Toxicology. 2005;215:182–190. doi: 10.1016/j.tox.2005.07.004. [DOI] [PubMed] [Google Scholar]
- 42.Gupta RC. Brain regional heterogeneity and toxicological mechanisms of organophosphates and carbamates. Toxicol Mech Meth. 2004;14:103–143. doi: 10.1080/15376520490429175. [DOI] [PubMed] [Google Scholar]
- 43.Gurunathan S, Robson M, Freeman N, Buckley B, Roy A, Meyer R, Bukowski J, Lioy PJ. Accumulation of chlorpyrifos on residential surfaces and toys accessible to children. Environ Health Perspect. 1998;106:9–16. doi: 10.1289/ehp.981069. [DOI] [PMC free article] [PubMed] [Google Scholar]
- 44.Hassel B. Nicotinic mechanisms contribute to soman-induced symptoms and lethality. Neurotoxicology. 2006;27:501–507. doi: 10.1016/j.neuro.2006.01.007. [DOI] [PubMed] [Google Scholar]
- 45.Hejmadi MV, Dajas-Bailador F, Barns SM, Jones B, Wonnacott S. Neuroprotection by nicotine against hypoxia-induced apoptosis in cortical cultures involves activation of multiple nicotinic acetylcholine receptor subtypes. Mol Cell Neurosci. 2003;24:779–786. doi: 10.1016/s1044-7431(03)00244-6. [DOI] [PubMed] [Google Scholar]
- 46.Howard AS, Bucelli R, Jett DA, Bruun D, Yang DR. Chlorpyrifos exerts opposing effects on axonal and dendritic growth in primary neuronal cultures. Toxicol Appl Pharmacol. 2005;207:112–124. doi: 10.1016/j.taap.2004.12.008. [DOI] [PubMed] [Google Scholar]
- 47.Huff RA, Abu-Qare AW, Abou-Donia MB. Effects of sub-chronic in vivo chlorpyrifos exposure on muscarinic receptors and adenylate cyclase of rat striatum. Arch Toxicol. 2001;75:480–486. doi: 10.1007/s002040100269. [DOI] [PubMed] [Google Scholar]
- 48.Icenogle LM, Christopher C, Blackwelder WP, Caldwell DP, Qiao D, Seidler FJ, Slotkin TA, Levin ED. Behavioral alterations in adolescent and adult rats caused by a brief subtoxic exposure to chlorpyrifos during neurulation. Neurotoxicol Teratol. 2004;26:95–101. doi: 10.1016/j.ntt.2003.09.001. [DOI] [PubMed] [Google Scholar]
- 49.Jameson RR, Seidler FJ, Qiao D, Slotkin TA. Chlorpyrifos affects phenotypic outcomes in a model of mammalian neurodevelopment: critical stages targeting differentiation in PC12 cells. Environ Health Perspect. 2006;114:667–672. doi: 10.1289/ehp.8750. [DOI] [PMC free article] [PubMed] [Google Scholar]
- 50.Jameson RR, Seidler FJ, Slotkin TA. Nonenzymatic functions of acetylcholinesterase splice variants in the developmental neurotoxicity of organophosphates: chlorpyrifos, chlorpyrifos oxon and diazinon. Environ Health Perspect. 2006 doi: 10.1289/ehp.9487. in press. [DOI] [PMC free article] [PubMed] [Google Scholar]
- 51.Jett DA, Navoa RV. In vitro and in vivo effects of chlorpyrifos on glutathione peroxidase and catalase in developing rat brain. Neurotoxicology. 2000;21:141–145. [PubMed] [Google Scholar]
- 52.Kamel F, Hoppin JA. Association of pesticide exposure with neurologic dysfunction and disease. Environ Health Perspect. 2004;112:950–958. doi: 10.1289/ehp.7135. [DOI] [PMC free article] [PubMed] [Google Scholar]
- 53.Karen DJ, Li W, Harp PR, Gillette JS, Bloomquist JR. Striatal dopaminergic pathways as a target for the insecticides permethrin and chlorpyrifos. Neurotoxicology. 2001;22:811–817. doi: 10.1016/s0161-813x(01)00063-8. [DOI] [PubMed] [Google Scholar]
- 54.Katz EJ, Cortes VI, Eldefrawi ME, Eldefrawi AT. Chlorpyrifos, parathion, and their oxons bind to and desensitize a nicotinic acetylcholine receptor: relevance to their toxicities. Toxicol Appl Pharmacol. 1997;146:227–236. doi: 10.1006/taap.1997.8201. [DOI] [PubMed] [Google Scholar]
- 55.Landrigan PJ. Pesticides and polychlorinated biphenyls (PCBs): an analysis of the evidence that they impair children′s neurobehavioral development. Mol Genet Metab. 2001;73:11–17. doi: 10.1006/mgme.2001.3177. [DOI] [PubMed] [Google Scholar]
- 56.Landrigan PJ, Claudio L, Markowitz SB, Berkowitz GS, Brenner BL, Romero H, Wetmur JG, Matte TD, Gore AC, Godbold JH, Wolff MS. Pesticides and inner-city children: exposures, risks, and prevention. Environ Health Perspect. 1999;107(suppl 3):431–437. doi: 10.1289/ehp.99107s3431. [DOI] [PMC free article] [PubMed] [Google Scholar]
- 57.Lassiter TL, Padilla S, Mortensen SR, Chanda SM, Moser VC, Barone S. Gestational exposure to chlorpyrifos: apparent protection of the fetus? Toxicol Appl Pharmacol. 1998;152:56–65. doi: 10.1006/taap.1998.8514. [DOI] [PubMed] [Google Scholar]
- 58.Laudenbach V, Medja F, Zoli M, Rossi FM, Evrard P, Changeux JP, Gressens P. Selective activation of central subtypes of the nicotinic acetylcholine receptor has opposite effects on neonatal excitotoxic brain injuries. FASEB J. 2002;16:423–425. doi: 10.1096/fj.01-0532fje. [DOI] [PubMed] [Google Scholar]
- 59.Levin ED, Addy N, Baruah A, Elias A, Christopher NC, Seidler FJ, Slotkin TA. Prenatal chlorpyrifos exposure in rats causes persistent behavioral alterations. Neurotoxicol Teratol. 2002;24:733–741. doi: 10.1016/s0892-0362(02)00272-6. [DOI] [PubMed] [Google Scholar]
- 60.Levin ED, Addy N, Christopher NC, Seidler FJ, Slotkin TA. Persistent behavioral consequences of neonatal chlorpyrifos exposure in rats. Dev Brain Res. 2001;130:83–89. doi: 10.1016/s0165-3806(01)00215-2. [DOI] [PubMed] [Google Scholar]
- 61.Mankame T, Hokanson R, Fudge R, Chowdhary R, Busbee D. Alteration of gene expression in human cells treated with the agricultural chemical diazinon: possible interaction in fetal development. Human Exp Toxicol. 2006;25:225–233. doi: 10.1191/0960327106ht622oa. [DOI] [PubMed] [Google Scholar]
- 62.May M. Disturbing behavior: neurotoxic effects in children. Environ Health Perspect. 2000 ;108:A262–A267. doi: 10.1289/ehp.108-a262. [DOI] [PMC free article] [PubMed] [Google Scholar]
- 63.Mense SM, Sengupta A, Lan C, Zhou M, Bentsman G, Volsky DJ, Whyatt RM, Perera FP, Zhang L. The common insecticides cyfluthrin and chlorpyrifos alter the expression of a subset of genes with diverse functions in primary human astrocytes. Toxicol Sci. 2006;93:125–135. doi: 10.1093/toxsci/kfl046. [DOI] [PubMed] [Google Scholar]
- 64.Meyer A, Seidler FJ, Aldridge JE, Tate CA, Cousins MM, Slotkin TA. Critical periods for chlorpyrifos-induced developmental neurotoxicity: alterations in adenylyl cyclase signaling in adult rat brain regions after gestational or neonatal exposure. Environ Health Perspect. 2004;112:295–301. doi: 10.1289/ehp.6755. [DOI] [PMC free article] [PubMed] [Google Scholar]
- 65.Meyer A, Seidler FJ, Cousins MM, Slotkin TA. Developmental neurotoxicity elicited by gestational exposure to chlorpyrifos: when is adenylyl cyclase a target? Environ Health Perspect. 2003;111:1871–1876. doi: 10.1289/ehp.6468. [DOI] [PMC free article] [PubMed] [Google Scholar]
- 66.Monnet-Tschudi F, Zurich MG, Schilter B, Costa LG, Honegger P. Maturation-dependent effects of chlorpyrifos and parathion and their oxygen analogs on acetylcholinesterase and neuronal and glial markers in aggregating brain cell cultures. Toxicol Appl Pharmacol. 2000;165:175–183. doi: 10.1006/taap.2000.8934. [DOI] [PubMed] [Google Scholar]
- 67.Morale A, Coniglio L, Angelini C, Cimoli G, Bolla A, Alleteo D, Russo P, Falugi C. Biological effects of a neurotoxic pesticide at low concentrations on sea urchin early development: a teratogenic assay. Chemosphere. 1998;37:3001–3010. doi: 10.1016/s0045-6535(98)00341-5. [DOI] [PubMed] [Google Scholar]
- 68.Nagata K, Huang CS, Song JH, Narahashi T. Direct actions of anticholinesterases on the neuronal nicotinic acetylcholine receptor channels. Brain Res. 1997;769:211–218. doi: 10.1016/s0006-8993(97)00707-5. [DOI] [PubMed] [Google Scholar]
- 69.O′Callaghan JP. Neurotypic and gliotypic proteins as biochemical markers of neurotoxicity. Neurotoxicol Teratol. 1988;10:445–452. doi: 10.1016/0892-0362(88)90006-2. [DOI] [PubMed] [Google Scholar]
- 70.Ostrea EM, Morales V, Ngoumgna E, Prescilla R, Tan E, Hernandez E, Ramirez GB, Cifra HL, Manlapaz ML. Prevalence of fetal exposure to environmental toxins as determined by meconium analysis. Neurotoxicology. 2002;23:329–339. doi: 10.1016/s0161-813x(02)00077-3. [DOI] [PubMed] [Google Scholar]
- 71.Perrier NA, Salani M, Falasca C, Bon S, Augusti-Tocco G, Massoulie J. The readthrough variant of acetylcholinesterase remains very minor after heat shock, organophosphate inhibition and stress, in cell culture and in vivo. J Neurochem. 2005;94:629–638. doi: 10.1111/j.1471-4159.2005.03140.x. [DOI] [PubMed] [Google Scholar]
- 72.Physicians for Social Responsibility . Pesticides and Children. Physicians for Social Responsibility; Washington DC: 1995. [Google Scholar]
- 73.Pope CN. Organophosphorus pesticides: do they all have the same mechanism of toxicity? J Toxicol Environ Health. 1999;2:161–181. doi: 10.1080/109374099281205. [DOI] [PubMed] [Google Scholar]
- 74.Qiao D, Seidler FJ, Padilla S, Slotkin TA. Developmental neurotoxicity of chlorpyrifos: What is the vulnerable period? Environ Health Perspect. 2002;110:1097–1103. doi: 10.1289/ehp.021101097. [DOI] [PMC free article] [PubMed] [Google Scholar]
- 75.Qiao D, Seidler FJ, Slotkin TA. Developmental neurotoxicity of chlorpyrifos modeled in vitro: comparative effects of metabolites and other cholinesterase inhibitors on DNA synthesis in PC12 and C6 cells. Environ Health Perspect. 2001;109:909–913. doi: 10.1289/ehp.01109909. [DOI] [PMC free article] [PubMed] [Google Scholar]
- 76.Qiao D, Seidler FJ, Slotkin TA. Oxidative mechanisms contributing to the developmental neurotoxicity of nicotine and chlorpyrifos. Toxicol Appl Pharmacol . 2005;206 :17–26. doi: 10.1016/j.taap.2004.11.003. [DOI] [PubMed] [Google Scholar]
- 77.Qiao D, Seidler FJ, Tate CA, Cousins MM, Slotkin TA. Fetal chlorpyrifos exposure: adverse effects on brain cell development and cholinergic biomarkers emerge postnatally and continue into adolescence and adulthood. Environ Health Perspect. 2003;111:536–544. doi: 10.1289/ehp.5828. [DOI] [PMC free article] [PubMed] [Google Scholar]
- 78.Quik M, Chan J, Patrick J. α-Bungarotoxin blocks the nicotinic receptor mediated increase in cell number in a neuroendocrine cell line. Brain Res. 1994;655:161–167. doi: 10.1016/0006-8993(94)91610-1. [DOI] [PubMed] [Google Scholar]
- 79.Ricceri L, Venerosi A, Capone F, Cometa MF, Lorenzini P, Fortuna S, Calamendrei G. Developmental neurotoxicity of organophosphorous pesticides: fetal and neonatal exposure to chlorpyrifos alters sex-specific behaviors at adulthood in mice. Toxicol Sci. 2006;93:105–113. doi: 10.1093/toxsci/kfl032. [DOI] [PubMed] [Google Scholar]
- 80.Richardson JR, Chambers JE. Effects of repeated oral postnatal exposure to chlorpyrifos on cholinergic neurochemistry in developing rats. Toxicol Sci. 2005;84:352–359. doi: 10.1093/toxsci/kfi081. [DOI] [PubMed] [Google Scholar]
- 81.Rodier PM. Structural-functional relationships in experimentally induced brain damage. Prog Brain Res. 1988;73:335–348. doi: 10.1016/S0079-6123(08)60514-2. [DOI] [PubMed] [Google Scholar]
- 82.Roy TS, Andrews JE, Seidler FJ, Slotkin TA. Chlorpyrifos elicits mitotic abnormalities and apoptosis in neuroepithelium of cultured rat embryos. Teratology. 1998;58:62–68. doi: 10.1002/(SICI)1096-9926(199808)58:2<62::AID-TERA7>3.0.CO;2-2. [DOI] [PubMed] [Google Scholar]
- 83.Schuh RA, Lein PJ, Beckles RA, Jett DA. Noncholinesterase mechanisms of chlorpyrifos neurotoxicity: altered phosphorylation of Ca2+/cAMP response element binding protein in cultured neurons. Toxicol Appl Pharmacol. 2002;182:176–185. doi: 10.1006/taap.2002.9445. [DOI] [PubMed] [Google Scholar]
- 84.Shacka JJ, Robinson SE. Postnatal developmental regulation of neuronal nicotinic receptor subunit α7 and multiple α4 and β2 mRNA species in the rat. Dev Brain Res. 1998;109:67–75. doi: 10.1016/s0165-3806(98)00058-3. [DOI] [PubMed] [Google Scholar]
- 85.Shohami E, Kaufer D, Chen Y, Seidman S, Cohen O, Ginzberg D, Melamed-Book N, Yirmiya R, Soreq H. Antisense prevention of neuronal damages following head injury in mice. J Mol Med. 2000;78:228–236. doi: 10.1007/s001090000104. [DOI] [PubMed] [Google Scholar]
- 86.Slotkin TA. Developmental cholinotoxicants: nicotine and chlorpyrifos. Environ Health Perspect. 1999;107(suppl 1):71–80. doi: 10.1289/ehp.99107s171. [DOI] [PMC free article] [PubMed] [Google Scholar]
- 87.Slotkin TA. Cholinergic systems in brain development and disruption by neurotoxicants: nicotine, environmental tobacco smoke, organophosphates. Toxicol Appl Pharmacol. 2004;198:132–151. doi: 10.1016/j.taap.2003.06.001. [DOI] [PubMed] [Google Scholar]
- 88.Slotkin TA. Guidelines for developmental neurotoxicity and their impact on organophosphate pesticides: a personal view from an academic perspective. NeuroToxicology. 2004;25:631–640. doi: 10.1016/S0161-813X(03)00050-0. [DOI] [PubMed] [Google Scholar]
- 89.Slotkin TA. Developmental neurotoxicity of organophosphates: a case study of chlorpyrifos. In: Gupta RC, editor. Toxicity of Organophosphate and Carbamate Pesticides . Elsevier Academic Press; San Diego: 2005 . pp. 293–314. [Google Scholar]
- 90.Slotkin TA, Cousins MM, Tate CA, Seidler FJ. Persistent cholinergic presynaptic deficits after neonatal chlorpyrifos exposure. Brain Res. 2001;902:229–243. doi: 10.1016/s0006-8993(01)02387-3. [DOI] [PubMed] [Google Scholar]
- 91.Slotkin TA, Levin ED, Seidler FJ. Comparative developmental neurotoxicity of organophosphate insecticides: effects on brain development are separable from systemic toxicity. Environ Health Perspect. 2006;114:746–751. doi: 10.1289/ehp.8828. [DOI] [PMC free article] [PubMed] [Google Scholar]
- 92.Slotkin TA, MacKillop EA, Ryde IT, Tate CA, Seidler FJ. Environ Health Perspect. 2006 . Screening for developmental neurotoxicity using PC12 cells: comparisons of organophosphates with a carbamate, an organochlorine and divalent nickel. in press. [DOI] [PMC free article] [PubMed] [Google Scholar]
- 93.Slotkin TA, Oliver CA, Seidler FJ. Critical periods for the role of oxidative stress in the developmental neurotoxicity of chlorpyrifos and terbutaline, alone or in combination. Dev Brain Res. 2005;157:172–180. doi: 10.1016/j.devbrainres.2005.04.001. [DOI] [PubMed] [Google Scholar]
- 94.Slotkin TA, Seidler FJ. Prenatal chlorpyrifos exposure elicits presynaptic serotonergic and dopaminergic hyperactivity at adolescence: critical periods for regional and sexselective effects. Reprod Toxicol. 2007 doi: 10.1016/j.reprotox.2006.07.010. in press. [DOI] [PubMed] [Google Scholar]
- 95.Slotkin TA, Southard MC, Adam SJ, Cousins MM, Seidler FJ. α7 Nicotinic acetylcholine receptors targeted by cholinergic developmental neurotoxicants: nicotine and chlorpyrifos. Brain Res Bull. 2004;64:227–235. doi: 10.1016/j.brainresbull.2004.07.005. [DOI] [PubMed] [Google Scholar]
- 96.Slotkin TA, Tate CA, Cousins MM, Seidler FJ. Functional alterations in CNS catecholamine systems in adolescence and adulthood after neonatal chlorpyrifos exposure. Dev Brain Res. 2002;133:163–173. doi: 10.1016/s0165-3806(02)00284-5. [DOI] [PubMed] [Google Scholar]
- 97.Slotkin TA, Tate CA, Ryde IT, Levin ED, Seidler FJ. Organophosphate insecticides target the serotonergic system in developing rat brain regions: disparate effects of diazinon and parathion at doses spanning the threshold for cholinesterase inhibition. Environ Health Perspect. 2006;114:1542–1546. doi: 10.1289/ehp.9337. [DOI] [PMC free article] [PubMed] [Google Scholar]
- 98.Smulders CJ, Bueters TJ, Vailati S, van Kleef RG, Vijverberg HP. Block of neuronal nicotinic acetylcholine receptors by organophosphate insecticides. Toxicol Sci. 2004;82:545–554. doi: 10.1093/toxsci/kfh269. [DOI] [PubMed] [Google Scholar]
- 99.Snedecor GW, Cochran WG. Statistical Methods. Iowa State University Press; Ames, Iowa: 1967. [Google Scholar]
- 100.Song X, Seidler FJ, Saleh JL, Zhang J, Padilla S, Slotkin TA. Cellular mechanisms for developmental toxicity of chlorpyrifos: targeting the adenylyl cyclase signaling cascade. Toxicol Appl Pharmacol. 1997;145:158–174. doi: 10.1006/taap.1997.8171. [DOI] [PubMed] [Google Scholar]
- 101.Song X, Violin JD, Seidler FJ, Slotkin TA. Modeling the developmental neurotoxicity of chlorpyrifos in vitro: macromolecule synthesis in PC12 cells. Toxicol Appl Pharmacol. 1998;151:182–191. doi: 10.1006/taap.1998.8424. [DOI] [PubMed] [Google Scholar]
- 102.Sternfeld M, Shoham S, Klein O, Flores-Flores C, Evron T, Idelson GH, Kitsberg D, Patrick JW, Soreq H. Excess "read-through" acetylcholinesterase attenuates but the "synaptic" variant intensifies neurodeterioration correlates. Proc Natl Acad Sci. 2000;97:8647–8652. doi: 10.1073/pnas.140004597. [DOI] [PMC free article] [PubMed] [Google Scholar]
- 103.Utsugisawa K, Nagane Y, Obara D, Tohgi H. Overexpression of α7 nicotinic acetylcholine receptor prevents G1-arrest and DNA fragmentation in PC12 cells after hypoxia. J Neurochem. 2002;81:497–505. doi: 10.1046/j.1471-4159.2002.00823.x. [DOI] [PubMed] [Google Scholar]
- 104.Verbois SL, Scheff SW, Pauly JR. Time-dependent changes in rat brain cholinergic receptor expression after experimental brain injury. J Neurotrauma. 2002;19:1569–1585. doi: 10.1089/089771502762300238. [DOI] [PubMed] [Google Scholar]
- 105.Vilaro MT, Palacios JM, Mengod G. Localization of m5 muscarinic mRNA in rat brain examined by in situ hybridization histochemistry. Neurosci Lett. 1990 ;114:154–159. doi: 10.1016/0304-3940(90)90064-g. [DOI] [PubMed] [Google Scholar]
- 106.Ward TR, Mundy WR. Organophosphorus compounds preferentially affect second messenger systems coupled to M2/M4 receptors in rat frontal cortex. Brain Res Bull. 1996;39:49–55. doi: 10.1016/0361-9230(95)02044-6. [DOI] [PubMed] [Google Scholar]
- 107.Weiner DM, Levey AI, Brann MR. Expression of muscarinic acetylcholine and dopamine receptor mRNAs in rat basal ganglia. Proc Natl Acad Sci. 1990 ;87:7050–7054. doi: 10.1073/pnas.87.18.7050. [DOI] [PMC free article] [PubMed] [Google Scholar]
- 108.Weiss B, Amler S, Amler RW. Pesticides. Pediatrics. 2004;113:1030–1036. [PubMed] [Google Scholar]
- 109.Whitney KD, Seidler FJ, Slotkin TA. Developmental neurotoxicity of chlorpyrifos: cellular mechanisms. Toxicol Appl Pharmacol. 1995;134:53–62. doi: 10.1006/taap.1995.1168. [DOI] [PubMed] [Google Scholar]
- 110.Whyatt RM, Camann DE, Kinney PL, Reyes A, Ramirez J, Dietrich J, Diaz D, Holmes D, Perera FP. Residential pesticide use during pregnancy among a cohort of urban minority women. Environ Health Perspect. 2002;110:507–514. doi: 10.1289/ehp.02110507. [DOI] [PMC free article] [PubMed] [Google Scholar]
- 111.Wu YJ, Harp P, Yan XR, Pope CN. Nicotinic autoreceptor function in rat brain during maturation and aging: possible differential sensitivity to organophosphorus anticholinesterases. Chem Biol Interact. 2003;142:255–268. doi: 10.1016/s0009-2797(02)00121-7. [DOI] [PubMed] [Google Scholar]
- 112.Yanai J, Vatury O, Slotkin TA. Cell signaling as a target and underlying mechanism for neurobehavioral teratogenesis. Ann NY Acad Sci. 2002;965:473–478. doi: 10.1111/j.1749-6632.2002.tb04188.x. [DOI] [PubMed] [Google Scholar]
- 113.Yeomans JS, Forster G, Blaha C. M5 muscarinic receptors are needed for slow activation of dopamine neurons and for rewarding brain stimulation. Life Sci. 2001;68:2449–2456. doi: 10.1016/s0024-3205(01)01038-4. [DOI] [PubMed] [Google Scholar]
- 114.Zhang HS, Liu J, Pope CN. Age-related effects of chlorpyrifos on muscarinic receptor-mediated signaling in rat cortex. Arch Toxicol. 2002;75:676–684. doi: 10.1007/s00204-001-0309-3. [DOI] [PubMed] [Google Scholar]
- 115.Zhang X, Liu CH, Miao H, Gong ZH, Nordberg A. Postnatal changes of nicotinic acetylcholine receptor α2, α3, α4, α7 and β2 subunits genes expression in rat brain. Int J Dev Neurosci. 1998;16:507–518. doi: 10.1016/s0736-5748(98)00044-6. [DOI] [PubMed] [Google Scholar]
- 116.Zurich MG, Honegger P, Schilter B, Costa LG, Monnet-Tschudi F. Involvement of glial cells in the neurotoxicity of parathion and chlorpyrifos. Toxicol Appl Pharmacol. 2004;201:97–104. doi: 10.1016/j.taap.2004.05.003. [DOI] [PubMed] [Google Scholar]