

Abstract
Purpose
Tumor oxygen level plays a major role in the response of tumors to different treatments. The purpose of this study was to develop a method of determining oxygen transport properties in a recently developed 3-D model of tumor parenchyma, the multicellular layer (MCL).
Methods
OCM-1 human choroidal melanoma cells were grown as 3-D MCL on collagen-coated culture plate inserts. A recessed-cathode oxygen microelectrode was used to measure oxygen tension (PO2) profiles across 8 different MCL from the free surface to the insert membrane. The profiles were fitted to four different one-dimensional diffusion models: 1-, 2-, and 3-region models with uniform oxygen consumption (q) in each region and a modified 3-region model with a central region where q=0 and PO2=0.
Results
Depending upon the presence of a central region of anoxia, the PO2 profiles were fitted best by either the two-region model or the modified 3-region model. Consumption of tumor cells near the insert membrane was higher than that of cells close to the free surface (33.1 ± 13.6 x 10⁻⁴ vs. 11.8 ± 6.7 x 10⁻⁴ mm Hg/μm2, respectively).
Conclusions
The model is useful for determining oxygenation and consumption in MCL, especially for cell lines that cannot be grown as spheroids. In the future, this model will permit the study of parameters important in tumor oxygenation in vitro.
Keywords: oxygen transport, PO2, tumor, choroidal melanoma, cancer, multicellular layer, MCL, oxygen consumption
INTRODUCTION
Local oxygen level is an important determinant of a tumor’s response to several different types of treatment, including radiation therapy, photodynamic therapy, and some forms of chemotherapy (Brizel et al., 1997, Fyles et al., 1998, Gatenby et al., 1988, Gray et al., 1953, Harrison and Blackwell, 2004). In addition, tumor oxygenation status has been linked to patient survival, independent of treatment (Brizel et al., 1996, Hockel et al., 1994, Hockel et al., 1996, Hockel et al., 1993). Tumor oxygen level is determined by a balance between oxygen supply by the circulation and oxygen utilization by the tumor cells.
Given the importance of tumor oxygenation in treatment response and overall patient outcome, there is a continued need for in vitro models to test the effects of increased supply and metabolic inhibition on oxygen transport in tumor parenchyma. The in vitro model that has been most commonly used to study oxygen metabolism and transport in tumor parenchyma is the 3-D tumor spheroid. PO2 can be measured in tumor spheroids using oxygen microelectrodes (Acker et al., 1983, Mueller-Klieser, 1984), and the recorded PO2 profiles can be fitted to oxygen diffusion models to determine oxygen consumption rates (Mueller-Klieser, 1984, Mueller-Klieser et al., 1986, Mueller-Klieser and Sutherland, 1984, Sutherland et al., 1986). These measurements can be technically challenging, because the spheroids are positioned on an O2-permeable membrane and are held in place by a glass micropipette (Mueller-Klieser and Sutherland, 1982). This process must be performed with the aid of a microscope (Mueller-Klieser and Sutherland, 1982). Although spheroids are an excellent model for the study of oxygen transport in tumor parenchyma, symmetrical spheroids cannot be grown from all cell lines (Braun and Abbas, 2006).
Within the last decade, a new model of tumor parenchyma has been developed to study the transport and binding of drugs in tumors (Cowan et al., 1996, Hicks et al., 1997, Wilson and Hicks, 1999). These three-dimensional layers of tumor cells are called multicellular layers (MCL), and are grown by seeding tumor cells onto collagen-coated culture plate inserts. The inserts are suspended in stirred media, and the cells are allowed to grow until they form a layer at least several hundred microns thick. Up to the present time, these MCL have been used to study the diffusion and uptake of chemotherapeutic drugs and other agents by tumor cells (Cowan et al., 1996, Hicks et al., 1998, Hicks et al., 2003, Hicks et al., 1997, Wilson and Hicks, 1999). The layers have not been used to study tumor oxygen transport. The ability to model oxygen transport in MCL would be extremely useful for several reasons. First, it would likely expand the number of tumor cell lines that could be studied in vitro. Second, the impact of different types of extracellular matrix on tumor metabolism could be investigated, since, unlike spheroids, MCL grow on an underlying substrate, and extracellular matrix has been shown to influence tumor phenotype (Birgersdotter et al., 2005, Dozmorov et al., 2006). Third, it would permit drug transport and oxygenation to be quantitatively studied in the same in vitro model, which would be valuable for drugs whose uptake is known to be oxygen dependent (Hicks et al., 1998).
The purpose of the present study was to use oxygen microelectrodes to measure PO2 in MCL grown from a human choroidal melanoma cell line and to fit these PO2 profiles to oxygen diffusion models. From these fits, oxygen consumption rates of the model tumor parenchyma could be determined.
MATERIALS AND METHODS
Growth of OCM-1 Multicellular Layers (MCL)
The human choroidal melanoma cell line OCM-1 was originally cultured from a human choroidal melanoma specimen in the 1980’s (Kan-Mitchell et al., 1989) and was kindly supplied by Dr. June Kan-Mitchell. They were maintained in RPMI medium with antibiotic and 10% fetal bovine serum (FBS). 3-D clusters or spheroids can be grown from OCM-1 cells in vitro, but the spheroids are loose clusters of cells that are not truly spherical in nature (Braun and Abbas, 2006).
MCL were grown as described by Hicks et al., with slight modifications (Cowan et al., 1996). Calf skin collagen (Type III, Sigma, St. Louis, MO) was dissolved in hydrochloric acid and 60% ethanol at a concentration of 0.104 mg/ml. A 0.15 ml aliquot of the collagen was added to 12 mm diameter, 0.4-μm culture plate inserts (Millicell-CM, Millipore, Bedford, MA). The inserts were allowed to dry in a sterile, tissue culture hood and were subsequently stored under sterile conditions for future use.
Confluent layers of OCM-1 cells were trypsinized, washed, and counted. The cells were resuspended in RPMI media to a concentration of 1x10⁶ cells/ml. A 0.5 ml aliquot of the cell suspension was added to a collagen-coated insert. The inserts were placed in a sterile, covered Petri dish containing a thin layer of media. The Petri dish was put into a standard tissue culture incubator to allow the cells to adhere to the collagen substrate. After 5–6 hours, a sterile cork float was placed around the top of the insert to serve as a flotation device. 150 ml of RPMI media with antibiotic and 10% FBS was added to a sterile 225-ml glass jar. Next a sterile magnetic stir bar was placed in the media. The insert was added to the glass jar, and a specially constructed sterile mesh on stilts was placed on top of the insert. This mesh served to keep the buoyant insert covered with media. The jar was covered with a lid containing a small plastic septum in the center. The jar was positioned over one of the magnetic stirring positions in a multistirrer stirring bath (Mistral Multistirrer, 1286 series, Lab-Line Instruments, Melrose Park, IL) heated to 37°C. The stirring position was turned on to rotate the magnetic stir bar and mix the media within the jar. A sterile 22-gauge needle was inserted into the septum, and a 0.22-μm filter unit was attached to the needle hub. A piece of gas impermeable nylon tubing connected to a gas tank regulator was attached to the hub of the filter. In this way sterile-filtered air + 5% CO2 was forced into the glass jar. A sterile 26-gauge needle was inserted into the septum to serve as a gas outlet. The MCL was allowed to grow in this tissue culture system for five to 11 days. A standard hematoxylin & eosin stained section of a representative OCM-1 MCL is presented in Figure 1.
Figure 1.
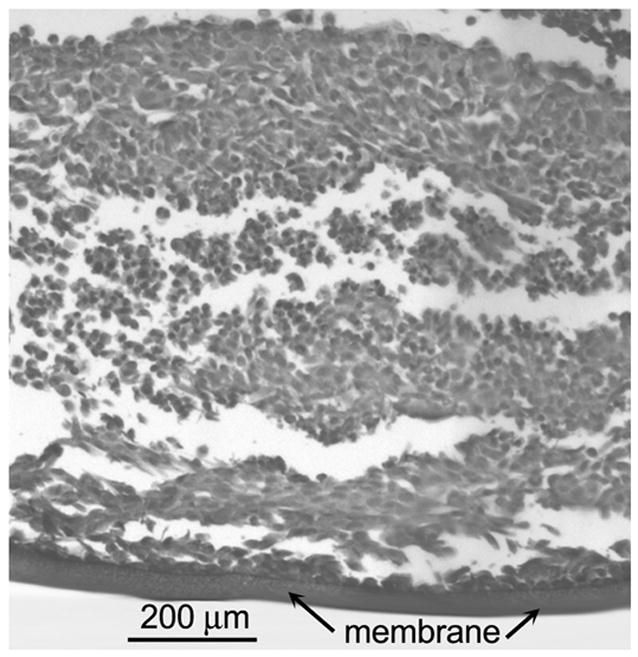
H&E section of multicellular layer grown from the OCM-1 human choroidal melanoma cell line after six days of growth. The membrane is located at the bottom. The thickness of this MCL was 823 ± 20 μm (mean ± SD, 10 measurements).
Production of Oxygen Microelectrodes
Recessed-cathode oxygen microelectrodes were produced using the method of Linsenmeier and Yancey (Linsenmeier and Yancey, 1987). Briefly, a glass pipette was pulled to a fine tip and filled with low-melting alloy in a microforge. A recess was formed by gently heating the tip. The tip was bevelled and the metal surface was electroplated with gold. The resultant electrodes had tip diameters of 4–8 μm. The electrode was polarized at −0.7 V with respect to a Ag/AgCl wire using a commercial polarizing box and picoammeter unit (Chemical Microsensor no. 1201, Diamond General, Ann Arbor, MI). The output from the microsensor was recorded on a computer at 25 Hz using data acquisition software (AT-CODAS; Windaq, DATAQ Instruments, Akron, OH). Before and after experiments, the electrode was calibrated in a temperature-controlled tonometer with 0%, 5%, and 21% oxygen alternately bubbled through saline at 37°C. The average sensitivity of the microelectrodes used in this study was 1.01 ± 0.42 mm Hg/pA (n=8, mean ± SD).
Measurement of PO2 across OCM-1 MCL
In this study, PO2 was measured while the MCL were exposed to air (21% O2) or 5% O2, which result in PO2 values of 149.7 and 35.6 mm Hg in the media, respectively. Air was chosen in order to reproduce the growth conditions, and 5% O2 was chosen in order to mimic conditions experienced by tumor parenchyma in vivo. Bubbling with 5% O2 resulted in PO2 at the MCL boundaries that were similar to perivascular PO2 values measured in tumor window chamber experiments. Perivascular PO2 around tumor vessels can range from <10 to 50 mm Hg, with a mean in the range of 20–30 mm Hg (Kimura et al., 1996).
To measure PO2 across the MCL, the MCL was removed from the growth chamber and was placed in a special holder that was suspended in a heated water-jacketed tonometer that contained RPMI media without FBS (Figure 2). The media was bubbled with the appropriate mixture of O2 and 5% CO2 at 37°C. An oxygen microelectrode was placed in a programmable motorized micromanipulator (DC3001, WPI, Sarasota, FL). The electrode was manually positioned just above the MCL within the insert, and the PO2 was recorded on the data acquisition program. The electrode was then advanced toward the inner surface of the suspended MCL insert in 100 μm steps with a 10-second interval between steps. The recording was observed for the point at which the MCL was entered, i.e., the electrode current dropped significantly. At this point, the step size was changed to 20 μm, but the current was still recorded for 10 seconds at each location. The microelectrode advance was continued until the membrane was reached. It was possible to identify the point when the electrode tip hit the insert membrane based on the following characteristics. Before the electrode hit the membrane, the current was increasing with each step, but once the membrane was reached, the oxygen profile flattened out. Once the membrane was hit, the electrode was withdrawn and repositioned, and the next profile was recorded.
Figure 2.
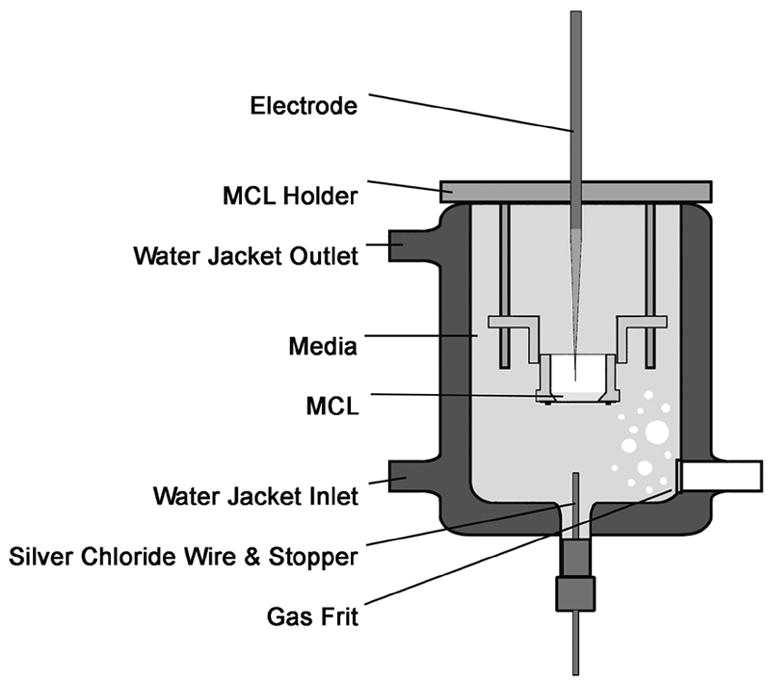
Schematic of the measurement chamber in which PO2 was measured in OCM-1 MCL using oxygen microelectrodes. Details are presented in the text.
Modeling of Oxygen Diffusion Across the MCL
A schematic of the MCL and several theoretical PO2 profiles are depicted in Figure 3. The MCL has been rotated 90° counterclockwise to facilitate data presentation. Based on this arrangement, PO2 profiles were modeled as follows. The starting position, x=0, was set at the first data point, which was the PO2 measured at some point in the media within the insert. The location of the media/MCL interface was designated as L0. The membrane was located at x=L.
Figure 3.
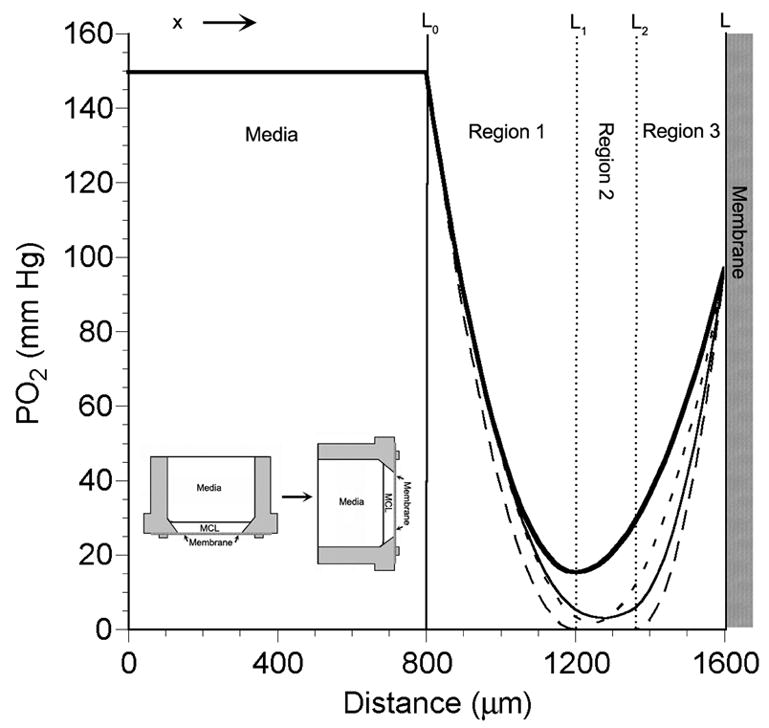
Schematic of the MCL within the tissue culture insert that has been rotated 90° counterclockwise (inset in lower left) to aid in visualization of the PO2 profiles. The curves within the MCL are theoretical PO2 profiles calculated using four models: 1-region model (short dashed line, ---), 2-region model (thick solid line, ━), general 3-region model (thin solid line, ——), and the modified 3-region model with a middle layer where PO2 = 0 (long dashed line, — —). The interface of the media and MCL at the top of the MCL in the measurement chamber is at x=L0. The MCL/membrane interface is located at x=L, which is at the bottom of the insert.
Oxygen diffusion through the MCL can be described by the one-dimensional Fick’s diffusion equation:
where D = the oxygen diffusion coefficient (cm2/sec), k = the oxygen solubility (ml O2/ml tissue/mm Hg), Dk = the oxygen permeability or Krogh’s diffusion coefficient (ml O2/cm/mm Hg/sec)], P = oxygen tension or PO2 (mm Hg), t = time (sec), x = distance along vertical axis perpendicular to MCL surface (cm), and q = oxygen consumption (ml O2/ml tissue/sec). Under steady-state conditions, dP/dt = 0 and the equation can be rearranged as follows:
where q/(Dk) is an oxygen consumption term with units of mm Hg/cm2 or mm Hg/μm2. This equation holds true across the entire MCL and can be solved for P as a function of distance, x. If the MCL is divided into m layers, then the PO2 across each layer can be described by the following equation:
for i=1 to m, where Ai and Bi are constants determined by the boundary conditions.
At the boundary of adjacent layers, continuity and mass conservation require that both the PO2 and oxygen fluxes be equal:
for i = 1 to m-1.
The boundary conditions at the two surfaces of the MCL were set to the PO2 values at those locations:
where Pmed = PO2 in the media within the well insert and Pmem = PO2 at the inner surface of the insert membrane.
The boundary condition at x=L0 assumes that the media in the insert is well stirred and that no oxygen gradients exist during the measurements. The media inside the tonometer was bubbled with gas (Figure 2), which mixed the media in the tonometer. Dye placed above the well rapidly dispersed within the well, indicating significant currents throughout the tonometer. In addition, when the electrode was placed above the well, the oxygen current remained constant as the electrode was advanced toward the MCL. These findings indicated that the insert well could be considered a well-stirred chamber. If there was an unstirred layer near the MCL surface, it was on the order of 100–200 μm, and we could not reliably detect it with our electrode advance protocol. We tested the inclusion of a small unstirred layer between the well and the MCL surface in an early version of the model, but this proved to be unnecessary in order to adequately fit the data and often resulted in fitted parameters that were not uniqiue. Therefore, the boundary condition at the surface of the MCL was set to Pmed.
At the other MCL boundary, the membrane, there were two possible unknowns: the PO2 at the membrane, Pmem, and the location of the membrane, L. Both of these could be estimated from the data, since the point at which the membrane was reached could be identified from the PO2 profile as the point at which the PO2 leveled off. Since bending of the electrode tended to make this transition less sharp, the exact location of the membrane was difficult to determine with certainty. On the other hand, a reasonable value for the PO2 at the membrane, Pmem, could be estimated from the PO2 measurements. For this reason, Pmem was fixed based on a value from the data, and the value of L was fitted by the model.
In order to determine the best model to adequately describe oxygen diffusion across the MCL, we decided to fit four different diffusion models to the experimental data. The models are shown in Figure 3. The simplest model assumes that the MCL has a uniform oxygen consumption (q1) and is designated a 1-region model. In the 1-region model, there are only three unknowns: L, L0, and q1/(Dk). The second model assumes that the MCL consists of 2 layers, each with a different q (2-region model). This model implies that the cells supplied by the two surfaces, the free surface and the membrane, would have different oxygen consumption rates. There are five unknown parameters to be fitted in the 2-region model: L, L0, L1, q1/(Dk), and q2/(Dk). In the third model, the MCL is divided into three layers with different q values (3-region model). This model would fit the data best if there were a middle layer that had a decreased oxygen demand due to local hypoxia or other factors that might affect oxygen consumption. The inclusion of the third region brings the total number of fitted parameters to seven: L, L0, L1, L2, q1/(Dk), q2/(Dk), and q3/(Dk). Based on the appearance of some of the PO2 profiles, we found it necessary to employ a fourth model as well. This fourth model assumes that q in the middle region of the 3-region model is zero and that the PO2 in that layer is also zero. These assumptions decrease the number of unique fitted parameters to four: L1, L2, q1/(Dk), and q3/(Dk).
All models were fitted to the data using programs written and run in MatLab software (MathWorks, Natick, MA). The programs used a “trust-region” algorithm to minimize the sum-of-squares error for each set of data to each of the four models. The goodness of the fit was evaluated by examining the sum-of-squares error (SSE), the root-mean-squared error (RMSE), and the coefficient of determination (r2). The fits were also evaluated based on the uniqueness of the fitted parameters, indicated by the magnitude of the 95% confidence intervals.
Determination of Oxygen Consumption (q/Dk) in OCM-1 MCL
In order to compare oxygen consumption values across MCL, we calculated three different oxygen consumption rates. The first is simply the average oxygen consumption rate for the entire MCL. This was calculated by the equation:
We also calculated the oxygen consumption rates of the cells supplied by each of the two boundaries in the model: the free surface and the membrane surface. The consumption rate of the cells supplied from the free surface, qs/(Dk), was the average consumption from x=L0 to x=xmin1, where xmin1 = the minimum x value at which dP/dx=0. The amount of the MCL supplied from the free surface (oxygen diffusion distance) is xmin2 – L0, and qs/(Dk) is given by:
Similarly, the oxygen consumption rate of the cells supplied from the membrane surface, qm/(Dk), was the average consumption from x=xmin2 to x=L, where xmin2 = the maximum x value at which dP/dx=0. The amount of the MCL supplied from the membrane boundary is L – xmin2. The value for qm/(Dk) is given by the following expression:
Statistics
All data were compared using nonparametric analysis, since a normal distribution of parameters could not be assumed. Differences among paired data were tested using the Wilcoxon’s rank sum test. Correlations were determined by standard linear regression. In order not to influence the regression analysis by possible outliers, we ran an initial regression analysis and applied a test of standardized residuals to identify possible outliers. Data points with a standardized residual >2.5 were excluded from the subsequent regression. Assuming a normal distribution of standardized residuals, a case with a standardized residual larger than about ±2.5 would only be expected to occur randomly about 1% of the time. Significance in all tests was achieved if p<0.05.
RESULTS
PO2 Profiles across OCM-1 MCL
A total of 30 PO2 profiles across eight different MCL were obtained while the chamber was bubbled with air + 5% CO2. In three of the MCL, eight profiles were also recorded while the chamber was bubbled with 5% O2. The MCL were grown for 5 to 11 days (8.1 ± 1.9, mean ± SD, n=8) and reached thicknesses ranging from 400 to 1400 μm as determined from the PO2 profiles. There was no correlation between growth time and MCL thickness (r=−0.463, p=0.248, n=8).
Examples of two PO2 profiles recorded during air bubbling are shown in Figure 4. In both profiles, while the microelectrode was in the RPMI medium (left), the PO2 was constant at the air-saturated value of 149.7 mm Hg. When the microelectrode struck the MCL surface, the PO2 sharply decreased. In Figure 4A, the PO2 reached a minimum of 41 mm Hg about 63% of the way into the MCL. It then rose to a PO2 value of 110.5 mm Hg at the membrane. In the profile in Figure 4B, the PO2 decreased until it reached a PO2 of zero 47% of the way into the MCL. The PO2 remained at zero until 896 μm into the MCL. It then rose to 78.2 mm Hg at the MCL-membrane interface. In both cases, the PO2 is not equilibrated with air at this interface, because the membrane serves as a diffusion barrier. For all 30 profiles, the average PO2 at the membrane surface was 97.4 ± 12.3 mm Hg or 65.1% of the air-equilibrated PO2 in the media.
Figure 4.
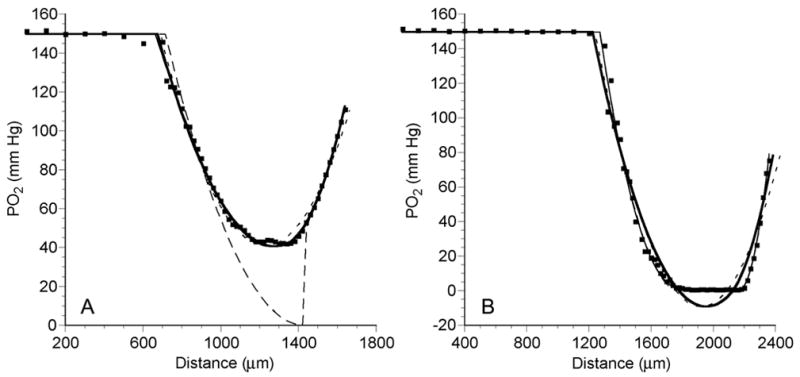
PO2 profiles (dots) across an OCM-1 MCL, while MCL was suspended in air-saturated RPMI, demonstrating a profile with no anoxia (A) and a profile with a significant anoxic region (B). The short dashed line (---) is the best fit of the data to the 1-region diffusion model. The thick solid line (—) and thin solid line (——) show the best fits of the 2-region and the general 3-region models, respectively. The long dashed line (— —) is the best fit to the modified 3-region model with a middle layer where PO2 = 0.
Of the 30 PO2 profiles recorded with the MCL exposed to air, 18 had regions of anoxia of more than 8% of the MCL thickness (Figure 5). There was a weak, but statistically significant correlation between extent of anoxia and MCL thickness. When the profiles became thicker than 700 μm, 18 of the 27 profiles had significant regions of anoxia. There was variability in anoxic fraction within the same MCL, depending on the measurement location. In one MCL (solid diamonds), profiles with similar thicknesses showed either no anoxia or anoxic fractions of around 30%. In Figure 5 and all subsequent figures, the individual profile results are presented, since there was variability in thickness across a given MCL (Figure 5) and variability in the model parameters.
Figure 5.
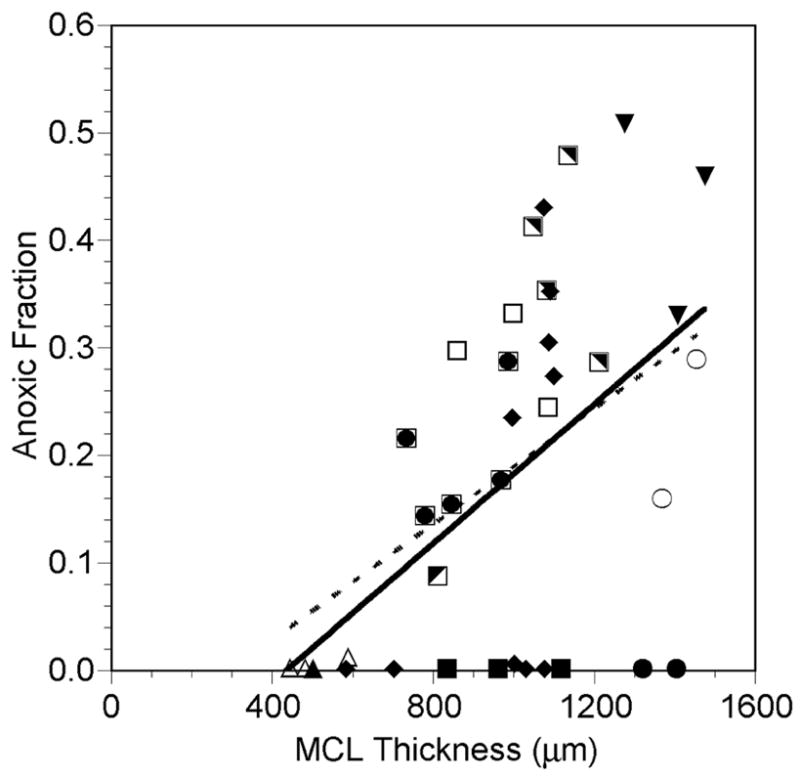
Fraction of the MCL that was anoxic (PO2 = 0) as a function of MCL profile thickness while the MCL was suspended in air-saturated RPMI (closed and half-closed symbols, solid line) or 5% O2-saturated RPMI (open symbols, dashed line). Each symbol represents measurements made in the same MCL. The same open and closed symbols represent profiles measured in the same MCL under the different gas bubbling conditions. Lines are regression lines with L-L0 = measured profile MCL thickness:
Air: Anoxic fraction = 0.000324 (L-L0) - 0.141, r=0.477, p=0.008, n=30
5% O2: Anoxic fraction = 0.000270 (L-L0) - 0.081, r=0.722, p=0.043, n=8
Despite the tendency for the anoxic fraction to increase as the MCL got thicker, oxygen also penetrated deeper into the MCL from both boundaries as the thickness increased. The amount of MCL supplied from the free surface and from the membrane side were both positively correlated with MCL thickness (Figure 6).
Figure 6.
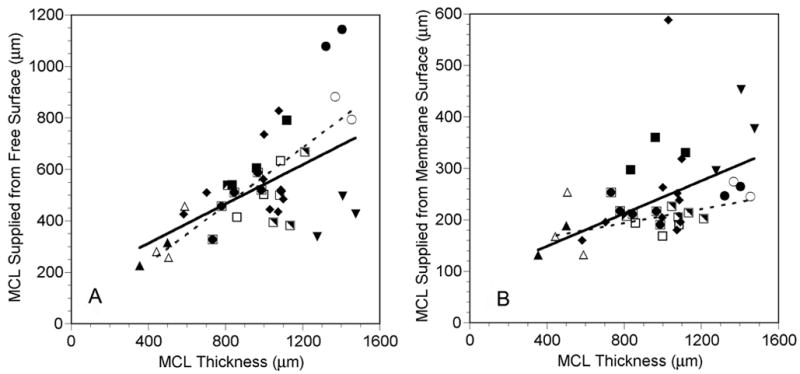
Amount of MCL supplied from the free surface (A) and the amount supplied from the membrane surface (B) as a function of MCL profile thickness while the MCL was suspended in air-saturated RPMI (closed and half-closed symbols, solid lines) or 5% O2-saturated RPMI (open symbols, dashed lines). Each symbol represents measurements made in the same MCL. The same open and closed symbols represent profiles measured in the same MCL under the different gas bubbling conditions. Lines are regression lines with L-L0 = measured profile MCL thickness. In panel B, the regression describing the data gathered on air did not include the filled diamond near the top of the figure, since it was excluded as an outlier (see Materials and Methods):
Air: ds = 0.382(L-L0) + 159.2, r=0.492, p=0.006, n=30
5% O2: ds = 0.560(L-L0) + 134.2, r=0.947, p<0.001, n=8
Air: dm = 0.159(L-L0) + 84.8, r=0.603, p<0.001, n=29
5% O2: dm = 0.068(L-L0) + 139.4, r=0.528, p=0.180, n=8
Examples of PO2 profiles measured while the MCLs were exposed to 5% O2 are shown in Figure 7. Again in both profiles, the PO2 was constant in the media with a value of 35.7 mm Hg, which is the PO2 of media equilibrated with 5% O2. The MCL in Figure 7A was only 505 μm thick, and the PO2 dropped to a minimum of 7.3 mm Hg 50% of the way into the MCL. The PO2 then increased until it reached 25.1 mm Hg at the membrane. In the thicker MCL shown in Figure 7B (998 μm thick), the PO2 dropped to zero 50% of the way into the MCL and remained there for another 330 μm (33% of the MCL thickness). The PO2 then increased until it reached a value of 19.3 mm Hg at the membrane. For all eight profiles, the average PO2 at the membrane surface was 22.5 ± 2.8 mm Hg (mean ± SD, n=8) or 63.0% of the 5% O2-equilibrated PO2 in the media.
Figure 7.
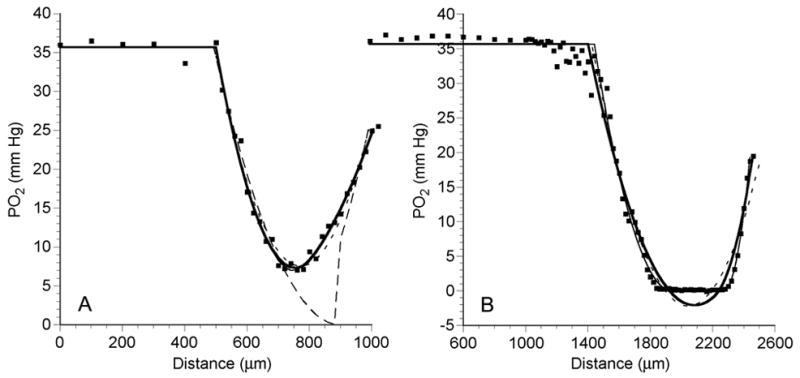
PO2 profiles (dots) across an OCM-1 MCL, while MCL was suspended in 5% O2-saturated RPMI, demonstrating a profile with no anoxia (A) and a profile with a significant anoxic region (B). The short dashed line (---) is the best fit of the data to the 1-region diffusion model. The thick solid line (—) and thin solid line (——) show the best fits of the 2-region and the general 3-region models, respectively. The long dashed line (— —) is the best fit to the modified 3-region model with a middle layer where PO2 = 0.
Six of the eight PO2 profiles recorded while the MCL were exposed to 5% O2 had regions of anoxia (Figure 5). The two profiles that did not have regions of zero PO2 were both recorded in the same MCL, where the MCL thickness was less than 500 μm. There was a significant correlation between extent of anoxia and MCL thickness.
Diffusion Models of PO2 across the MCL
All 38 PO2 profiles were fitted to the four diffusion models. Examples of fits to two different profiles recorded during exposure to air are shown in Figure 4. In Figure 4A, the PO2 did not reach zero, but there was a minimum near 1200 μm. This profile was fitted equally well by the 2-region and 3-region models, with RMSE of 2.35 and 2.30 mm Hg, respectively. The 1-region model yielded a poorer fit with an RMSE of 3.88 mm Hg. Obviously the modified 3-region model with central zero PO2 yielded the worst fit (RMSE = 20.20 mm Hg). Figure 4B shows a profile with a central anoxic region. The general 3-region and modified 3-region models yielded the best fits with RMSE of 3.69 and 3.67 mm Hg, respectively. The 1-region and 2-region models did not fit the data adequately with RMSE of 8.14 and 7.69 mm Hg, respectively.
As shown in Figure 7, similar results were obtained when PO2 profiles recorded during bubbling with 5% O2 were fitted to the diffusion models. In Figure 7A, the PO2 profile never reached zero and was fitted equally well by the 2-region and 3-region models, with RMSE of 0.99 and 1.01 mm Hg, respectively. The 1-region model yielded a poorer fit with an RMSE of 1.31 mm Hg. As before for such a profile, the modified 3-region model yielded the worst fit (RMSE = 4.77 mm Hg). In Figure 7B the PO2 profile had a central anoxic region. The general 3-region and modified 3-region models yielded the best fits with RMSE of 1.55 and 1.53 mm Hg, respectively. The 1-region and 2-region models did not fit the data as well with RMSE of 2.09 and 1.92 mm Hg, respectively. Therefore, in these examples as well as those shown in Figure 4, the 2-region and general 3-region models fitted the data well if a nonzero minimum was evident, while the general 3-region or modified 3-region model fitted the data best if anoxia was present.
In order to compare the fits of all 38 profiles to the four models, the SSE and RMSE were normalized to the minimum value for each profile. The profiles were separated into two groups, based on the presence or absence of an anoxic region. The relative SSE, relative RMSE, and r2 values for each group are summarized in Table 1. It is immediately clear that the 1-region model could not adequately fit any of the profiles in either group. In the group of profiles that lacked an anoxic region, the profiles were fitted best by the 2-layer model or the general 3-layer model. Those profiles with a region of anoxia were fitted almost equally well by the general 3-layer model or the modified 3-layer model with a middle layer of zero PO2. These overall findings agree with those shown in the examples in Figures 4 and 6.
TABLE 1.
Comparison of goodness of fit parameter values for the four models fitted to the data: 1-region model, 2-region model, general 3-region model, and the modified 3-region model with PO2 in region 2 set to zero.
| Goodness of Fit – No Anoxia (mean ± SD, n=13 profiles) | |||
|---|---|---|---|
| Model | Relative SSE | Relative RMSE | r2 |
| 1-Region | 6.359 ± 6.914 | 2.191 ± 1.149 | 0.965 ± 0.028 |
| 2-Region | 1.094 ± 0.119 | 1.031 ± 0.050 | 0.999 ± 0.028 |
| 3-Region | 1.002 ± 0.008 | 1.008 ± 0.011 | 0.992 ± 0.007 |
| 3-Region with PO2 in center = 0 | 82.903 ± 140.609 | 6.235 ± 6.255 | 0.695 ± 0.389 |
| Goodness of Fit – Anoxia Present (mean ± SD, n=25 profiles) | |||
| Model | Relative SSE | Relative RMSE | r2 |
| 1-Region | 4.558 ± 5.594 | 1.877 ± 0.913 | 0.969 ± 0.020 |
| 2-Region | 2.552 ± 1.826 | 1.508 ± 0.484 | 0.978 ± 0.014 |
| 3-Region | 1.003 ± 0.008 | 1.010 ± 0.012 | 0.987 ± 0.012 |
| 3-Region with PO2 in center = 0 | 1.080 ± 0.133 | 1.025 ± 0.053 | 0.987 ± 0.012 |
Based on this analysis, it may seem that the 3-region fit alone could adequately describe all of the profiles. Closer examination of the fits, however, showed several difficulties with the general 3-layer model. First, the uniqueness of the fitted parameters was sometimes questionable, i.e., the 95% confidence intervals of some parameters were very large. For the 25 profiles with anoxic regions, the 95% confidence intervals of all four parameters fitted by both 3-region models were significantly larger in the general 3-region fits compared to the modified 3-region fits (Table 2). Similarly, for the profiles that had no anoxic regions, the 95% confidence interval for the parameter L1 was 245.8 ± 278.1 μm for the 3-region fits and only 55.2 ± 27.1 μm for the 2-region fits (mean ± SD, n=13). Second, the fits of some of the profiles with anoxic areas resulted in the prediction of negative PO2 values. In 22 of the 25 profiles that demonstrated significant anoxia, the standard 3-region model predicted a negative PO2. Overall, the standard 3-region model predicted a minimum PO2 of −1.10 ± 1.49 mm Hg, with a range from 0 to −6.3 mm Hg.
TABLE 2.
Comparison of 95% confidence intervals for fitted parameter values between general 3-region model and the modified 3-region model with PO2 in region 2 set to zero. These fits were determined for the 25 profiles with anoxic regions. Differences between the confidence intervals for each parameter were tested using the Wilcoxon signed-rank test.
| 95% Confidence Intervals of Fitted Parameters (mean ± SD, n=25) | ||||
|---|---|---|---|---|
| Model | L1 (μm) | L2 (μm) | q1/Dk (mm Hg/μm2) | q3/Dk (mm Hg/μm2) |
| 3-Region | 121.9 ± 193.2 | 62.4 ± 41.3 | 3.51 ± 4.42 x 10⁻⁴ | 1.36 ± 1.04 x 10⁻³ |
| 3-Region with PO2 in center = 0 | 30.4 ± 14.1 | 30.6 ± 12.3 | 1.78 ± 1.58 x 10⁻⁴ | 1.06 ± 0.75 x 10⁻³ |
| p-value | <0.001 | <0.001 | <0.001 | <0.001 |
Based on these findings, we decided that two different models should be used to describe oxygen diffusion in the MCL. Only two consuming regions were necessary if there was no anoxic region in the profile. If there was such a region, then it was necessary to include a central layer of zero consumption and zero PO2.
Oxygen Consumption in OCM-1 MCL Exposed to Air
There was no relationship between the oxygen consumption of the portion of the MCL supplied by the free surface, qs/Dk, and the MCL thickness (Figure 8A). The mean qs/Dk for the profiles exposed to air was 1.18 ± 0.67 x 10⁻³ mm Hg/μm2 (mean ± SD, n=30). Similarly, no significant correlation existed between MCL thickness and the oxygen consumption of the portion of the MCL supplied by the membrane surface, qm/Dk (Figure 8B). The mean qm/Dk for the profiles exposed to air was 3.31 ± 1.36 x 10⁻³ mm Hg/μm2 (mean ± SD, n=30), which was significantly greater than qs/Dk (p<0.001, n=30). The combination of this lower consumption of the MCL near the free surface and the high PO2 in the media meant that the majority of the MCL was supplied with oxygen from that surface. On average, the free surface supplied 55.4 ± 15.5% of the MCL with oxygen, while only 26.3 ± 8.6% of the MCL was supplied with oxygen from the membrane side (p<0.001, n=30). The average oxygen consumption rate, qav/Dk, was significantly negatively correlated with the MCL thickness (Figure 9).
Figure 8.
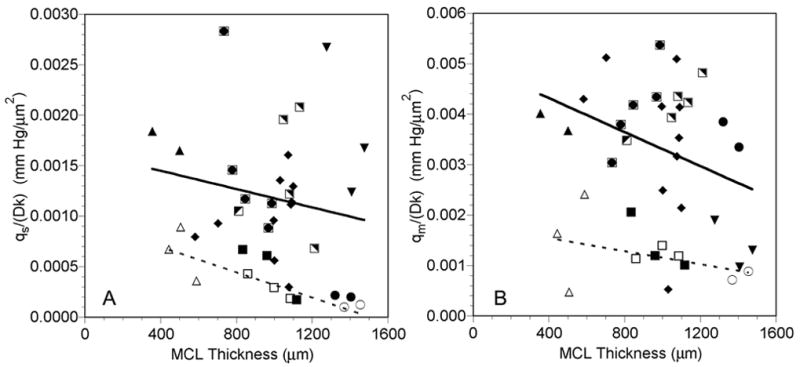
Oxygen consumption of tumor cells supplied from the free surface, qs/Dk (A), and of tumor cells supplied from the membrane surface, qm/Dk (B), as a function of MCL profile thickness while the MCL was suspended in air-saturated RPMI (closed and half-closed symbols, solid lines) or 5% O2-saturated RPMI (open symbols, dashed lines). Each symbol represents measurements made in the same MCL. The same open and closed symbols represent profiles measured in the same MCL under the different gas bubbling conditions. Lines are regression lines with L-L0 = measured profile MCL thickness:
Air: qs/Dk = −4.54x10⁻⁷(L-L0) + 1.63x10⁻³, r=−0.179, p=0.344, n=30
5% O2: qs/Dk = −6.28x10⁻⁷(L-L0) + 9.46x10⁻⁴, r=−0.869, p=0.005, n=8
Air: qm/Dk = −1.68x10⁻⁶(L-L0) + 4.99x10⁻³, r=−0.325, p=0.080, n=30
5% O2: qm/Dk = −6.46x10⁻⁷(L-L0) +1.80x10⁻³, r=−0.411, p=0.312, n=8
Figure 9.
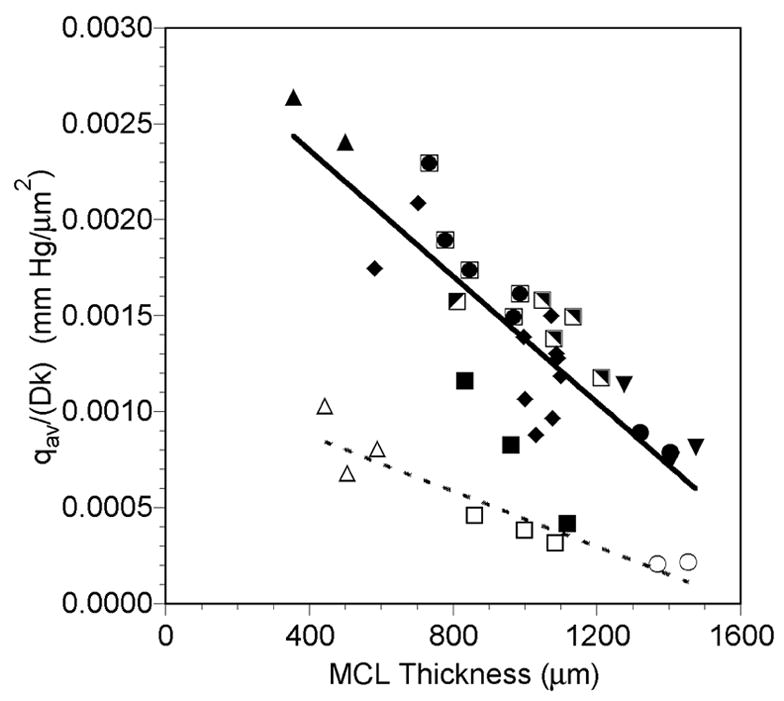
Average oxygen consumption of the MCL, qav/Dk, as a function of MCL profile thickness while the MCL was suspended in air-saturated RPMI (closed and half-closed symbols, solid line) or 5% O2-saturated RPMI (open symbols, dashed line). Each symbol represents measurements made in the same MCL. The same open and closed symbols represent profiles measured in the same MCL under the different gas bubbling conditions. Lines are regression lines with L-L0 = measured profile MCL thickness:
Air: qav/Dk = −1.64x10⁻⁶(L-L0) + 3.02x10⁻³, r=−0.823, p<0.001, n=30
5% O2: qav/Dk = −7.22x10⁻⁷(L-L0) + 1.16x10⁻³, r=−0.934, p<0.001, n=8
Oxygen Consumption in OCM-1 MCL Exposed to 5% O2
Bubbling the media with 5% O2 tended to decrease all three oxygen consumption parameters determined (Figures 8 and 9). There was a significant negative correlation between qs/Dk, and the MCL thickness during 5% O2 exposure (Figure 8A), and the mean value was 3.73 ± 2.77 x 10⁻⁴ mm Hg/μm2 (mean ± SD, n=8). As was the case when the MCL were exposed to air, there was no relationship between MCL thickness and qm/Dk (Figure 8B), and qm/Dk was significantly greater than qs/Dk (p=0.016, n=8). The mean qm/Dk was 12.13 ± 6.06 x 10⁻⁴ mm Hg/μm2 (mean ± SD, n=8). Similar to the MCL during air exposure, the free surface supplied 58.4 ± 9.4% of the MCL with oxygen, while the membrane side only supplied 25.0 ± 11.2% of the MCL with oxygen (p<0.001, n=8). Likewise, qav/Dk was negatively correlated with the MCL thickness during 5% O2 exposure (Figure 9).
DISCUSSION
Measurement of PO2 Profiles in OCM-1 MCL
PO2 profiles could be repeatedly measured in OCM-1 MCL using recessed polarographic oxygen microelectrodes. Measurements were successfully made in MCL with thicknesses ranging from 400 to 1400 μm. Individual MCL varied in thickness, depending on the location at which the profile was measured (Figure 5), which is consistent with the variability seen in the thickness of other MCL (Hicks et al., 1997). As expected, the thicker the MCL, the greater the tendency for there to be areas of anoxia, but there was no clear cutoff for the presence of anoxia. If the MCL was thicker than about 500 μm, then there was a possibility that anoxia would be present (Figure 5), but there were several MCL over 1 mm thick, in which the PO2 did not reach zero. This heterogeneity in the extent of anoxia was probably a result of the large variability in oxygen consumption among the MCL (Figure 8).
There was also heterogeneity in the PO2 profiles measured at different locations in the same MCL. The anoxic fraction of profiles could vary dramatically in a given MCL, even when the MCL thickness was similar (Figure 5). Most likely this heterogeneity was caused by differences in the metabolic demand of different regions of the MCL, although local heterogeneity in transport parameters cannot be excluded.
Comparison of Oxygen Measurements in Spheroids and MCL
There are several distinct technical advantages of the MCL system compared to spheroids for making PO2 measurements. First, spheroids typically have to be held in place by a tethering pipette on an O2-permeable membrane, while the oxygen microelectrode is advanced into the spheroid at another point. This is often a difficult task and requires manipulation under an operating microscope. On the other hand, the insert containing the MCL is simply placed in a tightly fitting ring holder that can be positioned in the tonometer (Figure 2). No microscopic visualization of the MCL or insert is necessary to prepare the MCL for measurement. Second, the PO2 data measured from a spheroid must be recorded along a radial course through the center in order to be properly described by the diffusion model (Mueller-Klieser, 1984). If the electrode does not enter the spheroid perpendicular to the surface, then the profile does not follow the radial coordinates described in the model. In the MCL model, the electrode must enter the MCL perpendicular to the flat surface. Any error in the angle alignment would result in an error proportional to the secant of the angle. For example, if the electrode strikes the surface at an angle of 10°, the positional error would only be 1.5%.
A current disadvantage of the MCL system is that a true consumption value cannot yet be determined, because the MCL system does not permit separate determination of the O2 permeability, Dk. Since oxygen transport parameters in the membrane can be linked to Dk by matching oxygen fluxes at the membrane, it is possible to determine Dk if the values for the membrane can be accurately determined. Unfortunately, it is possible that Dk varies across the MCL, since the boundaries of the MCL are not exposed to the same conditions during MCL growth. Mueller-Klieser et al. noted that oxygen consumption of spheroids was strongly dependent on the growth conditions, although Dk remained essentially constant (Mueller-Klieser et al., 1986). Experiments can be designed to address the issue of Dk variability across the MCL using a polarographic technique (Roh et al., 1990). Finally, it should also be noted that not all cell lines can be successfully grown as MCL. Therefore, as is the case for spheroids, this could limit the use of this model to a subset of cell lines.
Diffusion Modeling of PO2 Profiles
The measured PO2 profiles were successfully fitted by one of two diffusion models. If there was no significant anoxia present, then a two-region model adequately described the data. The presence of an anoxic region required the addition of a third central layer to the model with a fixed PO2 of zero. The fact that a one-region model did not fit the data indicated that the cells at the two boundaries of the MCL were metabolically different. This was verified by the analysis of the oxygen consumption data, which showed that the cells growing near the membrane had a higher metabolic rate, even though the membrane PO2 was lower than that at the free surface (Figure 8). Although the general three-region model actually fitted all of the profiles well, we found that it did not result in unique fits to some of the parameters. Thus, the inclusion of the extra parameters in the model was not necessary to adequately explain the data. The three-region model would have been necessary had there been a middle layer of cells in the MCL that had an altered metabolism due to chronically low oxygen levels or buildup of metabolic waste products. Only when the PO2 dropped to zero was the change in consumption large enough to require the addition of a new layer to the model.
Similar results were found when PO2 profiles recorded in tumor spheroids were fitted to diffusion models (Mueller-Klieser, 1984, Mueller-Klieser et al., 1986). These profiles were typically measured until the electrode was about half way through the spheroid. In small spheroids, a parabolic profile was recorded that was fitted by a one-region diffusion model. Since the entire surface of the spheroid was exposed to the same PO2, the profile would have theoretically been the same along any radial path from the center to the surface. This situation in the small spheroids is analogous to that in the MCL profiles fitted by the 2-region model. In the MCL system, however, the different boundary conditions resulted in the need for two distinct layers. In larger spheroids, the typical profile was characterized by a steep drop in PO2 that fell to a region of zero consumption, the necrotic core (Mueller-Klieser, 1984). This corresponds to the case in the MCL system, in which dP/dx fell to zero in the center, and the data were fitted by the modified 3-region model.
Despite these similarities in the PO2 profiles recorded in spheroids and those measured in the current study, there are several important differences as well. First, an unstirred layer or diffusion-depleted zone of 100–200 μm or larger was found at the surface of the spheroids (Mueller-Klieser, 1984). Although some evidence of such a zone was occasionally seen (e.g., Figure 7B), we could find no consistent evidence of an unstirred layer in the MCL. This may have been caused by the use of a relatively large step size of 100 μm while the electrode was moved toward the MCL. In the spheroid study, a smaller step size was typically used, permitting an unstirred layer to be detected. In addition, the electrode tip was viewed under a microscope, allowing the location of the spheroid surface to be reliably identified. The inclusion of the stagnant layer in the spheroid diffusion model permitted the calculation of the spheroid oxygen permeability, Dk, from the modeling. This also meant that the actual oxygen consumption could be calculated from the fitted q/Dk parameter. This was not possible in the current study, although Dk of the MCL can be related to the oxygen permeability of the membrane, (Dk)mem. If reliable values of (Dk)mem and membrane thickness can be determined, then values of oxygen consumption in the MCL could be calculated.
A second major difference in the PO2 profiles measured in the two models was the value of the central PO2. In larger EMT6/Ro spheroids, the central PO2 was sometimes nonzero, even when necrosis was present and the PO2 profile was flat in the center (dP/dr=0) (Mueller-Klieser et al., 1986, Mueller-Klieser and Sutherland, 1982, Mueller-Klieser and Sutherland, 1984). This was also true for other spheroids grown from cells of rodent and human origin (Mueller-Klieser, 1987). In thick OCM-1 MCL, the central PO2 consistently went to 0 mm Hg if the profile flattened in the center. For this reason, we chose to use the modified 3-region model with the central PO2 set to zero to fit these profiles. If this had not been the case, we would have chosen a model with the central q set to zero and allowed the central PO2 to be fitted. We actually did fit the data to this model, but it did not improve the fits and resulted in less unique parameter values (data not shown). The reason for this difference between the central PO2 values in thick MCLs and large spheroids is unclear. The central PO2 in spheroids and the diameter at which a minimum central PO2 is reached is dependent on the cell line and the culturing conditions, e.g., oxygen and glucose concentrations in the growth media (Mueller-Klieser, 1987, Mueller-Klieser et al., 1986). Therefore, it is possible that nonzero central PO2 would also be found in the OCM-1 MCL if the growth conditions were altered. Alternatively, it may be a function of the OCM-1 cell line and the central PO2 would always be zero in large MCL when dP/dx=0 for extended distances. A final possibility is that this zero central PO2 is a function of the MCL model. When grown as spheroids, the OCM-1 form loose, nonspherical 3-D clusters (Braun and Abbas, 2006). However, when seeded on the collagen-coated insert, the OCM-1 cells grew as a more tightly packed 3-D layer (Figure 1). Therefore, it is probable that the presence of the collagen on the membrane alters the growth of these cells and might be expected to alter their metabolism. Obviously, further studies with OCM-1 MCL and MCL from other cell lines are needed to address this issue.
Oxygen Consumption of OCM-1 MCL
One of the most interesting results from the modeling was the finding that the metabolic rate of cells supplied from the membrane surface, qm/Dk, was greater than the oxygen consumption rate of cells supplied from the free surface, qs/Dk (Figure 8). This was somewhat surprising, since the PO2 at the membrane surface was only 65% of that at the free surface. Thus, these cells were exposed to lower oxygen levels during growth and during the measurements. When EMT6/Ro spheroids were grown on 5% O2 instead of 20% O2, the oxygen consumption rate dropped from 3.09 to 1.65 x 10⁻⁴ ml O2/ml/sec (Mueller-Klieser et al., 1986). Therefore, growth at lower oxygen levels significantly decreased spheroid oxygen consumption. The reason for the higher consumption rate of the cells near the membrane in the MCL is not known. It is possible that the metabolism of these cells is influenced by contact with the collagen matrix on the membrane, while the cells near the free surface lack this influence. An alternative explanation is that the difference in these two consumption terms is determined by a difference in Dk in the two layers, rather than a difference in q. As noted above, the issue of Dk variability can be addressed using a polarographic technique (Roh et al., 1990).
In tumor spheroids, oxygen consumption in the viable rim generally decreased with increasing spheroid diameter, indicating that the cells may have decreased their consumption rate in an adaptive effort to maintain oxygen levels deeper into the spheroid (Mueller-Klieser et al., 1986, Mueller-Klieser and Sutherland, 1984). In the MCL, the amount of MCL supplied with oxygen from both boundaries did increase as the MCL got thicker (Figure 6). However, qs/Dk and qm/Dk were not significantly correlated with MCL thickness, although they both tended to decrease as the MCL thickness increased (Figure 8). Therefore, there is a suggestion of an adaptive consumption decrease by the OCM-1 cells as some of the MCL grew, but it is not as predictable as the response shown in spheroids. This is most likely the result of the heterogeneity in oxygenation among the MCL, since some thick MCL were partially anoxic, while others were not (Figure 5).
The average oxygen consumption, qav/Dk, decreased with increasing MCL thickness (Figure 9). This was not an unexpected result, since the extent of anoxia tended to increase with MCL thickness (Figure 5). The inclusion of a larger region of zero oxygen consumption in the average would result in a decrease in qav/Dk.
The effect of exposure of the MCL to 5% O2 cannot be fully evaluated in the present study, since only three MCL were exposed to both oxygen levels. The purpose of the experiments was not to rigorously determine the effect of different oxygen levels on consumption, but to determine if the modeling could fit PO2 profiles under the different conditions. Clearly the same models describe the profiles whether the MCL are exposed to air or 5% O2 (Figures 4 and 7). Nevertheless, all three oxygen consumption parameters (qs/Dk, qm/Dk, and qav/Dk) tended to decrease when the MCL were exposed to 5% O2 compared to air (Figures 8 and 9). In order to elucidate the nature of these changes, a more complete study of the metabolic effects of acute exposure of MCL to different oxygen levels needs to be performed.
Possible Applications of the Model
This new in vitro model of oxygen transport in tumor parenchyma has the potential to address important issues in the field of tumor oxygenation. Like spheroids, the MCL can be used to study the effects of growth conditions, ambient oxygen levels, media glucose concentration, or other media factors on tumor oxygen metabolism. In addition, the impact of different growth substrates on tumor oxygen consumption can be studied in the MCL, since, unlike spheroids, MCL form a 3-D layer of parenchyma on an underlying extracellular matrix, which has been shown to impact tumor phenotype (Birgersdotter et al., 2005, Dozmorov et al., 2006). Another powerful use of the MCL model involves combining quantitative oxygenation and drug transport studies. The MCL is currently used to study parenchymal drug transport, including the effects of oxygen levels on transport of oxygen-dependent drugs like tirapazamine (Hicks et al., 1998). The ability to measure and model oxygen transport in MCL means that actual oxygen distribution data could be added to improve the mass transport modeling. These and other possible applications of the MCL model make it a valuable tool in the study of tumor oxygenation.
Acknowledgments
The authors wish to thank Dr. June Kan-Mitchell (Wayne State University) for generously providing the OCM-1 cells and Mr. John L. Chunta for the schematic of the MCL measurement chamber. This work was supported by National Eye Institute Grant R29EY11634 to RDB and National Eye Institute Departmental Core Grant P30EY04068.
Footnotes
Publisher's Disclaimer: This is a PDF file of an unedited manuscript that has been accepted for publication. As a service to our customers we are providing this early version of the manuscript. The manuscript will undergo copyediting, typesetting, and review of the resulting proof before it is published in its final citable form. Please note that during the production process errors may be discovered which could affect the content, and all legal disclaimers that apply to the journal pertain.
References
- Acker H, et al. Methodological aspects of microelectrode measurements in cellular spheroids. Adv Exp Med Biol. 1983;159:445–462. doi: 10.1007/978-1-4684-7790-0_38. [DOI] [PubMed] [Google Scholar]
- Birgersdotter A, et al. Gene expression perturbation in vitro - a growing case for three-dimensional (3D) culture systems. Semin Cancer Biol. 2005;15:405–412. doi: 10.1016/j.semcancer.2005.06.009. [DOI] [PubMed] [Google Scholar]
- Braun RD, Abbas A. Orthotopic human choroidal melanoma xenografts in nude rats with aggressive and nonaggressive PAS staining patterns. Invest Ophthalmol Vis Sci. 2006;47:7–16. doi: 10.1167/iovs.04-0882. [DOI] [PMC free article] [PubMed] [Google Scholar]
- Brizel DM, et al. Tumor hypoxia adversely affects the prognosis of carcinoma of the head and neck. Int J Radiat Oncol Biol Phys. 1997;38:285–289. doi: 10.1016/s0360-3016(97)00101-6. [DOI] [PubMed] [Google Scholar]
- Brizel DM, et al. Tumor oxygenation predicts for the likelihood of distant metastases in human soft tissue sarcoma. Cancer Res. 1996;56:941–943. [PubMed] [Google Scholar]
- Cowan DS, et al. Multicellular membranes as an in vitro model for extravascular diffusion in tumours. Br J Cancer Suppl. 1996;27:S28–31. [PMC free article] [PubMed] [Google Scholar]
- Dozmorov MG, et al. Analysis of the interaction of extracellular matrix and phenotype of bladder cancer cells. BMC Cancer. 2006;6:12. doi: 10.1186/1471-2407-6-12. [DOI] [PMC free article] [PubMed] [Google Scholar]
- Fyles AW, et al. Oxygenation predicts radiation response and survival in patients with cervix cancer. Radiother Oncol. 1998;48:149–156. doi: 10.1016/s0167-8140(98)00044-9. [DOI] [PubMed] [Google Scholar]
- Gatenby RA, et al. Oxygen distribution in squamous cell carcinoma metastases and its relationship to outcome of radiation therapy. Int J Radiat Oncol Biol Phys. 1988;14:831–838. doi: 10.1016/0360-3016(88)90002-8. [DOI] [PubMed] [Google Scholar]
- Gray LJ, et al. The concentration of oxygen dissolved in tissues at the time of irradiation as a factor in radiotherapy. Br J Radiol. 1953;26:638–648. doi: 10.1259/0007-1285-26-312-638. [DOI] [PubMed] [Google Scholar]
- Harrison L, Blackwell K. Hypoxia and anemia: Factors in decreased sensitivity to radiation therapy and chemotherapy? Oncologist. 2004;9:31–40. doi: 10.1634/theoncologist.9-90005-31. [DOI] [PubMed] [Google Scholar]
- Hicks KO, et al. Extravascular diffusion of tirapazamine: Effect of metabolic consumption assessed using the multicellular layer model. Int J Radiat Oncol Biol Phys. 1998;42:641–649. doi: 10.1016/s0360-3016(98)00268-5. [DOI] [PubMed] [Google Scholar]
- Hicks KO, et al. Multicellular resistance to tirapazamine is due to restricted extravascular transport: A pharmacokinetic/pharmacodynamic study in HT29 multicellular layer cultures. Cancer Res. 2003;63:5970–5977. [PubMed] [Google Scholar]
- Hicks KO, et al. An experimental and mathematical model for the extravascular transport of a dna intercalator in tumours. Br J Cancer. 1997;76:894–903. doi: 10.1038/bjc.1997.481. [DOI] [PMC free article] [PubMed] [Google Scholar]
- Höckel M, et al. Intratumoral pO2 histography as predictive assay in advanced cancer of the uterine cervix. Adv Exp Med Biol. 1994;345:445–450. doi: 10.1007/978-1-4615-2468-7_59. [DOI] [PubMed] [Google Scholar]
- Höckel M, et al. Association between tumor hypoxia and malignant progression in advanced cancer of the uterine cervix. Cancer Res. 1996;56:4509–4515. [PubMed] [Google Scholar]
- Höckel M, et al. Intratumoral pO2 predicts survival in advanced cancer of the uterine cervix. Radiother Oncol. 1993;26:45–50. doi: 10.1016/0167-8140(93)90025-4. [DOI] [PubMed] [Google Scholar]
- Kan-Mitchell J, et al. Characterization of uveal melanoma cell lines that grow as xenografts in rabbit eyes. Invest Ophthalmol Vis Sci. 1989;30:829–834. [PubMed] [Google Scholar]
- Kimura H, et al. Fluctuations in red cell flux in tumor microvessels can lead to transient hypoxia and reoxygenation in tumor parenchyma. Cancer Res. 1996;56:5522–5528. [PubMed] [Google Scholar]
- Linsenmeier RA, Yancey CM. Improved fabrication of double-barreled recessed cathode o2 microelectrodes. J Appl Physiol. 1987;63:2554–2557. doi: 10.1152/jappl.1987.63.6.2554. [DOI] [PubMed] [Google Scholar]
- Mueller-Klieser W. Method for the determination of oxygen consumption rates and diffusion coefficients in multicellular spheroids. Biophys J. 1984;46:343–348. doi: 10.1016/S0006-3495(84)84030-8. [DOI] [PMC free article] [PubMed] [Google Scholar]
- Mueller-Klieser W. Multicellular spheroids. A review on cellular aggregates in cancer research. J Cancer Res Clin Oncol. 1987;113:101–122. doi: 10.1007/BF00391431. [DOI] [PMC free article] [PubMed] [Google Scholar]
- Mueller-Klieser W, et al. Influence of glucose and oxygen supply conditions on the oxygenation of multicellular spheroids. Br J Cancer. 1986;53:345–353. doi: 10.1038/bjc.1986.58. [DOI] [PMC free article] [PubMed] [Google Scholar]
- Mueller-Klieser WF, Sutherland RM. Influence of convection in the growth medium on oxygen tensions in multicellular tumor spheroids. Cancer Res. 1982;42:237–242. [PubMed] [Google Scholar]
- Mueller-Klieser WF, Sutherland RM. Oxygen consumption and oxygen diffusion properties of multicellular spheroids from two different cell lines. Adv Exp Med Biol. 1984;180:311–321. doi: 10.1007/978-1-4684-4895-5_30. [DOI] [PubMed] [Google Scholar]
- Roh HD, et al. Spatial variation of the local tissue oxygen diffusion coefficient measured in situ in the cat retina and cornea. Adv Exp Med Biol. 1990;277:127–136. doi: 10.1007/978-1-4684-8181-5_17. [DOI] [PubMed] [Google Scholar]
- Sutherland RM, et al. Oxygenation and differentiation in multicellular spheroids of human colon carcinoma. Cancer Res. 1986;46:5320–5329. [PubMed] [Google Scholar]
- Wilson WR, Hicks KO. Measurement of extravascular drug diffusion in multicellular layers. Br J Cancer. 1999;79:1623–1626. [PubMed] [Google Scholar]