Abstract
Transparent, pyridine-functionalized sol-gel monoliths have been formed and their use in Cr(VI) sensing applications demonstrated. The monoliths were immersed in acidic Cr(VI)-containing solutions, and the Cr(VI) uptake was monitored using UV-visible and atomic absorption spectroscopies. At concentrations at the ppm level, the monoliths exhibit a yellow color change characteristic of Cr(VI) uptake, and this can be measured by monitoring the absorption change at about 350 nm using UV-vis spectroscopy. Concentrations at the ppb level are below the limit of detection using this wavelength of 350 nm for measurement. However, by adding a diphenylcarbazide solution to monoliths that have been previously immersed in ppb-level Cr(VI) solutions, a distinct color change takes place within the gels that can be measured at about 540 nm using UV-vis spectroscopy. Concentrations as low as 10 ppb Cr(VI) can be measured using this method. The monoliths can then be regenerated for subsequent sensing cycles by thorough washing with 6.0 M HCl. The factors affecting monolith uptake of Cr(VI) have been explored. In addition, the gels have been characterized using X-ray photoelectron spectroscopy (XPS), scanning electron microscopy (SEM), and Brunauer-Emmett-Teller (BET) measurements.
Keywords: Sol-gel, Chromium(VI), Monolith, Diphenylcarbazide, Pyridine
1. Introduction
As a suspected carcinogenic agent and toxic pollutant, Cr(VI) poses a threat when present even at trace levels. Several methods have been reported for the successful determination and quantification of Cr(VI) in solution [1–24]. Some of these techniques rely on spectroscopic methods [1–12] while others depend on mass-sensitive devices [13–16] and electrochemical detection [17–25]. Of the spectroscopic techniques, many make use of diphenylcarbazide for the colorimetric determination of Cr(VI) [1–7]. In this process, Cr(VI) is reduced to Cr(III) while diphenylcarbazide (DPC) is oxidized to diphenylcarbazone (DPCO), and a magenta-colored complex is formed between the reaction products that can be monitored using UV-vis spectroscopy. Using this reagent, detection limits at the low ppb level have been reported [1,2]. One major drawback of techniques using diphenylcarbazide, however, is that the reaction is irreversible, making its incorporation into regenerable sensors a difficult task.
Sol-gels have been commonly used as substrates for optical [1,26–33] and spectroelectrochemical [34] analyses mainly because they are transparent in the visible region. The porosity of the gels can easily be modified, allowing the incorporation of functional groups into the matrix and the fast transport of molecules throughout the gel interior. The two main methods of incorporating organic functional groups into sol-gel glass are doping [1,27–31] and grafting [32,33,35,36]. When doping techniques are employed, SiO2 substrates doped with organic functional groups are formed, but leaching can often occur due to the fact that the organic molecules are not chemically bound to the gel interior. In the grafting technique, on the other hand, organic functional groups are covalently bound to the sol-gel matrix, and leaching is not expected. Our research group has recently reported a technique for the preparation of transparent porous silica sol-gel monoliths containing grafted organic functional groups [33].
In the current work, pyridine-functionalized optically transparent sol-gel monoliths have been prepared for the optical determination of Cr(VI) in solution. Most metal ions are cations. Chromium at its highest, VI oxidation state, however, exists mainly as anions (HCrO4−, Cr2O72−and HCr2O7− in acidic and CrO42− in basic solutions [37]), providing a unique opportunity for Cr(VI) preconcentration and detection [38]. Previous studies have demonstrated the capability of sol-gels for Cr(VI) extraction [39], and it has been reported that pyridinium derivatives form strong and stable complexes with Cr(VI) species [23, 25,40–43]. In the present study, 2-[2-(trimethoxysilyl)ethyl]-pyridine is grafted to sol-gel monoliths and is used for the preconcentration of Cr(VI) inside the gels. This preconcentration takes place as a result of the electrostatic interaction between the positively-charged pyridinium groups in the sol-gel matrix and the negatively-charged Cr(VI) anions in solution. At ppm levels, the monoliths exhibit a yellow color change characteristic of the Cr(VI) absorption. At ppb levels, the uptake can be monitored by exposing the monoliths to diphenylcarbazide and observing the subsequent magenta-colored product formed by the reaction of the reagent with the Cr(VI) bound inside the gel. Our studies have shown that concentrations as low as 10 ppb Cr(VI) can be measured using this method.
Scheme 1 illustrates the overall sensing cycle for the process. Initially, the pyridine-functionalized sol-gel monolith is exposed to Cr(VI), and a color change occurs. The monolith can then either be partially regenerated through exposure to a basic solution of NaOH or completely regenerated through exposure to diphenylcarbazide and 6.0 M HCl. The resulting clear monolith can then be used for subsequent measurement cycles.
Scheme 1.
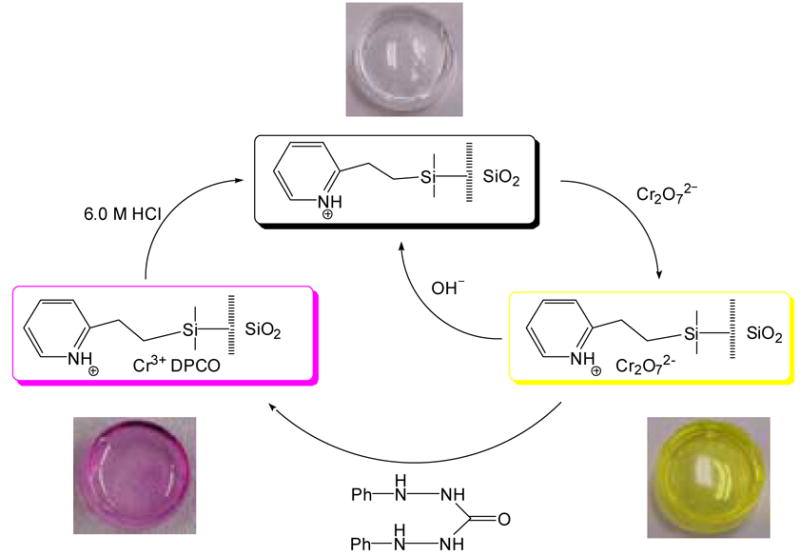
Sensing cycle in the current system. Photographic images are not to scale.
This paper outlines factors and influences on the monolith preparation and Cr(VI) uptake and sensing. It demonstrates the possible use of pyridine-functionalized sol-gel monoliths as regenerable sensors for Cr(VI) determination. In the current approach, pyridinium-functionalized monoliths directly detect chromate (in the ppm range) and preconcentrate chromate (in the ppb range). Diphenylcarbazide is then added after ppb-level chromate has been preconcentrated in the monoliths. This diphenylcarbazide plays two roles in that it allows for ppb-level Cr(VI) detection and decomposes chromate for its subsequent removal from the monoliths. An acid wash is then used to regenerate the monoliths for multicycles of Cr(VI) detection. In comparison, in earlier work involving diphenylcarbazide for chromate detection [1,2], the optodes for chromate sensing are usually for one time use.
2. Experimental
2.1 Chemical reagents
Tetramethyl orthosilicate (TMOS, Si(OMe)4, 98%, Sigma-Aldrich), 2-[2-(trimethoxysilyl)ethyl]-pyridine (Gelest), methanol (MeOH, HPLC grade, Fisher), ethylene glycol (certified A.C.S., Fisher), 1,5-diphenylcarbazide (DPC, A.C.S. reagent, Sigma-Aldrich), sodium hydroxide (NaOH, certified A.C.S., Fisher), sulfuric acid (H2SO4, certified A.C.S., Fisher), disodium ethylenediamine tetraacetate (EDTA, certified A.C.S., Fisher), and hydrochloric acid (HCl, certified A.C.S., Fisher) were all used as received. Standard solutions of Cr(VI) were prepared by serial dilution of a 1017 μg/mL AA standard (Sigma-Aldrich). Solutions and standards were prepared using deionized (DI) water (18 MΩ-cm) from a Barnstead International E-pure 4-holder deionization system. All solutions used in the studies were prepared fresh. In particular, the DPC solutions were always prepared immediately before use, as studies have shown that their sensitivity can decrease with time [3].
2.2 Monolith preparation
Detailed procedures of the preparation of functionalized sol-gel monoliths have been reported previously by our group [32]. An analogous procedure was used for the sol-gel preparation in the current study. Batches of pyridine-grafted monoliths were prepared by mixing 4.5 mL of TMOS, 4.5 mL of MeOH, 2.3 mL of ethylene glycol, and, in studies in which the effect of ligand percentage was not studied, 1.2 mL of 2-[2-(trimethoxysilyl)ethyl]-pyridine in a large vial. The sol solution was then stirred to ensure a homogeneous mixture, and 625 μL of aliquots were pipetted into each of 20 small (diameter = 13.4 mm) glass vials. NaOH (50 mM, 135 μL) was then added to each of the vials, and gelation occurred within ca. 10 minutes. The gels were covered with MeOH and allowed to stand for ca. 18 hours. The MeOH was then removed, and the gels were allowed to shrink in air for ca. 6 hours before they were again covered in MeOH. After standing for a further 18 hours, the MeOH was removed and replaced stepwise with 75% MeOH, 50% MeOH, 25% MeOH, and finally pure water to condition the gels and prevent them from cracking. The resulting optically transparent monoliths, having ca. 12 mm diameters and 5 mm thicknesses, were kept in water until use. Blank monoliths were prepared in a similar manner with the exclusion of the 2-[2-(trimethoxysilyl)ethyl]-pyridine. Scheme 2 illustrates the sol-gel monolith formation.
Scheme 2.

Reaction schemes for the formation of blank and functionalized sol-gel monoliths.
2.3 Instrumentation
UV-visible spectra were collected using a Hewlett-Packard 8452 photodiode array UV-vis spectrophotometer or a Thermo Spectronic BioMate 5 scanning UV-vis spectrophotometer. Atomic absorption (AA) analyses were performed with a Perkin-Elmer 5100 atomic absorption spectrophotometer using an air/acetylene flame under standard conditions [44]. Brunauer-Emmett-Teller (BET) measurements were carried out using a Nova 1000 high-speed surface area and pore size analyzer by Quantachrome Corp using N2 gas absorption. Scanning electron microscopy (SEM) images were obtained using a Hitachi S4100 SEM with the field-emission gun operating at 10.0 kV. X-ray photoelectron spectroscopy (XPS) was performed using a Phi 5100LS spectrometer with an Al Kα source operating at 300 W and generating x-rays with 1486.6 eV of energy. Specimens were analyzed at an electron take-off angle of 70°, measured with respect to the surface plane. In addition, the pressure of the chamber during analysis was 2 x 10⁻⁸ mtorr, and the pass energy was 89.45 eV. When acquiring the XPS data, a neutralizer was used to cancel the positive charging affects of the sample bombardment by x-ray photons. This neutralizer floods the sample surface with electrons to compensate for the electrons that are ejected by the photons. The neutralizer was set to an emission control of 21 mA and an electron energy of 70%.
2.4 BET, SEM, and XPS measurements
For the BET, SEM, and XPS studies, a pyridine-functionalized sol-gel monolith was ground into a powder and dried at 100 °C for at least 24 hours prior to measurement. For the BET studies, the powder was evacuated under vacuum and then cooled to −196 °C using liquid nitrogen before analysis. The adsorption portion of the N2 isotherm was used to calculate the pore size distribution of the sol-gel monoliths [45].
2.5 Analysis procedures
For the monitoring of Cr(VI) uptake, each monolith was placed in a solution of varying concentration for a period of time. After the allotted exposure time had passed, each gel was removed from solution, thoroughly rinsed with DI water, and either analyzed by UV-vis spectroscopy or placed in another solution for further study. In many cases, the supernatant from these gels was filtered and then analyzed by AAS using standard instrumental parameters [44] and a five-point calibration plot to determine chromium content. Solutions containing DPC were prepared by mixing 0.020 g of 1,5-diphenylcarbazide and 5.0 mL of acetone in a 100 mL volumetric flask. 2.4 mL of a sulfuric acid solution, prepared by diluting 8.75 mL of concentrated sulfuric acid to 25 mL in a separate volumetric flask, were then added, and the flask was diluted appropriately. After chromium and diphenylcarbazide exposure, the gels were washed numerous times with 6.0 M HCl and then DI water before reuse in subsequent analyses.
3. Results and Discussion
3.1 Monolith uptake of Cr(VI)
Figure 1 shows the ability of the pyridine-functionalized sol-gel monoliths to absorb Cr(VI). As can be seen in Figure 1A, when a solution of Cr(VI) with an absorption maximum at 350 nm is exposed to a pyridine-functionalized sol-gel monolith, the resulting colorless solution shows a much lower absorption at the same wavelength. This is due to the fact that the Cr(VI) has been removed from solution and is electrostatically bound to the pyridine groups present within the monolith. Figure 1B demonstrates that, when the functionalized monolith is removed from solution, it shows a very strong absorbance at about 350 nm, corresponding to Cr(VI) uptake [8]. This absorbance is even stronger than that of the original solution, due to the fact that the majority of the Cr(VI) has been concentrated within the gel. A blank monolith containing no pyridine functional groups and immersed in the same Cr(VI) solution shows a much smaller absorption.
Fig. 1.
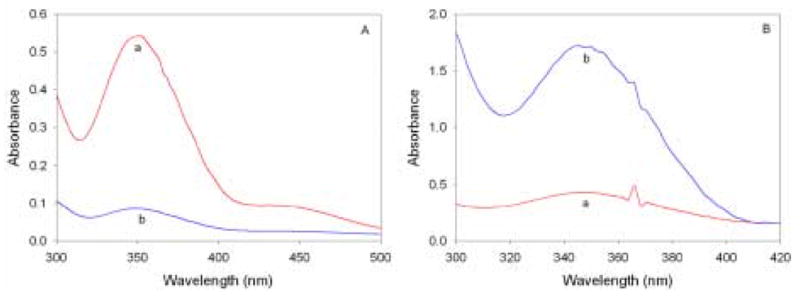
(A) 20 ppm Cr(VI) solution before (a) and after (b) exposure to a pyridine-functionalized monolith. (B) Spectra of pyridine-functionalized (a) and blank (b) monoliths after exposure to the same 20 ppm Cr(VI) solution. The Cr(VI) solutions also contained 0.1 M HCl.
The Cr(VI) uptake of the monoliths was further assessed by analyzing through AAS the Cr content of solutions that had been exposed to gels prepared by the methods discussed in the Experimental Section. Table 1 summarizes the results from one such study. Compared to the blank monoliths, the pyridine-functionalized sol-gel monoliths show a strong uptake of Cr(VI) from solution, absorbing ca. 75% more Cr(VI) than the blanks. In addition, the functionalized gels showed a high degree of reproducibility regarding Cr(VI) removal, indicating the consistency of the gels within the same batch as well as from batch to batch.
Table 1.
Study of the Cr(VI) removal from solution by various monoliths.a Concentrations are given in ppm.
| Gel Used | Initial Conc. | Final Conc. | % Removed |
|---|---|---|---|
| Blank Gels | 19.6 | 18.7 ± 0.9 | 4.5 ± 0.5% |
| Pyridine-Functionalized Batch 1 | 20.7 | 4.7 ± 0.3 | 77.3 ± 1.4% |
| Pyridine-Functionalized Batch 2 | 20.6 | 3.8 ± 0.1 | 81.7 ± 0.5% |
| Pyridine-Functionalized Batch 3 | 20.7 | 4.3 ± 0.2 | 79.1 ± 1.1% |
Each monolith was immersed in 5 mL of Cr(VI)/0.1 M HCl solution for 5 hours. The values given are based on measurements of three gels from each batch.
3.1.1 Effect of mol% ligand on Cr(VI) uptake
In order to evaluate the affect of the monolith ligand mol percentage on Cr(VI) uptake, Kd terms were used. The Kd term is defined as
and is often used to describe the efficiency of an extraction system [36,46]. Monoliths were prepared containing various mol percentages of 2-[2-(trimethoxysilyl)ethyl]-pyridine. Each was exposed to 5 mL of a solution containing 20 ppm Cr(VI) and 0.1 M HCl for 5 hours. The supernatant of each gel was then analyzed by AAS, and the Kd terms were calculated. Figure 2 shows a plot of Kd versus mol % ligand. As can be seen, the Kd values steadily increase and begin to level off at a mol percentage of 2.8%. At mol percentages greater than 2.8%, the Kd terms increase slightly, but it was found that gels with this increased amount of ligand were more brittle and structurally unstable. For this reason, monoliths that were used in further studies consisted of 2.8 mol% of 2-[2-(trimethoxysilyl)ethyl]-pyridine, as this amount of ligand provides optimum Cr(VI) extraction while maintaining a high degree of gel durability.
Fig. 2.
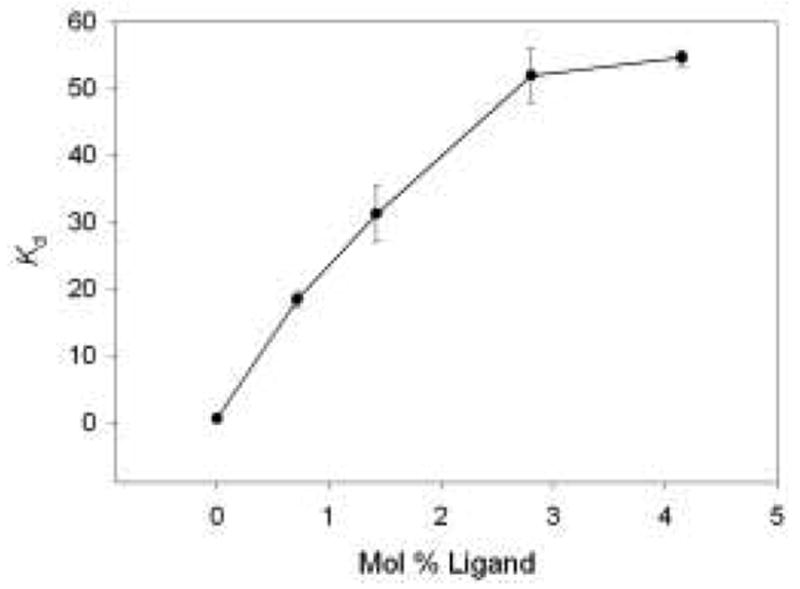
Plot of Kd vs. mol % ligand. Each data point represents an average of measurements from three different monoliths.
3.1.2 Effect of solution pH on Cr(VI) uptake
Based on Scheme 1, it is logical to assume that the solution pH should have an impact on the Cr(VI) absorption since the uptake seems to be a result of electrostatic interactions between the negatively-charged Cr(VI) ions and the positively-charged pyridine groups. A study was done in which monoliths were immersed in 20 ppm Cr(VI) solutions of varying pH. After two hours of exposure, the gels were removed and analyzed by UV-vis spectroscopy. The results are shown in Figure 3. At solutions of high pH, there is relatively little absorption of the Cr(VI) species. This is likely due to the fact that the pyridine groups present within the monoliths are deprotonated and unable to maintain strong electrostatic interactions with the Cr(VI) species. Furthermore, the spectra collected of the gels that had soaked in Cr(VI) solutions of basic pH showed a maximum absorbance at about 370 nm [47]. This absorbance shift to higher wavelengths occurs because CrO42− is the dominant species present in basic solutions of Cr(VI) [38]. It is interesting to note that, even at high pH values, there is Cr(VI) removal from solution. This seems to suggest that the interaction between Cr(VI) and pyridine is more than a simple ion-exchange process, as has been reported previously [23,25]. Cr(VI) solutions having pH values greater than 10 were not analyzed in this study because the large concentration of OH− ions in such solutions undergoes nucleophilic attack on the Si-(O-Si) bonds present within the gel, forming Si-OH and destroying the monolith network.
Fig. 3.
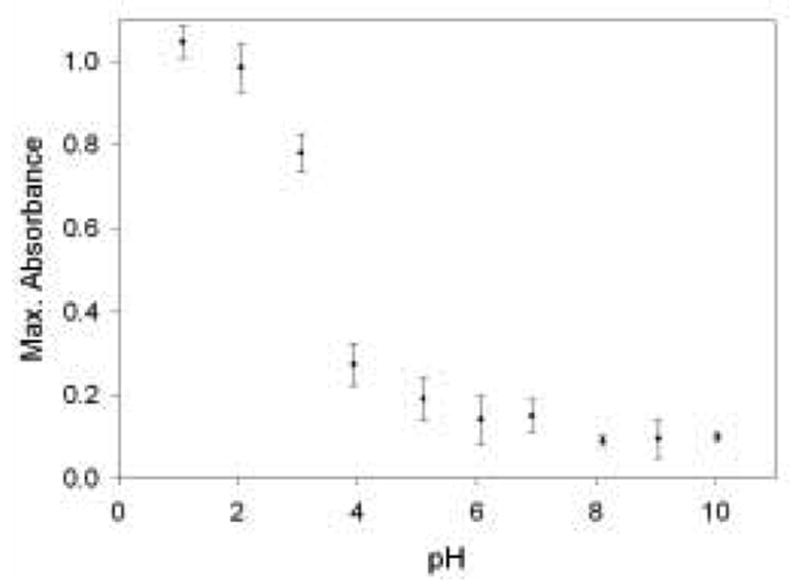
The dependence of monolith Cr(VI) removal on pH. Each monolith was immersed in 20 mL of a 20 ppm Cr(VI) solution for 2 hours and then analyzed by UV-vis spectroscopy. The solutions were pH adjusted using HCl and NaOH. Data points represent an average of measurements from three gels.
Based on the results shown in Figure 3, the monoliths absorb much larger amounts of Cr(VI) at lower pH values. This is likely due to the fact that pyridinium and silanol groups present within the gel are more sufficiently protonated at lower pH. The isoelectric point of silica sol-gel is close to pH = 2 [26], and the pKa value of 2-methylpyridine has been reported as 5.96 [48]. Thus, solutions of pH = 2 or lower should be sufficient for maximum gel protonation and, as a consequence, maximum Cr(VI) uptake. Taking this into account, as well as the critical role pH plays on analyte absorption (Figure 3), all Cr(VI) solutions were prepared containing 0.1 M HCl.
3.1.3 Effect of gel immersion time
The uptake of Cr(VI) anions by pyridine-functionalized monoliths was measured by monitoring the absorbance increases over time of gels exposed to 20 ppm Cr(VI) solutions [47]. The results are shown in Figure 4. Initially, the absorbance increases rather linearly and quickly as the Cr(VI) species are taken in by the gel. After ca. 100 minutes, however, the slope of the plot begins to flatten out as more pyridinium sites are occupied by the Cr(VI) anions. After about 300 minutes, the absorption changes very little. At this point, the absorbance has reached ca. 95% of its maximum value, indicating that the monolith has become saturated with Cr(VI). Figure 4 demonstrates the fact that functionalized monoliths immersed in ppm level Cr(VI) solutions exhibit a distinct color change after only a few minutes of exposure time. However, in order for maximum Cr(VI) absorption to take place, the gels must be exposed to the solution for an extended period.
Fig. 4.
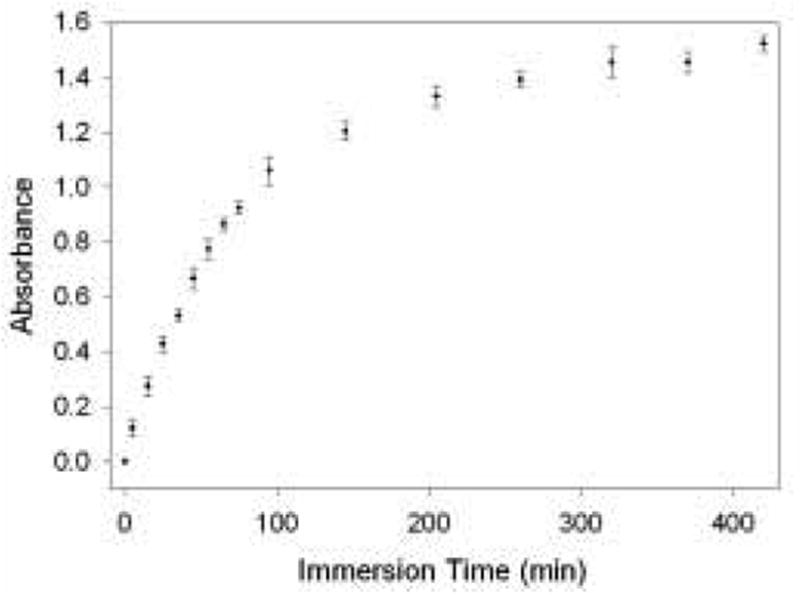
Cr(VI) uptake as a function of immersion time for a pyridine-functionalized sol-gel monolith. Four monoliths were each exposed to 20 mL of 20 ppm Cr(VI)/0.1 M HCl, and their absorbance was periodically measured using UV-vis spectroscopy.
3.2 Monolith characterization
3.2.1 BET analysis
BET gas adsorption experiments indicate that the pyridine-functionalized sol-gel monolith is quite porous, with an average pore radius of ca. 29 Å and a specific surface area of 502 m2/gram. A plot of pore volume as a function of pore radius (Figure 5A) indicates that the monolith has a pore size distribution that is consistent throughout the bulk of the material. The peak of this plot near 29 Å represents the size of the pores that contribute most to the pore volume. This high degree of monolith porosity should aid in the transport of analyte species throughout the gel. Figure 5B shows the N2 adsorption isotherm plot with a Z-shaped hysteresis loop. This hysteresis loop is common in porous materials including inorganic oxides and glasses [49,50]. In addition, these results are consistent with BET data obtained from similarly-prepared monoliths [32a].
Fig. 5.
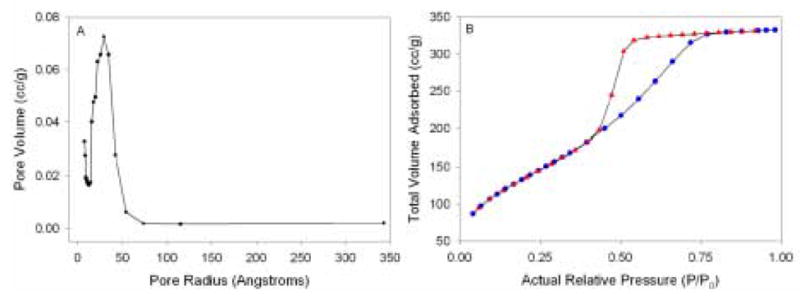
(A) BET pore size distribution for a pyridine-functionalized monolith. (B) N2 gas adsorption-desorption isotherm for the monolith; adsorption (
 ), desorption (
 ).
).
3.2.2 SEM and XPS analyses
SEM images of a pyridine-functionalized monolith, obtained at 20,000× and 30,000× magnification [47], show that the surface is not smooth. The network of particles packed together is indicative of a base-catalyzed process in which colloidal silica clusters are initially formed and then linked through gelation [51].
XPS spectra were obtained of pyridine-functionalized monoliths. Peaks of Si, C, O, and N were observed [47]. These peaks are consistent with the formation of a sol-gel monolith functionalized with pyridine.
3.3 Monoliths and the optical determination of Cr(VI)
The pyridine-functionalized monoliths discussed thus far are ideal for use as optical sensors as a result of their transparent, porous nature. When monoliths were exposed to Cr(VI) solutions of varying concentrations, a linear relationship (R2 = 0.9997) was found between their absorbance at 350 nm and the Cr(VI) concentration in solution (Figure 6). This indicates the potential usefulness of these monoliths as sensors for Cr(VI) at the ppm level.
Fig. 6.
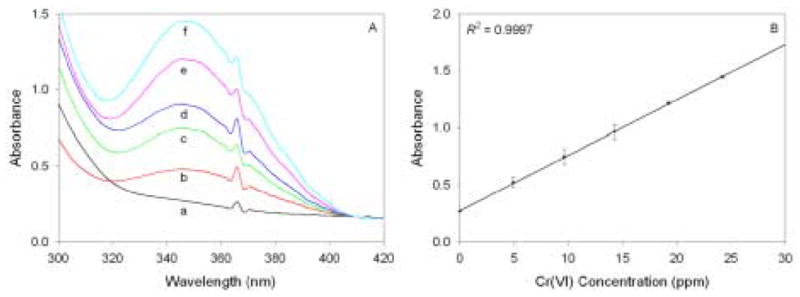
(A) Spectra acquired of functionalized monoliths immersed for 2.5 hours in 20 mL solutions consisting of 0.1 M HCl and a variable amount of Cr(VI): (a) 0 ppm; (b) 4.9 ppm; (c) 9.6 ppm; (d) 14.3 ppm; (e) 19.2 ppm; (f) 24.2 ppm. (B) The corresponding calibration plot. Data points represent an average of measurements from three gels.
When the monoliths are exposed to ppb level Cr(VI) solutions, no visible color change due to Cr(VI) absorption is evident at 350 nm; concentrations at this level are below the limit of detection using this wavelength for measurement. However, when gels that have been previously exposed to ppb level Cr(VI) solutions are immersed in a diphenylcarbazide solution, a magenta color forms within the gel. This occurs because, after the Cr(VI) has been preconcentrated within the gel at the pyridinium sites, the diphenylcarbazide is able to diffuse through the porous gel structure and react with the bound Cr(VI). This reaction results in the formation within the gel of a magenta-colored complex between Cr(III) and diphenylcarbazone that can be monitored using UV-vis spectroscopy.
Figure 7 shows the obtained spectra and corresponding calibration plot of monoliths that have been exposed to ppb levels of Cr(VI) followed by subsequent immersion in diphenylcarbazide solution. As can be seen in the spectra, absorption maxima occur at about 540 nm, consistent with reported absorption spectra of the Cr(III)-diphenylcarbazone complex [1–7]. Each monolith was immersed in a minimal amount (~2 mL) of diphenylcarbazide solution to prevent the colored product from leaving the gel after complex formation. The colored complex is usually formed immediately as the porous nature of the monoliths allows the diphenylcarbazide to diffuse through the gels and react with the bound Cr(VI) quickly. However, the gels were typically allowed to soak in diphenylcarbazide solution for 60 minutes, as this length of time seemed to yield optimal color development [47]. Using this technique, Cr(VI) concentrations as low as 10 ppb could be determined.
Fig. 7.
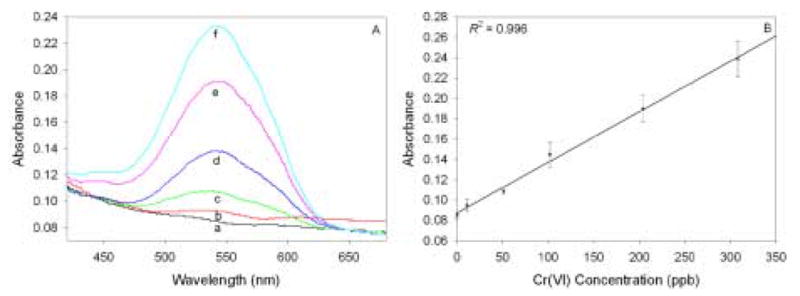
(A) Spectra of Cr(VI)-containing functionalized monoliths after exposure to diphenylcarbazide. Each gel had been previously exposed for 5 hours to a 20 mL solution consisting of 0.1 M HCl and: (a) 0 ppb; (b) 11 ppb; (c) 51 ppb; (d) 102 ppb; (e) 204 ppb; (f) 308 ppb Cr(VI). (B) The corresponding calibration plot. Data points represent an average of measurements from three gels.
In a separate study, monoliths were exposed to ppb level Cr(VI) solutions for a period of time, and their supernatants were then exposed to a diphenylcarbazide solution to determine the amount of Cr(VI) remaining [47]. The results showed that, for monoliths exposed to solutions consisting of 156 ppb Cr(VI), the average amount of Cr(VI) remaining in solution was 16.8 ppb. For monoliths exposed to 59 ppb Cr(VI), the average amount of Cr(VI) remaining in solution was below the limit of detection for the employed spectroscopic method. This further indicates that, even at the ppb level, Cr(VI) is indeed preconcentrated within the sol-gel monoliths.
3.4 Monolith regeneration
Once the monoliths have absorbed Cr(VI) anions from solution, their subsequent removal for monolith regeneration can be very difficult. Various studies were carried out to determine what medium best removed Cr(VI) from the monoliths. The results are summarized in Table 2.
Table 2.
Cr(VI) uptake by monoliths undergoing different regeneration procedures.a
| Gel Regeneration Method | 1st Cycle % Absorbed | 2nd Cycle % Absorbed | 3rd Cycle % Absorbed |
|---|---|---|---|
| NaOH | 78.8 ± 1.0% | 66.4 ± 1.0% | 50.0 ± 1.0% |
| DPC, 0.1 M EDTA | 78.5 ± 1.6% | 54.6 ± 2.9% | 55.8 ± 1.2% |
| DPC, 6.0 M HCl | 77.2 ± 0.3% | 74.1 ± 1.3% | 72.2 ± 1.9% |
Each monolith was immersed in 5 mL of ca. 20 ppm Cr(VI)/0.1 M HCl solution for 5 hours, and the supernatant from each gel was analyzed by AAS. The gels were then regenerated by the given procedure and used for subsequent Cr(VI) analysis. The values given are based on measurements from three gels.
It is perhaps not surprising that, once a functionalized monolith has been exposed to Cr(VI), soaking the gel in basic NaOH solution does not completely remove all of the Cr(VI) anions present. As was seen in Figure 4, the pyridine-functionalized sol-gel monoliths absorb Cr(VI) even from basic solutions. This suggests that repeated washing of the gels with the base should not be sufficient to remove all of the Cr(VI) bound in the monoliths. The data presented in Table 2 seem to confirm this fact. The percentage of Cr(VI) absorbed in the second and third cycles drops well below the initial amount absorbed, even after several days of washing the monoliths with basic OH− solution. Thus, washing the gels with base is insufficient for their complete regeneration.
In order to completely regenerate the gels for further use, the Cr(VI) must first be reduced to Cr(III). Exposing the monoliths to diphenylcarbazide accomplishes this task. However, once the Cr(III)-diphenylcarbazone complex has formed within the gel, it must be removed so that subsequent Cr(VI) sensing cycles can take place. It was found that exposing the monoliths to 0.1 M EDTA completely removed the magenta-colored complex from the gels. It is not clear what process occurs in the EDTA wash. It is reasonable to assume that EDTA replaces diphenylcarbazone in the Cr(III)-DPCO complex and effectively removes the species from the gel. It was determined, however, that when these gels are again exposed to Cr(VI) for subsequent sensing, the amount of Cr(VI) absorbed from solution was much less than that absorbed in the initial cycle (Table 2). This is possibly a result of the EDTA molecules themselves becoming bound to the pyridinium sites present within the gel and preventing further Cr(VI) binding from solution.
In search of a reagent to regenerate the monoliths, it was found that a simple wash of monoliths containing the Cr(III)-diphenylcarbazone complex with 6.0 M HCl resulted in completely colorless gels. Subsequent Cr(VI) uptake studies showed that the monoliths had been almost completely regenerated for further sensing use (Table 2). The disappearance of the magenta-color suggests that the acid has decomposed the Cr(III)-diphenylcarbazone species, helping their removal from the monoliths. In addition, the acid wash may reactivate the sol-gels. In a study of Cr(VI) extraction and reduction [39], Dave and coworkers have reported the use of an acidic solution to refurbish protons in their sol-gel matrix. The addition of a 6.0 M HCl solution may aid in the removal of the Cr(III) and diphenylcarbazone from the gel by fully protonating the pyridinium sites. These positively-charged pyrdinium groups may help to repulse and expel the Cr(III). Gels that have been exposed to both ppm and ppb levels of Cr(VI) can be regenerated for subsequent sensing cycles using this technique.
3.5 Measurement of a Cr(VI)-containing sample
The selectivity of pyridinium organic functional groups for Cr(VI) has been previously reported [23,25]. In order to demonstrate the feasibility of using these monoliths for Cr(VI) sensing in environmental applications, a sample of water was obtained from a nearby lake and spiked with 85 ppb Cr(VI) and pH adjusted to 1. A monolith was then exposed to 20 mL of this solution for 6 hours, rinsed thoroughly with DI water, and further exposed to a diphenylcarbazide solution for one hour. A UV-vis spectrum of the gel was taken, and this spectrum was compared to that of a control gel that was exposed to the same Cr(VI) concentration (prepared in DI water) for the same length of time and having the same acidity. The monolith exposed to the spiked lake water sample showed a maximum absorbance at 540 nm of 0.036 relative to a gel exposed to 0 ppb Cr(VI), while the control monolith showed a maximum absorbance at 540 nm of 0.034 relative to a gel exposed to 0 ppb Cr(VI) [47]. The relatively small error, 5.9%, associated with these absorbance values suggests that any biological and/or chemical interferents present in the lake water sample do not have a significant impact on the acquired measurements. This demonstrates the potential of these pyridine-functionalized monoliths for use in environmental Cr(VI) monitoring applications.
4. Conclusions
Pyridine-functionalized sol-gel monoliths have been prepared for the determination of Cr(VI) in solution. These optically transparent, porous gels were found to preconcentrate Cr(VI) through the electrostatic interaction between the positively-charged pyridinium groups present within the monolith and the negatively-charged Cr(VI) anions in solution. At the ppm level, the Cr(VI) concentration was determined by monitoring the absorption of the preconcentrated colored analyte at 350 nm. At the ppb level, the preconcentrated Cr(VI) could be analyzed by exposing the gel to diphenylcarbazide and monitoring the absorbance at 540 nm of the colored product present within the monolith. The use of the gels for the analysis of Cr(VI) at both the ppm and ppb levels suggests that they have a wide dynamic range and can be used for monitoring Cr(VI) at a variety of concentrations [47]. In addition, these monoliths can be regenerated through exposure to 6.0 M HCl, making their repeated use for Cr(VI) analysis possible. As a result, these monoliths are unique in that they make use of diphenylcarbazide for ppb level determination of Cr(VI) while maintaining the ability to be regenerated for subsequent sensing use. Their incorporation into a flow cell for the online monitoring of Cr(VI), for e.g. environmental applications, is entirely possible.
Appendix A. Supplementary Data
Supplementary data associated with this article is available.
Supplementary Material
Acknowledgments
The authors gratefully acknowledge the U.S. National Institutes of Health (1 R21 DK068107-01) for financial support. We also thank Johnny C. Jones for XPS assistance, Richard Mayes for BET assistance, and Prof. Youngmi Lee for the use of a UV-vis spectrophotometer.
Footnotes
Publisher's Disclaimer: This is a PDF file of an unedited manuscript that has been accepted for publication. As a service to our customers we are providing this early version of the manuscript. The manuscript will undergo copyediting, typesetting, and review of the resulting proof before it is published in its final citable form. Please note that during the production process errors may be discovered which could affect the content, and all legal disclaimers that apply to the journal pertain.
References
- 1.Zevin M, Reisfeld R, Oehme I, Wolfbeis OS. Sens Actuators. 1997;B38–39:235. [Google Scholar]
- 2.Scindia YM, Pandey AK, Reddy AVR, Manohar SB. Anal Chim Acta. 2004;515:311. [Google Scholar]
- 3.Urone PF. Anal Chem. 1955;27:1354. [Google Scholar]
- 4.Pflaum RT, Howick LC. J Am Chem Soc. 1956;78:4862. [Google Scholar]
- 5.Allen TL. Anal Chem. 1958;30:447. [Google Scholar]
- 6.Willems GJ, Blaton NM, Peeters OM, De Ranter CJ. Anal Chim Acta. 1977;88:345. [Google Scholar]
- 7.Dedkova VP, Shvoeva OP, Sawin SB. J AnalChem. 2001;56:758. [Google Scholar]
- 8.Mignani AG, Romolini A. Spectrosc Lett. 2002;35:467. [Google Scholar]
- 9.Tao S, Winstead CB, Xian H, Soni K. J Environ Monit. 2002;4:815. doi: 10.1039/b204286j. [DOI] [PubMed] [Google Scholar]
- 10.Balasubramanian S, Pugalenthi V. Talanta. 1999;50:457. doi: 10.1016/s0039-9140(99)00135-6. [DOI] [PubMed] [Google Scholar]
- 11.Posta J, Berndt H, Luo SK, Schaldach G. Anal Chem. 1993;65:2590. [Google Scholar]
- 12.Bazzi A, Kreuz B, Wuokila J, Maqboul A. J Chem Ed. 2005;82:435. [Google Scholar]
- 13.Ji HF, Thundat T, Dabestani R, Brown GM, Britt PF, Bonnesen PV. Anal Chem. 2001;73:1572. doi: 10.1021/ac0013103. [DOI] [PubMed] [Google Scholar]
- 14.Zhang Y, Ji HF, Brown GM, Thundat T. Anal Chem. 2003;75:4773. doi: 10.1021/ac0343026. [DOI] [PubMed] [Google Scholar]
- 15.Pinnaduwage LA, Boiadjiev VI, Brown GM, Thundat T, Petersen SW. Sens Lett. 2004;2:25. [Google Scholar]
- 16.Tian F, Boiadjiev VI, Pinnaduwage LA, Brown GM, Thundat T. J Vac Sci Technol A. 2005;23:1022. [Google Scholar]
- 17.Cox JA, Kulesza PJ. Anal Chim Acta. 1983;154:71. [Google Scholar]
- 18.Paniagua AR, Vazquez MD, Tascon ML, Sanchez Batanero P. Electroanalysis. 1993;5:155. [Google Scholar]
- 19.Svancara I, Foret P, Vytras K. Talanta. 2004;64:844. doi: 10.1016/j.talanta.2004.03.062. [DOI] [PubMed] [Google Scholar]
- 20.Welch MW, Nekrassova O, Compton RG. Talanta. 2005;65:74. doi: 10.1016/j.talanta.2004.05.017. [DOI] [PubMed] [Google Scholar]
- 21.Yang YJ, Huang HJ. Anal Chem. 2001;73:1377. [Google Scholar]
- 22.Lin L, Lawrence NS, Thongngamdee S, Wang J, Lin Y. Talanta. 2005;65:144. doi: 10.1016/j.talanta.2004.05.044. [DOI] [PubMed] [Google Scholar]
- 23.Turyan I, Mandler D. Anal Chem. 1997;69:894. doi: 10.1021/ac9607525. [DOI] [PubMed] [Google Scholar]
- 24.Ge H, Zhang J, Wallace GG. Anal Lett. 1992;25:429. [Google Scholar]
- 25.Carrington NA, Yong L, Xue ZL. Anal Chim Acta. 2006;572:17. doi: 10.1016/j.aca.2006.05.020. [DOI] [PMC free article] [PubMed] [Google Scholar]
- 26.Brinker CJ, Sherer GW. Sol-Gel Science: The Physics and Chemistry of Sol-Gel Processing. Academic Press; San Diego: 1990. [Google Scholar]
- 27.Hench LL, West JK. Chem Rev. 1990;90:33. [Google Scholar]
- 28.Avnir D. Acc Chem Res. 1995;28:328. [Google Scholar]
- 29.Dave BC, Dunn B, Valentine JS, Zink JI. Anal Chem. 1994;66:1120A. [Google Scholar]
- 30.(a) Allain LR, Sorasaenee K, Xue ZL. Anal Chem. 1997;69:3076. doi: 10.1021/ac970258g. [DOI] [PubMed] [Google Scholar]; (b) Allain LR, Xue ZL. Anal Chim Acta. 2001;433:97. [Google Scholar]; (c) Allain LR, Canada TA, Xue ZL. Anal Chem. 2001;73:4592. doi: 10.1021/ac010166y. [DOI] [PubMed] [Google Scholar]; (d) Canada TA, Allain LR, Beach DB, Xue ZL. Anal Chem. 2002;74:2535. doi: 10.1021/ac0200623. [DOI] [PubMed] [Google Scholar]; (e) Allain LR, Xue ZL. Anal Chem. 2000;72:1078. doi: 10.1021/ac990908b. [DOI] [PubMed] [Google Scholar]; (f) Canada TA, Xue ZL. Anal Chem. 2002;74:6073. doi: 10.1021/ac0202987. [DOI] [PubMed] [Google Scholar]; (g) Canada TA, Beach DB, Xue ZL. Anal Chem. 2005;77:2842. doi: 10.1021/ac0485839. [DOI] [PubMed] [Google Scholar]; (h) Im HJ, Yang YH, Allain LR, Barnes CE, Dai S, Xue ZL. Environ Sci Technol. 2000;34:2209. [Google Scholar]
- 31.(a) Rickus JL, Dunn B, Zink JI. In: Optical Biosensors. Ligler FS, Rowe Taitt CA, editors. 2002. pp. 427–456. [Google Scholar]; (b) Lan EH, Dave BC, Fukuto JM, Dunn B, Zink JI, Valentine JS. J Mater Chem. 1999;9:45. [Google Scholar]
- 32.(a) Clavier CW, Rodman DL, Sinski JF, Allain LR, Im HJ, Yang Y, Clark JC, Xue ZL. J Mater Chem. 2005;15:2356. [Google Scholar]; (b) Clavier CW. MS Thesis. The University of Tennessee; 2001. Chapter 3. [Google Scholar]
- 33.Rodman DL, Pan H, Clavier CW, Feng X, Xue ZL. Anal Chem. 2005;77:3231. doi: 10.1021/ac048305+. [DOI] [PubMed] [Google Scholar]
- 34.See, e.g.,Ross SE, Shi Y, Seliskar CJ, Heineman WR. Electrochim Acta. 2003;48:3313.Hu Z, Slaterbeck AF, Seliskar CJ, Ridgway TH, Heineman WR. Langmuir. 1999;15:767.
- 35.Schubert U, Husing N, Lorentz A. Chem Mater. 1995;11:2010. [Google Scholar]
- 36.Feng X, Fryxell GE, Wang LQ, Kim AY, Liu J, Kemner KM. Science. 1997;276:923. [Google Scholar]
- 37.Bichromate (HCrO4−) is believed to be the predominant Cr(VI) species in dilute, acidic solution at pH < 6.5. However, there have been controversies recently about whether bichromate (HCrO4−) exists. See, e.g. House DA. Adv Inorg Chem. 1997;44:341.Poulopoulou VG, Vrachnou E, Koinis S, Katakis D. Polyhedron. 1997;16:521.Ramsey JD, Xia L, Kendig MW, McCreery RL. Corrosion Sci. 2001;43:1557.
- 38.Greenwood NN, Earnshaw A. Chemistry of the Elements. 2. Elsevier Science: London; 1997. pp. 1002–1040. [Google Scholar]
- 39.Deshpande K, Cheung S, Rao MS, Dave BC. J Mater Chem. 2005;15:2997. [Google Scholar]
- 40.Camelot M. Rev Chim Miner. 1969;6:853. [Google Scholar]
- 41.Corey EJ, Schmidt G. Tetrahderon Lett. 1979;5:399. [Google Scholar]
- 42.Martin-Zarza P, Gili P, Rodriguez-Romero FV, Ruiz-Perez C, Solans X. Polyhedron. 1995;14:2907. [Google Scholar]
- 43.Sisler H, Ming WChL, Metter E, Hurley FR. J Am Chem Soc. 1953;75:446. [Google Scholar]
- 44.Perkin-Elmer Corp. Analytical Methods for Atomic Absorption Spectroscopy. 1996. [Google Scholar]
- 45.Studies have shown that the application of desorption branches of isotherms to calculate pore size distributions may lead to artificial narrowing of peaks. See ref. 49 for more details.
- 46.Chen X, Feng X, Liu J, Fryxell GE, Gong M. Sep Sci Technol. 1999;34:1121. [Google Scholar]
- 47.See supplementary data.
- 48.Gero A, Markham JJ. J Org Chem. 1951;16:1835. [Google Scholar]
- 49.Kruk M, Jaroniec M. Chem Mater. 2000;12:222. [Google Scholar]
- 50.Kruk M, Jaroniec M. Chem Mater. 2001;13:3169. [Google Scholar]
- 51.Buckley AM, Greenblatt M. J Chem Educ. 1994;71:599. [Google Scholar]
Associated Data
This section collects any data citations, data availability statements, or supplementary materials included in this article.


