

Abstract
The genetic influences on bone mass likely change throughout the life span, but most genetic studies of bone mass regulation have focused on adults. There is, however, a growing awareness of the importance of genes influencing the acquisition of bone mass during childhood on lifelong bone health. The present investigation examines genetic influences on childhood bone mass by estimating the residual heritabilities of different measures of second metacarpal bone mass in a sample of 600 10-year-old participants from 144 families in the Fels Longitudinal Study. Bivariate quantitative genetic analyses were conducted to estimate genetic correlations between cortical bone mass measures, and measures of bone growth and development. Using a maximum likelihood-based variance components method for pedigree data, we found a residual heritability estimate of 0.71 for second metacarpal cortical index. Residual heritability estimates for individual measures of cortical bone (e.g., lateral cortical thickness, medial cortical thickness) ranged from 0.47 to 0.58, at this pre-pubertal childhood age. Low genetic correlations were found between cortical bone measures and both bone length and skeletal age. However, after Bonferonni adjustment for multiple testing, ρG was not significantly different from 0 for any of these pairs of traits. Results of this investigation provide evidence of significant genetic control over bone mass largely independent of maturation while bones are actively growing and before rapid accrual of bone that typically occurs during puberty.
Keywords: bone size, genetics, radiography, maturation
Introduction
The role of genetics in the acquisition of childhood bone mass is largely unknown. The phenotypic pattern of bone mass regulation over the life span, however, is well characterized. Bone accumulation dominates during childhood and peaks in early adulthood, while bone loss typically dominates later in life. Investigations of bone mass, both genetic and non-genetic, have traditionally focused on two definable aspects of this process; peak bone mass [21,22,44], and osteoporosis [3,47,48]. It is important to note that both are influenced by genetic and environmental factors, and their interactions, prior to the attainment of peak bone mass or onset of osteoporosis. Peak bone mass, for example, is the product of the genetic potential for bone accrual mediated by environmental factors from childhood through early adulthood, while the occurrence of osteoporosis is the result of the interaction between genes and environment on bone regulation subsequent to the attainment of peak bone mass.
Adult bone mass, primarily measured as bone mineral density (BMD), has typically been the focal phenotype in genetic studies of bone regulation in humans [6,8,9,18,29,38-40]. With the growing awareness of the importance of childhood bone accrual in determining adult bone health status, however, genetic studies are emerging that incorporate children into the study design. Many of these employ the parent-offspring study design, comparing each generation at different points of the life span. Heritability estimates of bone mass in these studies range from 0.18 to 0.79, and tend to have large standard errors [13,25].
Research using animal models, particularly rodents, has been successful in identifying a genetic component to bone growth and bone accrual. Knockout and transgenic mouse models have contributed significantly to knowledge of the effects of single genes in bone regulation, such as the insulin-like growth factor-1 and bone morphogenetic protein-4 genes [65,66]. Highly inbred strains of mice provide a powerful means for investigating genetic influences over bone phenotypes [1,5,26,31,62]. A substantial genetic influence on peak bone mass has also been demonstrated by this study design [32,45].
Bone mass measured during adulthood is a consequence of bone accrued during childhood and early adulthood, and any subsequent bone loss. Because bone accrual and loss each may have a unique genetic etiology, the study of genetic influences on adult bone mass ideally should take both processes into consideration. Bone mass measured during childhood represents only the amount of bone accrued up to that point in time, and should, therefore, be more proximal to genetic influences on bone accrual. Given the role of genetics in adult bone mass, and the difficulty involved in distinguishing between genes involved in bone acquisition versus bone loss, quantifying the heritability of bone mass in children provides important additional information for understanding the genetic architecture of bone accrual and maintenance.
In the current investigation, second metacarpal cortical bone thickness is used as a measure of childhood bone mass. Radiographic cortical bone thickness is a well-recognized valuable method for assessing bone biology, and has long been used as a measure of skeletal mass [4,10,12,15,16,29,30,39,40,42]. Cortical thickness is measured as the amount of bone tissue present between the periosteal and endosteal surfaces. In metacarpals, the cortical thickness represents 90% of bone mineral contained in those bones [17]. Cortical measurements taken on a cylindrical bone such as the second metacarpal are generally more reliable than those taken from other bones [15]. Additionally, measures of cortical bone are less affected by short-term temporal fluctuation in bone mass caused by seasonal variation and weight changes than measures of bone mineral density or bone mineral content obtained from dual energy x-ray absorptiometry [29].
The aim of this paper is to estimate the narrow-sense heritability (additive genetic effect) of second metacarpal cortical bone mass after accounting for covariate effects, and examine genetic correlations between cortical bone mass and both skeletal maturation and bone size (i.e., bone length).
Materials and methods
Study Sample
Data for the current study were collected from participants of the Fels Longitudinal Study, the world’s largest and longest-running longitudinal study of human growth, development, and body composition change over the life span [49]. The study sample for the current investigation is comprised of a subset of 600 participants (317 males, 283 females) in the Fels Longitudinal Study for whom hand-wrist radiographs were available at age 10 years. The 600 x-rays used in this study were taken between 1932 and 2001. The majority of these individuals were examined within 2 weeks of their 10th birthday; all were examined within 6 months of their 10th birthday. It is important to emphasize that although the 600 individuals in this study sample span up to three generations (see below), all of them were x-rayed at the same age. This single pre-pubertal age was chosen in order to minimize variation in bone measurements that could be attributed to age or growth status, and to minimize sex differences in bone mass that normally arise with the onset of puberty. In so doing, the ability to detect genetic involvement in the study traits is enhanced. However, in order to examine potential effects of age even within this age-delimited sample, age was tested for its covariate effect on each bone trait in the analyses.
Because of the longevity of the Fels Longitudinal Study, and the participation of individuals from several dozen large nuclear and extended families, the study sample of 600 individuals contains many relative pairs spanning up to three generations. The median family size for this sample is 4; the mean family size is 6; and the maximum number of individual in a single family is 59. Relative pairs in each family range from 1st degree relatives (e.g., sibling and parent-offspring pairs) to 8th degree relatives (e.g., 3rd cousins twice removed). Table 1 shows the distribution of the 2,925 total relative pairs represented among the 600 individuals from 144 families examined in this study.
Table 1.
Relative pairs contained in the quantitative genetic analyses of 600 10-year-olds in 144 families.
| Relationship | Degree | N |
|---|---|---|
| Parent-offspring | 1st | 244 |
| Siblings | 428 | |
| Grandparent-grandchild | 2nd | 73 |
| Avuncular | 439 | |
| Half-siblings | 89 | |
| Grand avuncular | 3rd | 61 |
| Half avuncular | 124 | |
| 1st cousins | 398 | |
| 1st cousins, once removed | 4th | 348 |
| Half 1st cousins | 65 | |
| Other | 656 | |
| Total | 2,925 |
Bone Measurements
Quantitative measurements of bone mass from radiographs were obtained from the second metacarpal in each individual according to standard methods [15,46]. Bone diameter, medial cortical thickness, and lateral cortical thickness were each measured in millimeters at three locations on the second metacarpal (Figure 1a): 1) at mid-shaft of total bone length (diaphysis + epiphysis), 2) at mid-shaft of diaphysis, and 3) at the location of minimum shaft width. All measurements were taken perpendicular to the long axis of the bone directly from original radiographs using digital Mitutoyo calipers with direct input to a PC. Two additional variables were calculated from these measures: 1) Total cortical thickness, calculated as the sum of medial and lateral cortex; and 2) Cortical Index (CI), calculated as total cortex/bone diameter. Most studies generally measure cortical bone mass only at mid-shaft of the bone, but in this juvenile sample measurements were taken at 3 locations on the shaft of the second metacarpal. Because bone measures taken at the three locations in our sample are highly correlated (r = 0.78, 0.80, 0.84), we present only the results based on measurements taken at minimum shaft width. Smith [58,59] has shown that in growing bones, measurements taken at the location of minimum shaft width are as reliable as those taken at mid-shaft, and are homologous throughout growth. All measurements were made by a single individual. Intra-class correlation coefficients, calculated using a two-way mixed effect model, for repeated measures ranged from 0.96 (for medial cortical thickness) to 0.99 (for bone diameter).
Figure 1.
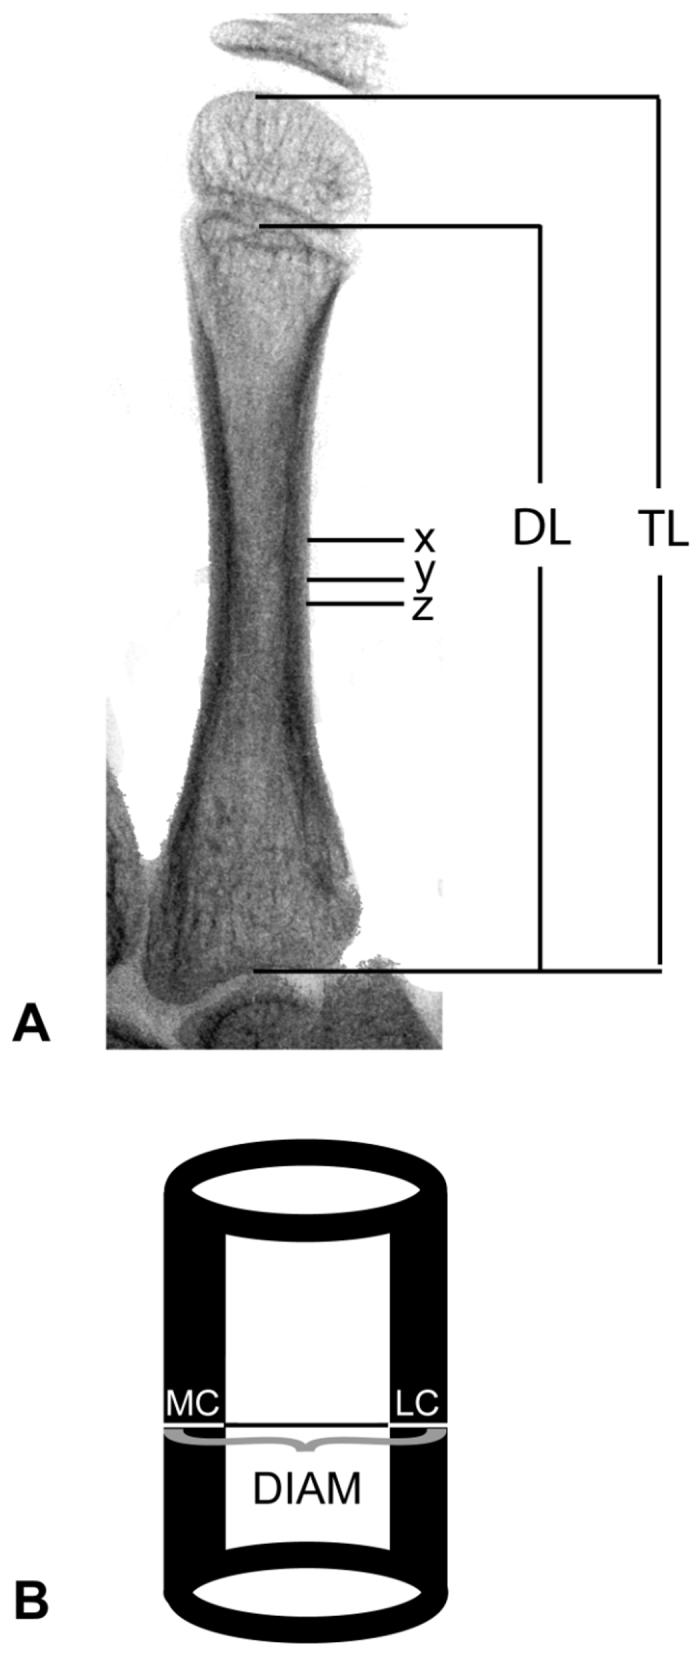
Measurements. (A) Inverted x-ray of metacarpal; TL = total length, DL = diaphyseal length, X = mid-point of TL, Y = minimum shaft width, Z = mid-point of DL. (B) Diagram of measurement to be taken at each of the above locations; MC = medial cortex, LC = lateral cortex, DIAM = total diameter.
Assessment of skeletal maturation
Skeletal maturation (i.e., skeletal age) was quantified using the FELS method for the hand-wrist [50]. The FELS method is a maximum likelihood approach that uses various measured and graded indicators of skeletal maturity. Graded maturity indicators include radiographic features pertaining to ossification onset, bone shape, joint formation, and epiphyseal fusion. Measured indicators include epiphyseal and metaphyseal width expressed as a ratio. It is important to note that cortical bone thickness is not a feature used to assess skeletal maturity. Skeletal maturation refers to the progress of a child’s bone development, and is distinct from what can be determined from linear bone growth. At any given chronological age a child’s skeletal age can vary by as much as ± 3 years from his or her chronological age. This discrepancy indicates whether the child is relatively advanced, delayed, or on-track in their skeletal development.
Statistical and genetic analyses
Quantitative genetic methods were used to estimate the residual heritability of second metacarpal cortical bone mass traits. Narrow sense heritability, defined as the proportion of phenotypic variance attributable to additive genetic effects, was estimated using a maximum likelihood-based variance components method that uses all familial information for parameter estimation [34] as implemented in Sequential Oligogenic Linkage Analyses Routines (SOLAR version 2.1.2) [2]. In this approach, the covariance matrix for a pedigree is given by
| [1] |
where Φ is the kinship matrix for the pedigree, σ2a is the trait variance due to additive genetic effects, In is the n x n identity matrix, and σ2e is the trait variance due to random, individual-specific, environmental effects. The basic parameters estimated include the trait mean, standard deviation, and h2, where . The null hypothesis is that σa2 equals zero. Significance was tested by comparing the likelihoods of restricted models in which σa2 was set to zero to those of general models in which σa2 was estimated [11]. Variables examined for covariate effects included age, sex, age2, age-by-sex interaction, age2-by-sex interaction, skeletal age, stature, body mass index (BMI), and second metacarpal length. To account for a possible secular trend in bone mass, we also tested the x-ray date (year x-ray was taken) for its covariate effect on the bone mass traits. To estimate the effects of these various covariates on the study traits, each covariate was screened in SOLAR by comparing the likelihood for a model that included the covariate to the likelihood for a model that excluded the covariate. The two models were otherwise identical. Only the covariates significant at the p < 0.05 level were retained in the final model for each second metacarpal cortical bone trait. Heritabilities were also estimated for the skeletal age and second metacarpal bone length traits that were examined in bivariate genetic analyses.
Bivariate quantitative genetic methods were used to determine the existence of shared genetic effects on cortical bone traits and both skeletal age and second metacarpal length. Using bivariate extensions available in the SOLAR analytic platform, the phenotypic correlations were partitioned into additive genetic and random environmental components [34,41] as given in equation 2
| [2] |
where ρP is the phenotypic correlation, ρG is the genetic correlation, and ρE is the environmental correlation between trait pairs, and h12 and h12 are the heritabilities for trait 1 and trait 2, respectively. Additive genetic correlations (ρG) range from -1.0 to 1.0, where a value of 1.0 indicates complete positive pleiotropy (i.e., the same genes are affecting the two traits in the same direction), a value of zero between the traits indicates that different genes control them, and a value of -1.0 indicates complete negative pleiotropy (i.e., genes that act to increase the value of one trait act to decrease the trait value of the other). A genetic correlation significantly different from both 0 and 1 (or -1.0) indicates incomplete pleiotropy, meaning that the two traits are influenced to some extent by the same genes, but that each trait also has a genetic basis unique from the other. Because of multiple testing issues and increased chance of committing Type I errors, our original alpha of 0.05 is adjusted for the genetic correlation analyses using a Bonferroni correction, which sets an alpha of 0.005 for determination of significance.
Results
Descriptive statistics of the study sample, including sex-specific means and standard deviations for body measurements and radiographic measures of cortical bone mass, are shown in Table 2. Age, height, weight, BMI, skeletal age, and second metacarpal length were similar in both sexes. CI in females was slightly higher than in males, but cortical thickness measures and second metacarpal diameter tended to be higher in males. The sample-wide coefficients of variation ranged from 11.8 to 15.5%.
Table 2.
Phenotypic descriptive statistics from 600 10-year-old boys and girls.
| Males (n = 317) |
Females (n = 283) |
|||||
|---|---|---|---|---|---|---|
| Range | Mean | SD | Range | Mean | SD | |
| Age (years) | 9.78 - 10.45 | 10.00 | 0.06 | 9.55 - 10.20 | 10.00 | 0.05 |
| Stature (cm) | 123.6 - 157.25 | 140.04 | 5.68 | 123.80 - 157.00 | 139.24 | 6.09 |
| Weight (kg) | 20.18 - 67.90 | 33.86 | 6.44 | 21.60 - 76.26 | 33.60 | 7.41 |
| BMI (kg/m2) | 12.98 - 33.58 | 17.18 | 2.52 | 11.73 - 30.94 | 17.20 | 2.82 |
| Skeletal age (years)a | 7.15 - 13.07 | 9.93 | 1.08 | 7.73 - 12.71 | 10.24 | 1.05 |
| Second metacarpal length (mm) | 46.89 - 59.58 | 53.46 | 2.85 | 45.51 - 61.62 | 53.77 | 3.36 |
| Cortical Bone Variables: | ||||||
| Cortical Index (CI) | 0.34 - 0.72 | 0.54 | 0.07 | 0.40 - 0.72 | 0.58 | 0.06 |
| Medial Cortex (mm) | 0.88 - 2.37 | 1.68 | 0.26 | 0.95 - 2.60 | 1.68 | 0.26 |
| Lateral Cortex (mm) | 1.05 - 2.74 | 1.97 | 0.29 | 1.27 - 3.00 | 2.02 | 0.29 |
| Total cortex (mm) | 1.93 - 5.10 | 3.65 | 0.49 | 2.22 - 5.17 | 3.70 | 0.49 |
| Bone Diameter (mm) | 4.74 - 8.46 | 6.71 | 0.60 | 5.10 - 7.95 | 6.38 | 0.58 |
estimate based on FELS method
Table 3 lists residual heritability estimates and their standard errors for the cortical bone traits examined. All cortical measures were significantly heritable (p < 0.001) and of moderate to high magnitude. Residual heritability estimates ranged from 0.47 (for medial cortical thickness) to 0.71 (for CI). Additionally, second metacarpal bone length and skeletal age were likewise significantly heritable (p < 0.001) and of high magnitude (bone length h2 = 0.73; skeletal age h2 = 0.70).
Table 3.
Maximum likelihood estimates of parameters from univariate models of second metacarpal bone measures (estimate ± standard error)a.
| Cortical Index | Medial Cortex | Lateral Cortex | Total Cortex | Bone Diameter | |
|---|---|---|---|---|---|
| h2 | 0.71 ± 0.10 | 0.47 ± 0.10 | 0.45 ± 0.11 | 0.58 ± 0.11 | 0.64 ± 0.11 |
| μ | 0.55 ± 0.004 | 1.69 ± 0.012 | 1.98 ± 0.005 | 3.69 ± 0.026 | 6.74 ± 0.03 |
| σ | 0.06 ± 0.002 | 0.24 ± 0.008 | 0.27 ± 0.008 | 0.46 ± 0.014 | 0.53 ± 0.02 |
| β sex | 0.04 ± 0.005 | nsb | 0.04 ± 0.022 | ns | -0.38 ± 0.04 |
| β skeletal age | ns | 0.032 ± 0.01 | 0.04 ± 0.012 | 0.08 ± 0.02 | 0.07 ± 0.02 |
| β x-ray date | -0.0005 ± 0.000015 | -0.002 ± 0.00004 | -0.004 ± 0.00006 | -0.006 ± 0.0001 | -0.0007 ± 0.0001 |
| β | ns | 0.016 ± 0.004 | 0.012 ± 0.004 | 0.026 ± 0.006 | 0.05 ± 0.0008 |
| β | ns | ns | ns | ns | 0.03 ± 0.001 |
| % of variance due to covariates | 10.40% | 11.88% | 12.90% | 14.93% | 26.74% |
In these models males were coded as 0, females as 1.
ns: not significant (p ≥0.05)
For each cortical bone variable there were several significant covariates. The proportion of phenotypic variation explained by covariates is given in Table 3. Covariates that were significant in at least one model are listed in Table 3. Age, age2 and age-sex interactions were not significant covariates for any trait examined. Sex was a significant covariate for CI, lateral cortex, and bone diameter. Skeletal age and bone length were not significant covariates for CI, but were significant for each of the cortical thickness measures, and for second metacarpal bone diameter. BMI was a significant covariate only for bone diameter. X-ray date was a significant covariate for all cortical bone variables examined.
The results of the bivariate analyses are presented in Table 4. Phenotypic correlations between CI and both bone length and skeletal age were very low (0.01 and 0.03, respectively). Phenotypic correlations between individual measures of second metacarpal cortical thickness and both bone length and skeletal age, however, were modest, ranging from 0.16 to 0.25. The highest phenotypic correlations were between bone diameter and bone length (ρp = 0.24), and bone diameter and skeletal age (ρp = 0.32).
Table 4.
Phenotypic (ρP) and genetic correlations (ρG) between bone mass traits and bone length and skeletal age.
| BONE LENGTH |
SKELETAL AGE |
|||||||
|---|---|---|---|---|---|---|---|---|
| p-value |
p-value |
|||||||
| ρP | ρG | SE | diff from 0 | ρP | ρG | SE | diff from 0 | |
| Cortical Index | 0.01 | 0.01 | 0.12 | 0.92 | 0.03 | 0.03 | 0.12 | 0.82 |
| Medial Cortex | 0.16 | 0.21 | 0.13 | 0.13 | 0.21 | 0.17 | 0.14 | 0.22 |
| Lateral Cortex | 0.20 | 0.25 | 0.13 | 0.07 | 0.21 | 0.17 | 0.14 | 0.25 |
| Total Cortex | 0.24 | 0.22 | 0.12 | 0.08 | 0.25 | 0.18 | 0.13 | 0.19 |
| Bone Diameter | 0.32 | 0.30 | 0.11 | 0.02 | 0.24 | 0.28 | 0.13 | 0.04 |
Genetic correlations (ρG) between cortical measures and bone length and skeletal age ranged from 0.01 to 0.30. All genetic correlations tested were not significantly different from 0 using the Bonferroni-adjusted alpha, and all were significantly different from 1.
Discussion
The evidence for a significant role of genetics in determining adult bone mass is unequivocal. The extent to which bone mass in childhood is genetically influenced, however, is less well documented. Understanding the genetic influences on childhood bone mass is vital for understanding bone health and the etiology of diseases involving the regulation of bone mass. For instance, it has been demonstrated that genes influencing bone accrual directly affect peak bone mass, which is the strongest predictor of developing osteoporosis in later life [24].
Our statistical genetic analyses of cortical bone traits in a sample of 600 10-year-olds demonstrate that after accounting for covariate effects, bone mass is significantly heritable in pre-pubertal children. Residual heritability estimates in our study sample (ranging from 0.45 to 0.71) are comparable to, and in some cases higher than, those from other studies and other populations [18,28,33,35,36,40,43,64]. For example, narrow-sense heritability estimates for adult BMD from nuclear families have been reported to be between 0.53 and 0.84 [18,28,64]. In our previous work, adult BMD and quantitative heel ultrasound measurements of bone were shown to be highly heritable in large extended families, with residual h2 ranging from 0.52 to 0.75 [35,36]. Adult bone mass as assessed by radiographs has also been shown to be 58% to 66% heritable [40]. Similar bone mass heritabilities have been shown in other taxa, including non-human primates, where 40% to 70% of the phenotypic variance in bone mass or serum markers of bone turnover is attributable to genetic variation [20,27,37]. Recently, areal BMD of the distal forearm in the baboon (P. hamadryas spp.) has been shown to have significant heritabilities ranging from 0.18 to 0.42 [19].
The current study is unique in that it provides strong evidence for genetic involvement in bone mass during the pre-pubertal stage of childhood. Ferrari et al. [13] estimated heritabilities by maternal descent (1/2 h2) of 0.18 to 0.38 for bone mass variables using mother-daughter pairs. Jones and Nguyen [25], also using mother-offspring pairs, estimated heritabilities of regional and total body bone mineral density between 0.24 (mother-son) and 0.79 (mother-daughter), but with large confidence intervals around the estimates. These studies provide important information regarding the inheritance of bone phenotypes, but, because of inherent limitations of the parent-offspring study design (i.e, comparing the adult state of bone mass to the child state of bone mass) they are vulnerable to age-related variation not accounted for by simple age and age2 adjustments of trait means.
Our study design incorporated childhood bone measures from members representing several generations of families, ranging in size from nuclear families to large extended pedigrees. And furthermore, these familial data consist of bone mass measured at 10 years of age for each individual, thus effectively eliminating potential sources of variation introduced by age.
We found evidence for a slight secular trend in the bone mass traits. This trend, small though it may be, may represent changes in lifestyle over the past 3 generations in this area of the midwestern United States. With a shift from rural to urban life and changes in physical activity and nutrition of young children, we may expect to see a slight change in childhood bone mass [60], which may eventually affect patterns of bone mass in adulthood.
In our bivariate quantitative genetic analyses we found no evidence for shared genetic influences on cortical bone mass and skeletal age at chronological age 10 years when using the stringent Bonferonni-adjusted alpha. Using the same criterion, each cortical bone mass trait also was found to be genetically independent from measures of linear bone growth (i.e., second metacarpal length). Although not statistically significant, and therefore not generalizable to the larger population, it is important to note that ρG estimates for all trait pairs except CI pairs were not zero. While other studies have not reported a genetic relationship between bone mass and skeletal maturation, it is reasonable to hypothesize that at different ages or in expanded age ranges genetic covariance between bone mass and skeletal maturation may be increased and reach significant levels. Therefore, the genetic independence of bone mass and skeletal maturation found here in 10-year-olds warrants further study in children of other ages. In the bivariate analyses we also found that second metacarpal diameter and skeletal maturation are likewise influenced by unique sets of genes. Results of the genetic correlation analyses emphasize that the processes of skeletal growth and maturation are distinct phenomena, and indicates that while these traits may be loosely correlated at the phenotypic level, each is influenced by unique sets of genes.
As stated in the introduction, bone mass phenotypes change throughout life. Likewise, the influence of genes on bone mass also varies with age. Unfortunately, the heritability of bone mass over much of the life span in humans is largely unknown, and estimated values differ based on factors such as bone site or sex studied. However, a pattern of genetic influences over bone mass is beginning to materialize, based primarily on cross-sectional evidence, although some genetic studies of longitudinal changes in BMD in older adults are being conducted (see [52]). Comparisons of heritabilities of bone mass in younger and older twin pairs suggest that bone mass may be under tighter genetic control in early life than in later life [51,56,57]. Based on the residual heritability of a number of other early childhood traits such as birth weight, recumbent length and basicranial skeletal dimensions, it would be expected that the heritability of bone mass at birth and during early childhood is high [7,14,54,61,63]. Additional support of this early genetic control of bone mass can be found in rodent studies where rates of bone formation and apposition appear to be under genetic control in mice as young as 6 weeks of age [53]. Strong genetic effects on bone mass are also evident post-puberty, and bone mass heritability is said to reach its peak (h2 ≈ 0.84) at the time of peak bone mass [18,21,55]. Subsequent to this peak, genetic influences on bone mass steadily decrease [21]. Some researchers have shown that the genetic influence on bone mass in girls may reach its highest childhood value just prior to puberty, before it falls during the pubertal years, when environmental influences may be very strong [23]. The work presented here is the first direct evidence of strong genetic effects on pre-pubertal childhood bone mass in both boys and girls.
The current study adds to the ongoing discussion of genetic influences on bone mass over the life span. Our results are particularly important because they provide evidence of significant genetic control over bone mass while bones are actively growing and before the rapid bone accrual that typically occurs during puberty. We also have shown that the genes influencing skeletal maturation and linear bone growth are distinct from those controlling cortical bone thickness at this early childhood age. Our future longitudinal studies of the genetics of childhood bone mass will further elucidate the role of genes in this important indicator of bone health.
Acknowledgments
We thank the participants in the Fels Longitudinal Study for their dedication to basic biomedical research. We thank Heather Broughton for assistance in radiographic measurements. And, we sincerely appreciate the helpful comments of the two anonymous reviewers of this paper. This work was supported by United States of America National Institutes of Health grants HD36342, HD12252, and AR052147.
Footnotes
Publisher's Disclaimer: This is a PDF file of an unedited manuscript that has been accepted for publication. As a service to our customers we are providing this early version of the manuscript. The manuscript will undergo copyediting, typesetting, and review of the resulting proof before it is published in its final citable form. Please note that during the production process errorsmaybe discovered which could affect the content, and all legal disclaimers that apply to the journal pertain.
References
- [1].Akhter MP, Iwaniec UT, Covey MA, Cullen DM, Kimmel DB, Recker RR. Genetic variations in bone density, histomorphometry, and strength in mice. Calcif Tissue Int. 2000;67:337–344. doi: 10.1007/s002230001144. [DOI] [PubMed] [Google Scholar]
- [2].Almasy L, Blangero J. Multipoint quantitative-trait linkage analysis in general pedigrees. Am J Hum Genet. 1998;62:1198–1211. doi: 10.1086/301844. [DOI] [PMC free article] [PubMed] [Google Scholar]
- [3].Audi L, Garcia-Ramirez M, Carrascosa A. Genetic determinants of bone mass. Horm Res. 1999;51:105–123. doi: 10.1159/000023343. [DOI] [PubMed] [Google Scholar]
- [4].Barnett E, Nordin BEC. The radiological diagnosis of osteoporosis: a new approach. Clin Radiol. 1960;11:166–174. doi: 10.1016/s0009-9260(60)80012-8. [DOI] [PubMed] [Google Scholar]
- [5].Beamer WG, Donahue LR, Rosen CJ, Baylink DJ. Genetic variability in adult bone density among inbred strains of mice. Bone. 1996;18:397–403. doi: 10.1016/8756-3282(96)00047-6. [DOI] [PubMed] [Google Scholar]
- [6].Christian JC, Yu PL, Slemenda CW, Johnston CC., Jr. Heritability of bone mass: a longitudinal study in aging male twins. Am J Hum Genet. 1989;44:429–433. [PMC free article] [PubMed] [Google Scholar]
- [7].Clausson B, Lichtenstein P, Cnattinigius S. Genetic influence on birthweight and gestational length determined by studies in offspring of twins. Br J Genet. 2000;107:375–81. doi: 10.1111/j.1471-0528.2000.tb13234.x. [DOI] [PubMed] [Google Scholar]
- [8].Cohen Z, Kalichman L, Kobyliansky E, Malkin I, Almog E, Livshits G. Cortical index and size of hand bones: segregation analysis and linkage with the 11q12-13 segment. Med Sci Monit. 2003;9:MT13–MT20. [PubMed] [Google Scholar]
- [9].Deng HW, Livshits G, Yakovenko K, Xu FH, Conway T, Davies KM, Deng H, Recker RR. Evidence for a major gene for bone mineral density/content in human pedigrees identified via probands with extreme bone mineral density. Ann Hum Genet. 2002;66:61–74. doi: 10.1017/S0003480001008958. [DOI] [PubMed] [Google Scholar]
- [10].Dequeker J. Quantitative radiology: radiogrammetry of cortical bone. Br J Radiol. 1976;49:912–920. doi: 10.1259/0007-1285-49-587-912. [DOI] [PubMed] [Google Scholar]
- [11].Edwards AWF. Likelihood. Expanded ed. Johns Hopkins University Press; Baltimore: 1992. [Google Scholar]
- [12].Exton-Smith AN, Millard PH, Payne PR, Wheeler EF. Method for measuring quantity of bone. The Lancet. 1969;7631:1153–1154. doi: 10.1016/s0140-6736(69)92482-9. [DOI] [PubMed] [Google Scholar]
- [13].Ferrari S, Rizzoli R, Slosman D, Bonjour JP. Familial resemblance for bone mineral mass is expressed before puberty. J Clin Endocrinol Metab. 1998;83:358–361. doi: 10.1210/jcem.83.2.4583. [DOI] [PubMed] [Google Scholar]
- [14].Fischbein S, Nordqvist T. Profile comparisons of physical growth for monozygotic and dizygotic twin pairs. Ann Hum Biol. 1978;5:321–8. doi: 10.1080/03014467800002971. [DOI] [PubMed] [Google Scholar]
- [15].Garn SM. The Earlier Gain and the Later Loss of Cortical Bone. Bannerstone House; Springfield, IL: 1970. [Google Scholar]
- [16].Garn SM, Poznanski AK, Nagy JM. Bone measurement in the differential diagnosis of osteopenia and osteoporosis. Radiology. 1971;100:509–518. doi: 10.1148/100.3.509. [DOI] [PubMed] [Google Scholar]
- [17].Garn SM, Feutz E, Colbert C, Wagner B. Progress in Development of Methods in Bone Densitometry. NASA; Washington D.C.: 1966. Comparison of cortical thickness and radiographic microdensitometry in the measurement of bone loss; pp. 65–77. [Google Scholar]
- [18].Gueguen R, Jouanny P, Guillemin F, Kuntz C, Pourel J, Siest G. Segregation analysis and variance components analysis of bone mineral density in healthy families. J Bone Miner Res. 1995;10:2017–2022. doi: 10.1002/jbmr.5650101223. [DOI] [PubMed] [Google Scholar]
- [19].Havill LM, Mahaney MC, Cox LA, Morin PA, Joslyn G, Rogers J. A quantitative trait locus for normal variation in forearm bone mineral density in pedigreed baboons maps to the ortholog of human chromosome 11q. J Clin Endocrinol Metab. 2005;90:3638–3645. doi: 10.1210/jc.2004-1618. [DOI] [PubMed] [Google Scholar]
- [20].Havill LM, Mahaney MC, Rogers J. Genotype-by-sex and environment-by-sex interactions influence variation in serum levels of bone-specific alkaline phosphatase in adult baboons (Papio hamadryas) Bone. 2004;35:198–203. doi: 10.1016/j.bone.2004.02.022. [DOI] [PubMed] [Google Scholar]
- [21].Heaney RP, Abrams S, Dawson-Hughes B, Looker A, Marcus R, Matkovic V, Weaver C. Peak bone mass. Osteoporos Int. 2000;11:985–1009. doi: 10.1007/s001980070020. [DOI] [PubMed] [Google Scholar]
- [22].Henry YM, Fatayerji D, Eastell R. Attainment of peak bone mass at the lumbar spine, femoral neck and radius in men and women: relative contributions of bone size and volumetric bone mineral density. Osteoporos Int. 2004;15:263–273. doi: 10.1007/s00198-003-1542-9. [DOI] [PubMed] [Google Scholar]
- [23].Hopper JL, Green RM, Nowson CA, Young D, Sherwin AJ, Kaymakci B, Larkins RG, Wark JD. Genetic, common environment, and individual specific components of variance for bone mineral density in 10- to 26-year-old females: a twin study. Am J Epidemiol. 1998;147:17–29. doi: 10.1093/oxfordjournals.aje.a009361. [DOI] [PubMed] [Google Scholar]
- [24].Hui SL, Zhou L, Evans R, Slemenda CW, Peacock M, Weaver CM, McClintock C, Johnston CC., Jr. Rates of growth and loss of bone mineral in the spine and femoral neck in white females. Osteoporos Int. 1999;9:200–205. doi: 10.1007/s001980050137. [DOI] [PubMed] [Google Scholar]
- [25].Jones G, Nguyen TV. Associations between maternal peak bone mass and bone mass in prepubertal male and female children. J Bone Miner Res. 2000;15:1998–2004. doi: 10.1359/jbmr.2000.15.10.1998. [DOI] [PubMed] [Google Scholar]
- [26].Judex S, Garman R, Squire M, Donahue LR, Rubin C. Genetically based influences on the site-specific regulation of trabecular and cortical bone morphology. J Bone Miner Res. 2004;19:600–606. doi: 10.1359/JBMR.040101. [DOI] [PubMed] [Google Scholar]
- [27].Kammerer CM, Sparks ML, Rogers J. Effects of age, sex, and heredity on measures of bone mass in baboons (Papio hamadryas) J Med Primatol. 1995;24:236–242. doi: 10.1111/j.1600-0684.1995.tb00176.x. [DOI] [PubMed] [Google Scholar]
- [28].Karasik D, Cupples LA, Hannan MT, Kiel DP. Age, gender, and body mass effects on quantitative trait loci for bone mineral density: the framingham study. Bone. 2003;33:308–316. doi: 10.1016/s8756-3282(03)00173-x. [DOI] [PubMed] [Google Scholar]
- [29].Karasik D, Ginsburg E, Livshits G, Pavlovsky O, Kobyliansky E. Evidence of major gene control over cortical bone loss in humans. Genet Epidemiol. 2000;19:410–421. doi: 10.1002/1098-2272(200012)19:4<410::AID-GEPI11>3.0.CO;2-K. [DOI] [PubMed] [Google Scholar]
- [30].Karasik D, Otremsky I, Barach I, Yakovenko K, Batsevich V, Pavlovsky O, Kobyliansky E, Livshits G. Comparative analysis of age prediction by markers of bone change in the hand assessed by roentgenography. Am J Hum Biol. 1999;11:31–43. doi: 10.1002/(SICI)1520-6300(1999)11:1<31::AID-AJHB3>3.0.CO;2-L. [DOI] [PubMed] [Google Scholar]
- [31].Klein RF. Genetic regulation of bone mineral density in mice. J Musculoskelet Neuronal Interact. 2002;2:232–236. [PubMed] [Google Scholar]
- [32].Klein RF, Shea M, Gunness ME, Pelz GB, Belknap JK, Orwoll ES. Phenotypic characterization of mice bred for high and low peak bone mass. J Bone Miner Res. 2001;16:63–71. doi: 10.1359/jbmr.2001.16.1.63. [DOI] [PubMed] [Google Scholar]
- [33].Koller DL, White KE, Liu G, Hui SL, Conneally PM, Johnston CC, Econs MJ, Foroud T, Peacock M. Linkage of structure at the proximal femur to chromosomes 3, 7, 8, and 19. J Bone Min Res. 2003;18:1057–1065. doi: 10.1359/jbmr.2003.18.6.1057. [DOI] [PubMed] [Google Scholar]
- [34].Lange K, Boehnke M. Extensions to pedigree analysis. VI. Covariance components models for multivariate traits. Am J Med Genet. 1983;14:513–524. doi: 10.1002/ajmg.1320140315. [DOI] [PubMed] [Google Scholar]
- [35].Lee M, Czerwinski SA, Choh AC, Demerath EW, Sun SS, Chumlea WC, Towne B, Siervogel RM. Unique and common genetic effects between bone mineral density and calcaneal quantitative ultrasound measures: the Fels Longitudinal Study. Osteoporos Int. 2006 doi: 10.1007/s00198-006-0075-4. [DOI] [PubMed] [Google Scholar]
- [36].Lee M, Czerwinski SA, Choh AC, Towne B, Demerath EW, Chumlea WC, Sun SS, Siervogel RM. Heritability of calcaneal quantitative ultrasound measures in healthy adults from the Fels Longitudinal Study. Bone. 2004;35:1157–1163. doi: 10.1016/j.bone.2004.07.007. [DOI] [PubMed] [Google Scholar]
- [37].Lipkin EW, Aumann CA, Newell-Morris LL. Evidence for common controls over inheritance of bone quantity and body size from segregation analysis in a pedigreed colony of nonhuman primates. Bone. 2001;29:249–257. doi: 10.1016/s8756-3282(01)00508-7. [DOI] [PubMed] [Google Scholar]
- [38].Livshits G, Deng HW, Nguyen TV, Yakovenko K, Recker RR, Eisman JA. Genetics of bone mineral density: evidence for a major pleiotropic effect from an intercontinental study. J Bone Miner Res. 2004;19:914–923. doi: 10.1359/JBMR.040132. [DOI] [PubMed] [Google Scholar]
- [39].Livshits G, Karasik D, Otremsky I, Kobyliansky E. Genes play an important role in bone aging. Am J Hum Biol. 1998;10:421–438. doi: 10.1002/(SICI)1520-6300(1998)10:4<421::AID-AJHB3>3.0.CO;2-J. [DOI] [PubMed] [Google Scholar]
- [40].Livshits G, Yakovenko K, Kobyliansky E. Quantitative genetic study of radiographic hand bone size and geometry. Bone. 2003;32:191–198. doi: 10.1016/s8756-3282(02)00954-7. [DOI] [PubMed] [Google Scholar]
- [41].Lynch M, Walsh B. Genetics and Analysis of Quantitative Traits. Sinauer Associates; Sunderland, MA: 1998. [Google Scholar]
- [42].Malina R, Katzmarzyk PT, Beunen GP. Relation between birth weight at term and growth rate, skeletal age, and cortical bone at 6-11 years. Am J Hum Biol. 1999;11:505–511. doi: 10.1002/(SICI)1520-6300(1999)11:4<505::AID-AJHB10>3.0.CO;2-6. [DOI] [PubMed] [Google Scholar]
- [43].Mitchell BD, Kammerer CM, Schneider JL, Perez R, Bauer RL. Genetic and environmental determinants of bone mineral density in Mexican Americans: results from the San Antonio Family Osteoporosis Study. Bone. 2003;33:839–846. doi: 10.1016/s8756-3282(03)00246-1. [DOI] [PubMed] [Google Scholar]
- [44].Nguyen TV, Maynard LM, Towne B, Roche AF, Wisemandle W, Li J, Guo SS, Chumlea WC, Siervogel RM. Sex differences in bone mass acquisition during growth: the Fels Longitudinal Study. J Clin Densitom. 2001;4:147. doi: 10.1385/jcd:4:2:147. [DOI] [PubMed] [Google Scholar]
- [45].Orwoll ES, Belknap JK, Klein RF. Gender specificity in the genetic determinants of peak bone mass. J Bone Miner Res. 2001;16:1962–1971. doi: 10.1359/jbmr.2001.16.11.1962. [DOI] [PubMed] [Google Scholar]
- [46].Plato CC, Fox KM, Tobin JD. Skeletal Changes in Human Aging. In: Crews DE, Garruto RM, editors. Biological Anthropology and Aging: Perspectives on human variation over the life span. Oxford University Press; New York: 1994. [Google Scholar]
- [47].Recker RR, Deng HW. Role of genetics in osteoporosis. Endocrine. 2002;17:55–66. doi: 10.1385/ENDO:17:1:55. [DOI] [PubMed] [Google Scholar]
- [48].Report of a WHO study group . Assessment of fracture risk and its application to screening for postmenopausal osteoporosis. 843 ed. World Health Organization; Geneva: 1994. [PubMed] [Google Scholar]
- [49].Roche AF. Growth, Maturation, and Body Composition: The Fels Longitudinal Study. Cambridge University Press; Cambridge: 1992. [Google Scholar]
- [50].Roche AF, Chumlea WmC, Thissen D. Assessing the Skeletal Maturity of the Hand-Wrist: FELS Method. Charles C. Thomas; Springfield: 1988. [DOI] [PubMed] [Google Scholar]
- [51].Rubin LA, Patel MS, Cole DE. Genetic determinants of bone mass acquistion and risk for osteoporosis. Drug Dev Res. 2000;49:216–226. [Google Scholar]
- [52].Shafer JR, Kammerer CM, Bruder J, Bauer RL, Mitchell BD. Five-year change in bone mineral density is heritable in Mexican Americans: The San Antonio Family Ostoporosis Study. ASBMR. [serial online] [Google Scholar]
- [53].Sheng MH, Baylink DJ, Beamer WG, Donahue LR, Rosen CJ, Lau KH, Wergedal JE. Histomorphometric studies show that bone formation and bone mineral apposition rates are greater in C3H/HeJ (high-density) than C57BL/6J (low-density) mice during growth. Bone. 1999;25:421–429. doi: 10.1016/s8756-3282(99)00184-2. [DOI] [PubMed] [Google Scholar]
- [54].Sherwood RJ, Duren D, Blangero J, Towne B. Genetic architecture of the human skull during growth. Acta Medica Auxologica. 2004 Abstracts:98-99. [Google Scholar]
- [55].Shimizu M, Higuchi K, Bennett B, Xia C, Tsuboyama T, Kasai S, Chiba T, Fujisawa H, Kogishi K, Kitado H, Kimoto M, Takeda N, Matsushita M, Okumura H, Serikawa T, Nakamura T, Johnson TE, Hosokawa M. Identification of peak bone mass QTL in a spontaneously osteoporotic mouse strain. Mamm Genome. 1999;10:81–87. doi: 10.1007/s003359900949. [DOI] [PubMed] [Google Scholar]
- [56].Slemenda CW, Christian JC, Williams CJ, Norton JA, Johnston CC., Jr. Genetic determinants of bone mass in adult women: a reevaluation of the twin model and the potential importance of gene interaction on heritability estimates. J Bone Miner Res. 1991;6:561–567. doi: 10.1002/jbmr.5650060606. [DOI] [PubMed] [Google Scholar]
- [57].Smith DM, Nance WE, Kang KW, Christian JC, Johnston CC., Jr. Genetic factors in determining bone mass. J Clin Invest. 1973;52:2800–2808. doi: 10.1172/JCI107476. [DOI] [PMC free article] [PubMed] [Google Scholar]
- [58].Smith RW., Jr. Dietary and hormonal factors in bone loss. Federation Proceedings. 1967;26:1737–1746. [PubMed] [Google Scholar]
- [59].Smith RW., Jr. FRAME B. Concurrent axial and appendicular osteoporosis: its relation to calcium consumption. New England journal of medicine. 1965;273:73. doi: 10.1056/NEJM196507082730203. [DOI] [PubMed] [Google Scholar]
- [60].Specker B, Binkley T, Fahrenwald N. Rural versus nonrural differences in BMC, volumetric BMD, and bone size: a population-based cross-sectional study. Bone. 2004;35:1389–1398. doi: 10.1016/j.bone.2004.09.005. [DOI] [PubMed] [Google Scholar]
- [61].Towne B, Guo S, Roche A, Siervogel R. Genetic analysis of patterns of growth in infant recumbent length. Hum Biol. 1993;65:977–89. [PubMed] [Google Scholar]
- [62].Volkman SK, Galecki AT, Burke DT, Paczas MR, Moalli MR, Miller RA, Goldstein SA. Quantitative trait loci for femoral size and shape in a genetically heterogeneous mouse population. J Bone Miner Res. 2003;18:1497–1505. doi: 10.1359/jbmr.2003.18.8.1497. [DOI] [PubMed] [Google Scholar]
- [63].Wilson R. Concordance in physical growth for monozygotic and dizygotic twins. Ann Hum Biol. 1976;3:1–10. doi: 10.1080/03014467600001091. [DOI] [PubMed] [Google Scholar]
- [64].Wynne F, Drummond FJ, Daly M, Brown M, Shanahan F, Molloy MG, Quane KA. Suggestive linkage of 2p22-25 and 11q12-13 with low bone mineral density at the lumbar spine in the irish population. Calcif Tissue Int. 2003;72:651–658. doi: 10.1007/s00223-002-2086-2. [DOI] [PubMed] [Google Scholar]
- [65].Zhao G, Monier-Faugere MC, Langub MC, Geng Z, Nakayama T, Pike JW, Chernausek SD, Rosen CJ, Donahue LR, Malluche HH, Fagin JA, Clemens TL. Targeted overexpression of insulin-like growth factor I to osteoblasts of transgenic mice: increased trabecular bone volume without increased osteoblast proliferation. Endocrinology. 2000;141:2674–2682. doi: 10.1210/endo.141.7.7585. [DOI] [PubMed] [Google Scholar]
- [66].Zhao X, Zhang Z, Song Y, Zhang X, Zhang Y, Hu Y, Fromm SH, Chen Y. Transgenically ectopic expression of Bmp4 to the Msx1 mutant dental mesenchyme restores downstream gene expression but represses Shh and Bmp2 in the enamel knot of wild type tooth germ. Mech Dev. 2000;99:29–38. doi: 10.1016/s0925-4773(00)00467-6. [DOI] [PubMed] [Google Scholar]