Abstract
Magnification around the most important point of a movie scene (center of interest - COI) might aid people with visual impairments that cause resolution loss. This will be effective only if most people look at the same place when watching a movie. We recorded the eye movements of 20 normally-sighted subjects as each watched 6 movie clips, totaling 37.5 minutes. More than half of the time the distribution of subject gaze points fell within an area statistic that was less than 12% of the movie scene. Male and older subjects were more likely to look in the same place than female and younger subjects, respectively. We conclude that the between-subject agreement is sufficient to make the approach practical.
Keywords: Eye Movements, Magnification, Scanpath, Video, Visual Aids, Low Vision, Visual Impairment, Television
I. INTRODUCTION
People who, due to eye diseases, suffer loss of visual resolution (low vision) could benefit from modified information displays. The most commonly used modification is magnification. While magnification is effective in improving resolution it inherently restricts the field of view. Thus, magnification may impede the acquisition of information attained in normal vision by the use of scanning eye movements. This limitation may be addressed by dynamic control of the displayed information. Dynamic control of large text presentation is helpful for people with low vision [1–4]. We propose a similar approach to improve access to movies and television programs.
Magnifying moving images using electronic zoom [5] would enable users to select and vary the desired level of magnification from time to time. However, only part of the magnified scene can be presented on the screen. Consequently, large parts of the scene become invisible. To be useful the magnified image should be centered on the screen around the center of interest (COI) – an area in the scene that is most relevant for the viewer. Manual zoom-and-roam devices are available in commercial television systems (e.g. DVD players). However, the rapid changing of scenes in most movies may not allow for effective manual control of the position of the magnified section of the image or even of the desired magnification. We proposed pre-selecting the COI in the scene and providing that position with each frame for automatic centering [6, 7]. This selection should maintain the most relevant details in view at any magnification level set manually by the user, or alternately at a level deemed appropriate by some other automated method.
Together with DigiVision (San Diego, CA), we have developed a computer controlled zoom-and-roam device for playback of movies on a television monitor. The computer plays a DVD and simultaneously reads the COI. These coordinates are sent to the zoom and roam device so that the magnified image is centered on the COI coordinates. We proposed using eye movement recordings from normally-sighted observers watching the movie to determine the desired COI. Although other methods of determining the COI can be envisioned, eye movement recording is automatic and objective.
Choosing the COI using eye movements is akin to finding the scanpath for a movie sequence. Much work has been done regarding the scanpath of still images [8, 9] but little is known about viewing moving images. With the exception of a few studies [10–12] most development that depends on knowing where the gaze is directed (e.g. compression schemes [13] and transmission of images for limited screen space [14]) assume that most people look at the same place all the time while watching movies. To our knowledge this assumption has not been verified experimentally. Here we quantify the proportion of the time a group of people look at the same place while watching a movie, and begin to examine the effects of age and gender on this behavior.
Film editors have used assumed knowledge of viewer’s eye movements, and even blinks, to assemble movies [15]. Stelmach et al. [10] recorded 24 subjects viewing 15 forty-five second clips to determine if viewing behavior can be incorporated into video coding schemes. They found that there was substantial agreement among subjects in terms of where they looked. In a follow-up experiment related to gaze-contingent processing techniques [11], recorded eye movements of 8 subjects were used to create a “predicted gaze position”. Tosi et al. [12] recorded the eye movements of 10 subjects watching a variety of clips totaling about one hour and reported that, qualitatively, individual differences in scanpaths were relatively small. Theoretical saliency models [16, 17] predict where people will look based on spatial and temporal properties of the scene and thus, make no assumptions regarding individual differences in predictions of regions of interest. Top-down models [18–20] that predict eye movements based on scene context, seem to provide a more obvious source for individual differences. We hope to compare our data with predictions from both these types of models, in collaboration with colleagues developing such models.
Here we address three specific questions relevant to our proposed low-vision aid for viewing television. (1) To what extent do people look at the same place when watching a movie? (2) Does that vary with age and gender? (3) Does the position of the COI differ from the center of the screen? Answers to these questions will guide us in the development of dynamic controlled magnification.
II. METHODS
Six movie clips were selected to span a broad range of scene activity, from stationary newscasters to athletes in motion, and to appeal to both younger and older audiences (Table 1). The video clips from DVDs were presented in a 16×9 movie format (the “movie scene area”) on a 27-inch diagonal viewable area NTSC (4×3) monitor as interlaced video at 30 frames per second (60 fields per second).
Table 1.
The lengths of the six movie clips and the categories they were selected to represent.
| Title | Time (min:sec) | Category |
|---|---|---|
| Big (1988) (Big) | 6:29 | Comedy |
| Any Given Sunday (1999) (Sunday) | 4:12 | Sports |
| Network (1976) (Network) | 4:02 | News |
| Blue Planet (2001) (Planet) | 8:14 | Documentary |
| Shakespeare in Love (1998) (Shakes) | 7:06 | Drama |
| Quiz Show (1994) (Quiz) | 6:40 | Game Show |
| Total per subject | 37:29 |
26 normally-sighted subjects were seated 46 inches from the movie scene which spanned a 26.3 deg.× 14.8 deg visual angle. Subjects viewed movie clips binocularly while eye movements were recorded with an ISCAN model RK726PCI eye tracking system. The ISCAN had a nominal accuracy of 0.3 deg over a ±20 deg range and a sampling rate of 60Hz. Thus we could acquire two eye samples per video frame. The ISCAN compensated for modest head movements, permitting gaze monitoring without head restraint, thus allowing a comfortable and natural viewing situation. Before each subject viewed the videos, the ISCAN was calibrated to an area larger than the viewable area of the monitor (calibration area was 30.1 deg × 22.7 deg), using its 5-point calibration scheme. This was done to minimize loss of tracking and to ensure that we obtained valid, calibrated data near the edge of the screen. To further control the quality of the eye tracking [21, 22], we performed and analyzed additional 5-point, pre-clip calibrations (independent of the ISCAN) before each movie clip was viewed. If we could not obtain satisfactory data yield for the pre-clip calibration we repeated the ISCAN calibration until satisfactory pre-clip calibration was achieved. A post-clip calibration was also recorded and the final analysis program averaged the pre- and post-clip calibration data in implementing the calibration parameters.
The ISCAN reports zero data during blinks and during loss of tracking. During the recording phase, immediate feedback was available regarding the amount of non-zero data acquired from each clip. If fewer than 80% were valid for any clip, the subject’s data were excluded, and recording stopped. We did not repeat movie clips, as we preferred to record the subject’s eye movements during their first viewing of a clip. People may view a movie clip differently on subsequent occasions, as occurs in scanpath studies when instructions are altered for viewing static images [8]. Inadequate eye sample yield happened with only one subject. Of the remaining 25 subjects, the 5 subjects with the highest eye sample yields in each of the 4 gender and age groups were selected. The 20 subjects were grouped as: Younger Female 18–29y, Younger Male 16–36y; and Older Female 51–62y, Older Male 42–66y. Eye sample data yields from these groups are shown in Table 2.
Table 2.
Percent yield of acceptable eye sample data (number of non-zero out of total recorded)obtained from each movie clip for the four groups (OM – older males, YM – younger males, OF - older females, YF – younger females). The yield did not vary significantly between clips. Yield was greater for male subjects (F1,16=7.8, p=0.01) and slightly greater for older subjects (F1,16=3.2, p=0.09).
| OM | YM | OF | YF | |
|---|---|---|---|---|
| Big | 97 | 95 | 95 | 93 |
| Sunday | 97 | 95 | 93 | 93 |
| Network | 96 | 96 | 93 | 93 |
| Blue | 98 | 94 | 95 | 93 |
| Shakes | 96 | 95 | 94 | 92 |
| Quiz | 96 | 94 | 94 | 91 |
III. ANALYSIS
A. Preprocessing of individual records
The individual subjects’ eye movement recordings were processed to apply the calibration to the raw eye sample data and remove recording artifacts caused by blinks and other failures. Recording could fail if the head moved too quickly to be tracked by the system or when specular reflections, such as from the tear film menisci, were erroneously detected by the ISCAN as the corneal reflection. Blinks and loss of tracking were filtered from the file by removal of records containing zero value data or frames where the pupil diameter was out of a pre-determined range.
Video presentation was controlled with a Visual Basic program that used the Microsoft DirectX 8.1 DVD interface, and data were collected through RS-232 interface at 19600 baud rate. The DVD interface only interrupted the processor every 0.4 to 1.0 second with a timing (frame number) information request. Frame numbers between such interrupts were calculated from the elapsed time, assuming a 30 frame per second rate. This procedure resulted, on occasion, in non-monotonic or duplicate frame numbers. Non-monotonic frames were discarded and duplicates were re-assigned in the following manner. Because ISCAN data were recorded asynchronously with the video, each assigned frame could be associated with one, two or three eye samples. We designated these multiple eye samples per frame as “subframes” (note – these subframes are not video fields). When there were more than two subframes, we re-assigned eye samples to adjacent video frames that had less than two subframes associated with them. Subframes that could not be re-assigned were discarded. For the 20 subjects watching 37m27s of video, recording eye data at 60 Hz, there were potentially 2.7×10⁶ eye samples. Blinks and loss of tracking during the recording phase reduced this to 2.35×10⁶ (94.5%). Of these, 3.6×10⁴ eye samples (1.5%) could not be re-assigned and were discarded.
B. Merging of eye recordings of multiple subjects’ records to find extent of overlap
The 120 eye movement recording files (20 subjects × 6 clips) were processed to count how many of those subjects had valid eye sample data for each subframe (Fig. 1). For 1.25×10⁵ of the potential 1.35×10⁵ subframes (93%), at least 15 subjects had valid eye samples.
Fig. 1.
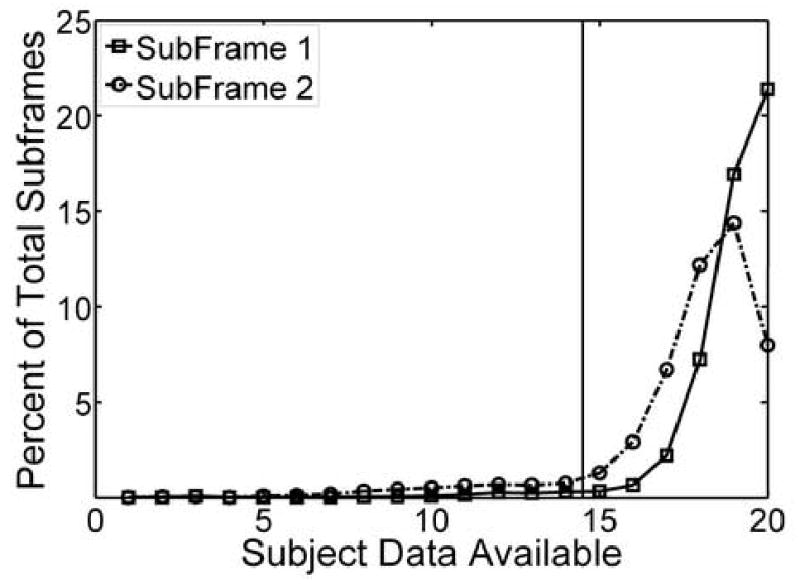
The percentage of the total number of subframes for which the number of subjects had valid eye samples. For 1.25×10⁵ of the potential 1.35×10⁵ subframes (93%), 15 or more subjects contributed valid data (to the right of the vertical line).
For each subframe, the calibrated (x, y) coordinates of subjects’ eye samples, the gaze points, were distributed over the calibration area. Various methods have been applied by other investigators to compute the coincidence between the gaze points of multiple subjects [10, 23–27]. To quantify the spatial coincidence of the gaze points of all the subjects with valid eye samples, we calculated the area of the best-fit bivariate contour ellipse (BVCEA)[28, 29], BVCEA has been used in the past to quantify fixation eye movement stability [2, 29]
| (1) |
where σH is the standard deviation of the point location over the horizontal meridian, σV is the standard deviation of the point locations over the vertical meridian, and ρ is the correlation coefficient of the horizontal and vertical values. The k parameter of the BVCEA determines the enclosure of the ellipse. We set k=1, for which 63% of the points would have been enclosed by the ellipse. The calculation of the BVCEA does not require that an ellipse be fitted to the data (gaze points).
Before calculation of the BVCEA, gaze-point outliers were removed from each subframe’s data. To determine if a particular gaze point was an outlier, the x and y distributions of the gaze points in a subframe were considered separately. If a gaze point had an x or a y value that fell outside the 99.5% probability range (t distribution), the point was defined as an outlier. As an example of outlier removal, Figure 2 shows outlier removal in a single subframe of data. Based on these two 99.5% confidence intervals, outliers were removed from 22.5% of subframes, and for those subframes the BVCEA was reduced by a median of 48% (inter-quartile range 40 to 60%) and the location of the COI (the mean x and y coordinates of the gaze points of the group) changed by a median of 2.4 deg. (inter-quartile range 1.2 to 4.1 deg.). As we used a statistical definition of outliers (two independently-applied 99.5% confidence intervals), if all eye samples were drawn only from a normal distribution we expected to exclude about 1% of the eye samples. The number of outliers removed, 1.3%, was higher than that prediction (z = 40, p < 0.0001), suggesting that some of the eye samples that were removed were true outliers, like that illustrated in Fig. 2.
Fig. 2.
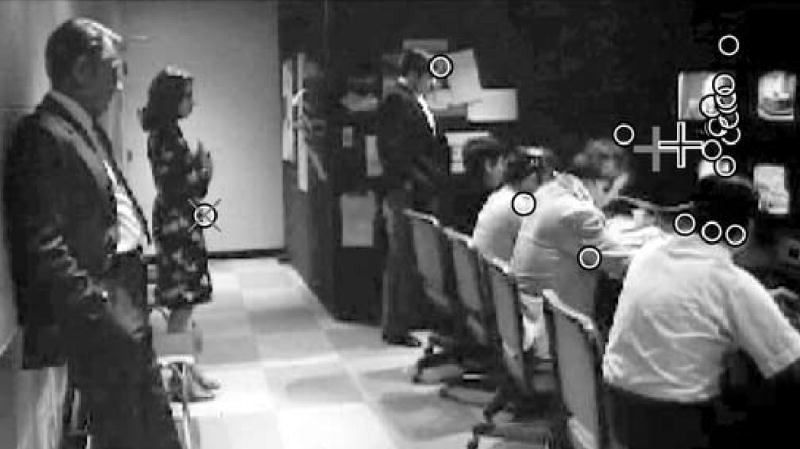
The gaze points (calibrated eye movement data) of the 19 (out of 20) subjects with valid eye samples for a representative subframe (number 1700) of the movie-clip “Network” are shown as black and white circles. The positions were superimposed on a monochrome rendering of this video frame that was modified to improve visibility of features of the scene. Removal of the outlier (circle with the grey ×) reduced the BVCEA (measure of the spread of the gaze points) from 31.1 deg.2 (degrees square) to 19.5 deg.2 (37%). The data are plotted on the 26.3 deg. × 14.8 deg. movie scene (rectangle). The grey and white crosses mark the prior and subsequent COIs (mean of the gaze points), which moved by only 1.0 deg. on removal of the outlier. Note that this COI would be outside the screen for most magnification levels if magnification were to be centered at the center of the movie scene.
For subframes containing at least 15 eye samples, the cumulative distributions of the BVCEA found for each movie clip (Fig. 3 and 4) were fit with a logistic function,
Fig. 3.
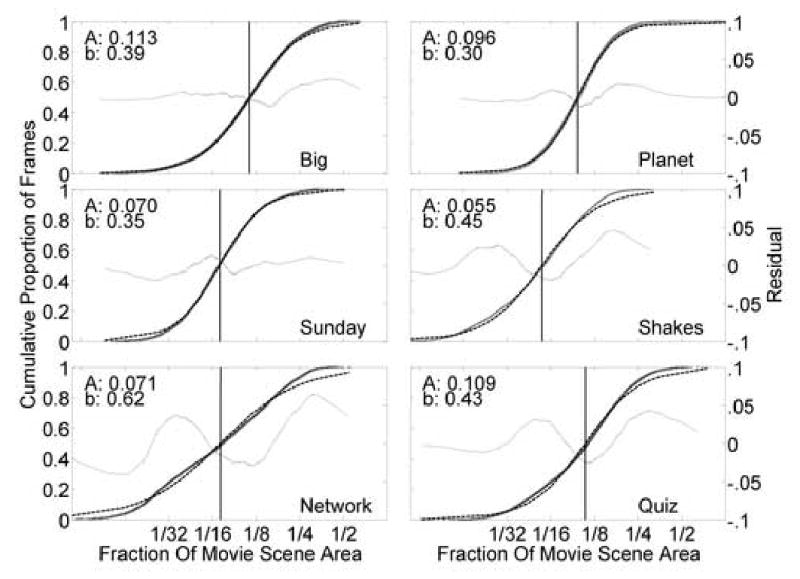
For each movie-clip subframe, after removing outliers (see Fig. 2), the spread of the gaze points was estimated using the BVCEA, reported here as a proportion of the movie scene area. Only those subframes where 15 or more subjects had valid eye samples were used (see Fig. 1). The cumulative curves (heavy lines) show the actual proportion of the total subframes for which the BVCEA was less than a given fraction of movie screen area. Loge transforms of the distributions were fitted to a logistic function (dashed lines) that were then used to calculate the screen fraction for which half of the samples had a smaller BVCEA (A: vertical line and the value indicated by the inset). The residuals of the fits are shown (thin lines - see right y-axis for scale).
Fig. 4.
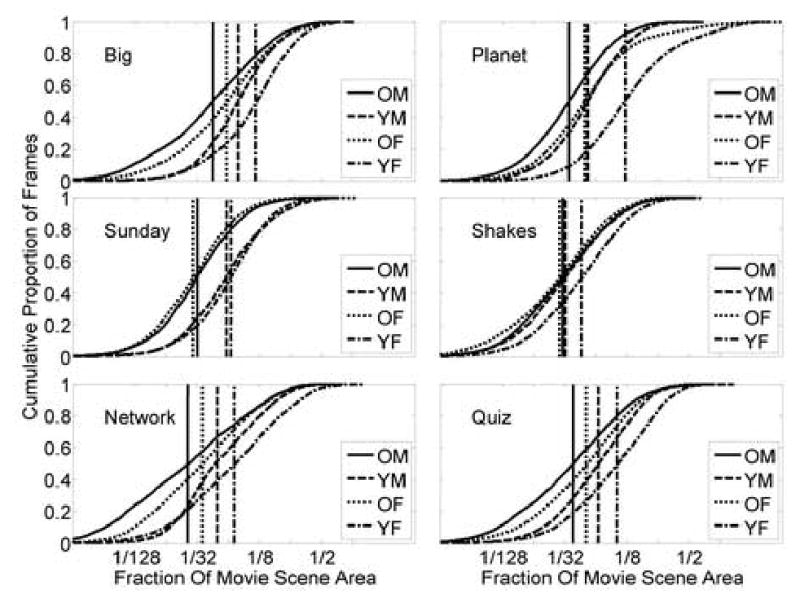
Similar to Fig.3, the cumulative distributions of the BVCEA and positions of A are shown for each movie clip and for each age-gender group (for subframes where at least 4 out 5 subjects had useable data). Older and male groups had smaller spreads of their gaze points (smaller BVCEA) than younger and female groups, respectively. The fits used to derive the positions of the vertical lines are not shown.
| (2) |
where x is loge(BVCEA / movie scene area), a is the mid-point of the function and b is the slope parameter. To quantify effects of age and gender, the BVCEA was calculated for every subframe for which there were gaze points for at least 4 subjects from each group of 5 subjects and fitted with a logistic function. In subsequent data analyses we used these fit values of a and b. Data were evaluated using analysis of variance, with movie clip treated as a within-subject factor. Later, for ease of interpretation, instead of reporting values of a, we report values of A, defined as ea. A is a proportion of the movie scene area.
IV. RESULTS
People do tend to look in the same place (here represented by a small BVCEA). As shown in Fig. 3, for all six movie clips, when there were 15 or more gaze points available, more than half of the time the distribution of subject gaze points fell within an area statistic (BVCEA, k=1) that was less than 12% of the movie scene. This represents an area equivalent to a circle with a diameter of about 8 deg. To examine the effects of age and gender on whether people look in the same place we performed analyses of variance on a and b of the fits to the BVCEA data shown in Fig. 4. As shown in Fig. 5, male and older subjects were more likely to look in the same direction (smaller a) than female (F1,20=6.1, p=0.02) and younger (F1,20=21, p<0.001) subjects, respectively. Older subjects were slightly more variable (slower rise – larger b) than younger subjects (F1,20=3.9, p=0.06). Between the movie clips, there were significant differences in b (F5,18=5.4, p=0.003) but not of a, indicating that the area within which most subjects looked was more variable for some movies. The area was more variable when watching Network than Planet (p=0.01), Big (p=0.016) and Sunday (p=0.002). It appears that, as might be expected, movies with high level of motion more tightly controlled the subject gaze locations than movies with relatively static scenes.
Fig. 5.
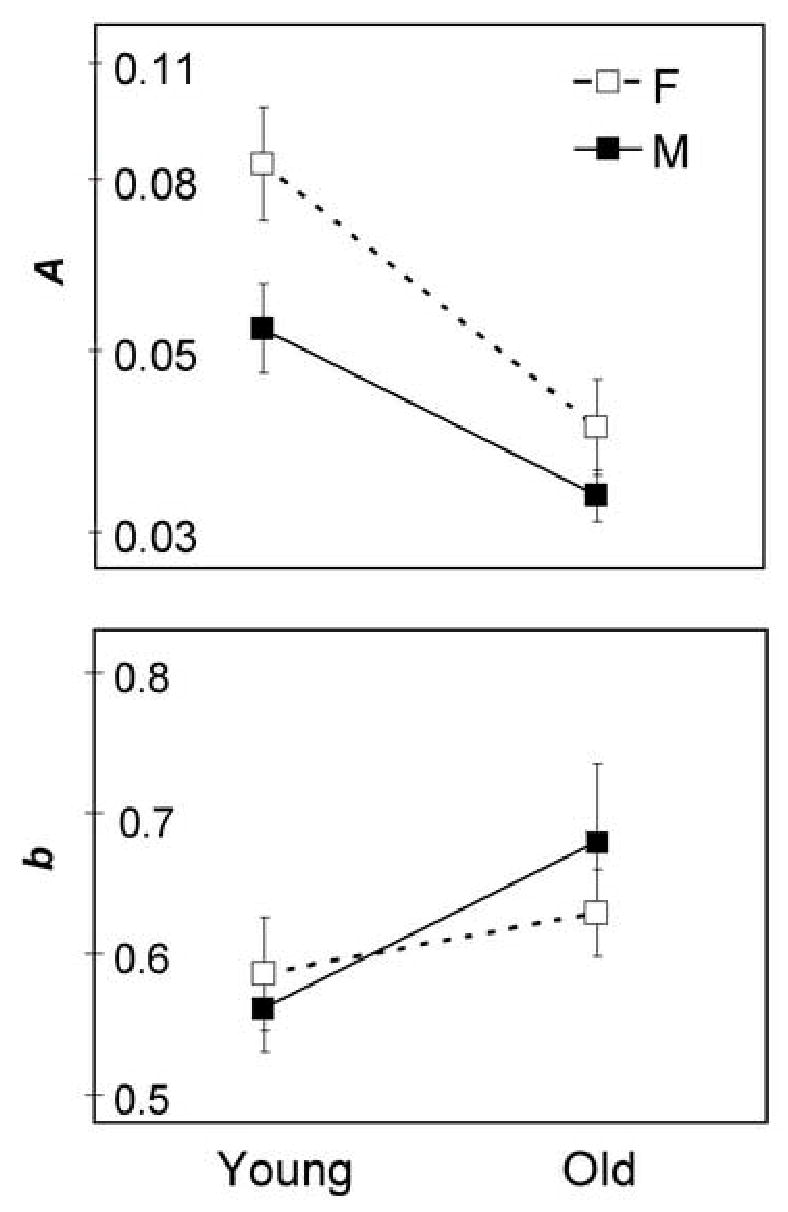
The effects of age and gender on the parameters A and b of the fits of the cumulative distributions to the logistic function. There were statistically significant effects of gender and age on the likelihood that the subjects in a group looked in the same direction (smaller A for older and male subjects); and there was a small, non-significant effect of age on the variability of direction of gaze (smaller b for younger subjects). Note that the ordinate axis for the upper panel (A) is logarithmic, since the fit and subsequent statistics were done to a, (loge A). Error bars indicate SEM.
For those subframes where there were gaze-point data for 15 or more of the 20 subjects, the position of the COI was calculated. The distributions of those COIs (0.94 deg horizontal by 0.71 deg vertical bins over the movie scene area) are shown in Fig. 6 for each of the six movie clips. In general, the peaks of the COI distributions were approximately in the center of the movie scene, though they varied by as much as 1/4 of the width or height from center.
Fig. 6.
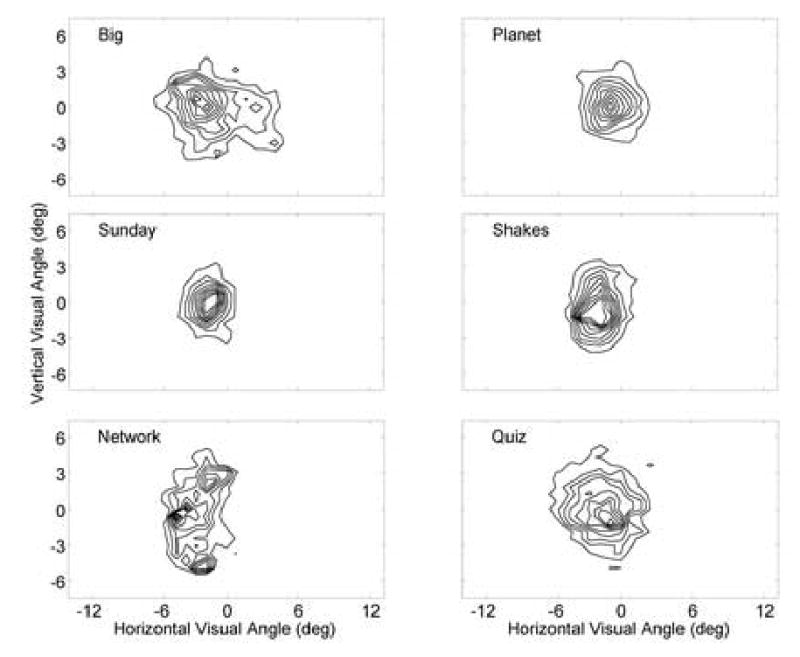
COI distributions computed for all movie clips for all subjects (for subframes with eye samples available for at least 15 subjects) are shown as a topographic map (derived from 28 by 21 bins). The borders represent the movie scene area. Data were normalized so that the maximum was 1.0 and levels were drawn at 0.1 intervals. Although generally, the distributions peaked near the center of the screen, the spread indicates that a large proportion of the time, subjects did not look at the center of the movie scene.
The COI distributions were tested on a pair-wise basis using the one-factor independence test for similarities of distributions [30]. The distributions shown in Fig. 6 (clip by clip comparisons), as well as distributions from the different gender-age groups were tested. All distributions were statistically different from each other (χ2 ≥ 1,271, p < 0.0001). The practical significance of these statistically significant differences is not clear, as our sample sizes were very large.
V. DISCUSSION
Measuring and providing the coordinates of the COI along with each frame may allow better use of electronic magnification as a low-vision aid for watching movies (and other television programs). The eye movement method presented here is a natural and efficient way of determining these COIs. We envisage that, just as video programs are now being provided with “closed captions for the hearing impaired” and audio description formats [31], movies can be provided with these COIs encoded.
We have demonstrated that it is possible to determine the COI in a movie scene by recording the eye movements of normally-sighted subjects while they watched a movie. Over half of the time, the distribution of gaze points of most subjects fell within a BVCEA (k=1) that was less than about 12% of the movie scene (Fig. 3) or for the smaller age-gender sub-groups to about 5% of the movie scene (Fig. 4). This is crucial for our application. We rarely expect to need to magnify the image by greater than a factor of 4 (showing 1/16th (6.25%) of the movie scene). Higher magnification might cause too much loss of context and may appear blurred. The distribution of COIs (Fig. 6) illustrates that magnification centered on the COI would provide more information than magnification simply centered on the center of the movie scene. If magnification were arbitrarily applied around the center of the movie scene, important information may be out of view in certain scenes in which the COI was not near the center of the screen. For example, if a COI was at the middle of a face and that COI fell close to the edge of the screen once magnified, half of the face would not be visible. To assess the impact of any particular level of magnification (e.g. 4×), one approach is to consider how often the COI would fall outside of the screen for magnification that is slightly higher (e.g. 5×) than the magnification of interest. Thus, for a magnification of interest of 4×, we found the number of the COIs that were outside the screen for a magnification of 5× (for which only 1/25th, or 4% of the screen area would be visible). 73% of COIs were outside the central 4% of the movie scene area (5× magnification area). Similarly, for a magnification of interest of 3×, 50% were outside the central 6.25% of the movie scene area (4× magnification area). Thus magnifications of 3× and 4× around the center would be unsatisfactory and would severely limit the utility of that simple approach. In our experience, 4× is the maximum practical magnification.
Also, we found that there are some significant differences in the observation behaviors between gender and age groups. The current analysis only found that the older and male subjects’ COIs were more tightly grouped than the younger and female subjects, respectively (Fig. 4 and 5). Most people with low vision are over 65 years of age (and many are over 75), so our “older” subjects may not be representative of most (older) people with low vision who might use magnification when watching TV. We still need to determine if the COI locations varied with gender and age. The conditions or scenes that resulted in a large BVCEA (spread of gaze points) might be just as interesting as the condition of a small BVCEA. The BVCEA could be used to determine an advised magnification. For example, a frame with a small BVCEA can be effectively magnified (without losing important information) more than a frame with a large BVCEA.
We need to emphasize that we are not considering using the raw data (analyzed here) directly to control the video presentation. We are planning to heavily process it and adjust for various effects For example, due to latencies in the saccadic system, after a scene cut, the eye will remain fixated in the pre-cut COI for 200–500 milliseconds until a saccade is made to the new COI. If these locations are different, this delay would introduce a brief pulse of irrelevant material on the screen. In pilot trials of controlling the zoom and roam device using the raw data, we observed extremely jittery presentations. Most of the apparent jitter was probably due to small frame-to-frame variations in the computed position of the COI. We were able to eliminate most of that jitter by keeping the center of magnification at the forward and backward average of the COI. The COI shifted only when this average changed by 1/8th the screen width. This heuristic algorithm resulted in a much smoother video, but other processing algorithms will be investigated in the future.
The area within which most subjects looked was more variable for some movies. This is most likely due to the content of the watched movie (fast motion, multiple relevant objects, etc.). Excerpts from clips illustrating different levels of movement and the varied responses can be found on our website at http://www.eri.harvard.edu/faculty/peli/lab/videos/videos.htm.
In addition to our interest in the application of this technique to our movie (or television) magnification device, we see this work as a beginning of an interesting examination of the nature and characteristics of the motion scanpath of dynamic environments — the movie environment being one that is simpler to study — perhaps followed by the dynamic real world of a mobile observer.
SUMMARY
Magnification around the most important point of the scene on a display (center of interest - COI) might be an effective aid for people with visual impairments that cause resolution loss (low vision). This requires that a COI exist for most video frames. Operationally, we defined the COI by recording the eye movements of normally-sighted subjects as they watched movies. We address three specific questions relevant to our proposed low-vision aid for viewing television. (1) To what extent do people look at the same place when watching a movie? (2) Does that vary with age and gender? (3) Does the position of the COI differ from the center of the screen?
We analyzed the eye movements (at 60Hz) of 20 normally-sighted subjects watching 37.5 minutes of 6 movie clips of various types (sports, comedy, documentary, news, game show and drama). The subjects were divided into four age-gender groups (younger and older; males and females). The 120 subject data files were pre-processed to apply calibrations and to remove recording artifacts. The coincidence between the gaze points of multiple subjects was determined by calculating the area of the best-fit bivariate contour ellipse expressed as percentage of the movie screen area. The position of the COI was determined as the mean x and y coordinates of each group.
The 20 subjects did tend to look in the same direction. Over half of the time, the distribution of gaze points of most subjects was contained within an area that was less than about 12% of the movie scene or for smaller age-gender sub-groups of about 5% of the movie scene area. This is crucial for our application since we rarely expect to need to magnify the image by greater than a factor of 4 (showing –about 6% of the movie scene). Male and older subjects were more likely to look in the same direction than female and younger subjects, respectively. This inter-group variability in gaze points also varied between the movie clips. The peaks of the COI spatial distributions were approximately in the center of the movie scene, though they varied by as much as 1/4 the width or height from the center, and the distributions varied between movie clips.
Providing the coordinates of the COI along with each frame may allow magnification to be used more successfully as a low-vision aid for watching movies (and other television programs). The eye movement method presented here is a natural and efficient way of determining these COIs. We envisage that, just as programs are now being provided in “closed captions” and described video formats, movies can be provided with these COIs encoded.
Acknowledgments
Supported in part by NIH Grants EY05957 and EY12890.
Assistance was provided by Miguel A García-Pérez, Shabtai Lerner and Gang Luo.
Footnotes
Author Biographies
Robert B. Goldstein obtained his BS from Brooklyn College of the City University of New York in 1969 and his Ph.D. in Nuclear Physics from MIT in 1975. Dr. Goldstein is currently employed as a Senior Computer Analyst at Schepens Eye Research Institute and is an Associate in Ophthalmology at Harvard Medical School. His major interest is the application of Computer Science and technology to scientific research. Dr. Goldstein is most interested in the areas of vision research; bioengineering, software development, image processing, clinical trials; software development and database systems.
Russell Woods completed optometry training in 1981 at University of New South Wales, Sydney, and obtained a PhD in vision science at The City University, London in 1992. Currently, Dr Woods is an Investigator at the Schepens Eye Research Institute and an Instructor in Ophthalmology at Harvard Medical School. His interests include the impact of, and rehabilitation of visual impairment, human spatial vision, visual optics and ocular aberrations
Eli Peli received BSEE and MSEE in 1976 and 1978, respectively from Technion-Israel Institute of Technology, Israel, a Doctor of Optometry Degree in 1983 from the New England College of Optometry, Boston, and A Honorary DSc from SUNY in 2006. Dr. Peli is the Moakley Scholar in Aging Eye Research at The Schepens Eye Research Institute, and Professor of Ophthalmology at Harvard Medical School. Since 1983 he has been caring for visually impaired patients as the director of the Vision Rehabilitation Service at the New England Medical Center Hospitals in Boston. Dr. Peli's principal research interests are image processing in relation to visual function and clinical psychophysics in low vision rehabilitation, image understanding and evaluation of display-vision interaction. He also maintains an interest in oculomotor control and binocular vision. He is a Fellow of the American Academy of Optometry, the optical Society of America, and the Society for Information Display.
Supported, in part, by NIH Grants EY05957 and EY12890.
References
- 1.Legge G, Rubin G, Pelli D, Schleske M. Psychophysics of reading II. Low vision. Vision Research. 1985;25:253–66. doi: 10.1016/0042-6989(85)90118-x. [DOI] [PubMed] [Google Scholar]
- 2.Rubin G, Turano K. Reading without saccadic eye movements. Vision Research. 1992;32:895–902. doi: 10.1016/0042-6989(92)90032-e. [DOI] [PubMed] [Google Scholar]
- 3.Fine E, Peli E. Spain: ONCE; 1996. Computer display of dynamic text, in Vision 96: International Conference on Low Vision, Madrid, Spain, vol. Book 1. Madrid; pp. 259–67. [Google Scholar]
- 4.Fine E, Peli E. Benefits of rapid serial visual presentation (RSVP) over scrolled text vary with letter size. Optometry and Vision Science. 1998;75:191–6. doi: 10.1097/00006324-199803000-00024. [DOI] [PubMed] [Google Scholar]
- 5.Kazuo S, Shimizu J. Image scaling at rational ratios for high-resolution LCD monitors. In: Morreale J, editor. Society for Information Display Digest of Technical Papers. Vol. 31. San Jose, CA: Society for Information Display; 2000. pp. 50–53. [Google Scholar]
- 6.Peli E. Vision multiplexing - an engineering approach to vision rehabilitation device development. Optometry and Vision Science. 2001;78:304–315. doi: 10.1097/00006324-200105000-00014. [DOI] [PubMed] [Google Scholar]
- 7.Goldstein RB, Apfelbaum H, Luo G, Peli E. Dynamic magnification of video for people with visual impairment. Vol. 34. Baltimore, MD: Society for Information Display; 2003. 2003 SID International Symposium. Digest of Technical Papers; pp. 1152–1155. [Google Scholar]
- 8.Yarbus AL. New York: Plenum; 1967. Eye Movements and Vision. [Google Scholar]
- 9.Noton D, Stark L. Scanpaths in eye movements during pattern perception. Science. 1971;171:308–311. doi: 10.1126/science.171.3968.308. [DOI] [PubMed] [Google Scholar]
- 10.Stelmach L, Tam WJ, Hearty P. Human Vision, Visual Processing and Digital Display II. Vol. 1453. Bellingham, WA: SPIE; 1991. Static and dynamic spatial resolution in image coding: An investigation of eye movements; pp. 147–152. [Google Scholar]
- 11.Stelmach L, Tam WJ. Processing image sequences based on eye movements. In: Rogowitz BE, Allebach JP, editors. Human Vision, Visual Processing, and Digital Display V; Proceedings of SPIE; Bellingham, WA. SPIE; 1994. pp. 90–98. [Google Scholar]
- 12.Tosi V, Mecacci L, Pasquali E. Scanning eye movements made when viewing film: preliminary observations. International Journal of Neuroscience. 1997;92:47–52. doi: 10.3109/00207459708986388. [DOI] [PubMed] [Google Scholar]
- 13.Geisler WS, Webb HL. NASA; Austin, TX: 1998. A foveated imaging system to reduce transmission bandwidth of video images from remote camera systems. 19990025482; AD-A358811; AFRL-SR-BL-TR-98-0858. [Google Scholar]
- 14.Rauschenbach U, Schumann H. Demand-driven image transmission with levels of detail and regions of interest. Computers and Graphics. 1999;23:857–866. [Google Scholar]
- 15.Dmytryk E. Boston: Focal Press; 1984. On Film Editing. [Google Scholar]
- 16.Itti L, Koch C. Computational modelling of visual attention. Nature Review Neuroscience. 2001;2:194–203. doi: 10.1038/35058500. [DOI] [PubMed] [Google Scholar]
- 17.Reingold EM, Loschky LC. Saliency of peripheral targets in gaze-contingent multiresolutional displays. Behavior Research Methods, Instruments and Computers. 2002;34:491–9. doi: 10.3758/bf03195478. [DOI] [PubMed] [Google Scholar]
- 18.Moores E, Laiti L, Chelazzi L. Associative knowledge controls deployment of visual selective attention. Nat Neurosci. 2003;6:182–189. doi: 10.1038/nn996. [DOI] [PubMed] [Google Scholar]
- 19.Oliva A, Torralba A, Castelhano MS, Henderson JM. Top down control of visual attention in object detection. IEEE Proceedings of the International Conference on Image Processing. 2003;I:253–256. [Google Scholar]
- 20.Neider MB, Zelinsky GJ. Scene context guides eye movements during visual search. Vision Research. 2006;46:614–621. doi: 10.1016/j.visres.2005.08.025. [DOI] [PubMed] [Google Scholar]
- 21.Hornof AJ, Halverson T. Cleaning up systematic error in eye-tracking data by using required fixation locations. Behavior Research Methods, Instruments & Computers. 2002;34:592–604. doi: 10.3758/bf03195487. [DOI] [PubMed] [Google Scholar]
- 22.Stampe DM. Heuristic filtering and reliable calibration methods for video-based pupil-tracking systems. Behavior Research Methods, Instruments & Computers. 1993;25:137–142. [Google Scholar]
- 23.Goldberg J, Schryver J. Eye-gaze-contingent control of the computer interface: Methodology and example for zoom detection. Behavior Research Methods, Instruments & Computers. 1995;27:338–350. [Google Scholar]
- 24.Stark L, Choi Y. Experimental metaphysics: the scanpath as an epistemological mechanism. In: Zangemeister WH, Stiehl HS, Freska C, editors. Visual Attention and Cognition Amsterdam: Elsevier; 1996. pp. 3–69. [Google Scholar]
- 25.Privitera CM, Stark LW. Algorithms for defining visual regions-of-interest: comparison with eye fixations. IEEE Transactions on Pattern Analysis and Machine Intelligence. 2000;22:970–982. [Google Scholar]
- 26.Salvucci D, Goldberg J. Eye Tracking Research & Applications Symposium. New York: ACM Press; 2000. Identifying fixations and saccades in eye-tracking protocols; pp. 71–78. [Google Scholar]
- 27.Osberger W, Rohaly AM. Automatic detection of regions of interest in complex video sequences. Proceedings of SPIE Human Vision and Electronic Imaging VI. 2001;4299:361–372. [Google Scholar]
- 28.Crossland MD, Rubin GS. The use of an infrared eyetracker to measure fixation stability. Optometry and Vision Science. 2002;79:735–9. doi: 10.1097/00006324-200211000-00011. [DOI] [PubMed] [Google Scholar]
- 29.Timberlake GT, Sharma MK, Grose SA, Gobert DV, Gauch JM, Maino JH. Retinal location of the preferred retinal locus (PRL) relative to the fovea in scanning laser ophthalmoscope (SLO) images. Optometry and Vision Science. 2005;82:177–185. doi: 10.1097/01.opx.0000156311.49058.c8. [DOI] [PubMed] [Google Scholar]
- 30.Wickens TD. Hillsdale: LEA; 1989. Multiway Contingency Tables Analysis for the Social Sciences. [Google Scholar]
- 31.Peli E, Fine EM, Labianca AT. Evaluating visual information provided by audio description. Journal of Visual Impairment & Blindness. 1996;90:378–385. [Google Scholar]


