

Abstract
Irrigation for rice cultivation increases the production of Anopheles gambiae, the main vector of malaria in Mali. Mosquito abundance is highly variable across villages and seasons. We examined whether rice cultivation patterns mapped using remotely sensed imagery can account for some of this variance. We collected entomologic data and mapped land use around 18 villages in the two cropping seasons during two years. Land use classification accuracy ranged between 70% and 86%. The area of young rice explained 86% of the inter-village variability in An. gambiae abundance in August before the peak in malaria transmission. Estimating rice in a 900-meter buffer area around the villages resulted in the best correlation with mosquito abundance, larger buffer areas were optimum in the October and dry season models. The quantification of the relationship between An. gambiae abundance and rice cultivation could have management applications that merit further study.
INTRODUCTION
The use of remote sensing (RS), geographic information systems (GIS), and spatial statistics/landscape ecology in the study and control of arthropod vectors of disease has increased greatly in recent years.1–7 This has been especially true for anopheline mosquitoes, whose dependence on fresh and brackish water in the early stages of their life cycle makes them particularly amenable to study by RS.
Several studies have used low-resolution satellite imagery to monitor climatic factors associated with malaria transmission.4,8,9 These models have good predictive value in large areas, where mosquito dynamics are mainly driven by rainfall and temperature patterns. We have been exploring RS for observations at much finer scales of tens of meters in irrigated rice fields of Mali. At this scale, water management, rather than climate, is likely to play a predominant role in the population dynamics of anophelines.
Irrigation for rice cultivation increases the production of Anopheles gambiae, the main vector of malaria in Mali. The schedule of rice cultivation varies among the villages and also among rice fields within a village, generating a mosaic of rice fields at different rice growth stages. The numbers of adult An. gambiae mosquitoes are highly variable in rice growing villages in Mali, both spatially and seasonally.10 Since rice fields at early growth stages host the largest numbers of An. gambiae larvae,11 villages surrounded by many fields with young rice would be predicted to have larger An. gambiae populations. In this report, we used a landscape-epidemiologic approach to examine whether rice cultivation patterns mapped using remotely sensed imagery can account for some of the variance in indoor resting densities of anopheline mosquitoes in Malian villages.
We generated land use maps using moderately high resolution images (Landsat 7 ETM+), at two different cropping seasons, and related the land use around 18 villages to adult mosquito abundance within the villages. Because the distance from which mosquitoes were obtained was not known, we extracted land use from a range of distances from the villages and determined which distance resulted in the highest correlation with mosquito abundance.
METHODS
Study area
The study was conducted around the town of Niono in the Northern Sudan region of Mali (14°18′N, 5°59′W), approximately 330 km northeast of Bamako. This region encompasses the largest rice irrigation project in Mali. The Office du Niger in the Niono District of Mali oversees irrigation in the area from a dam on the Niger River. The major zone of the Office du Niger is subdivided into five sub-zones with unique characteristics with respect to land management, yield per hectare, and road and communication infrastructure. This study was conducted in the zones of Niono (eight villages), Molodo (five villages), and N’Débougou (five villages). The distance of the 18 villages studied to their nearest neighbors ranged from 2,043 to 6,518 meters, with a mean distance of 4,117 meters.
In this region, the year can be divided into three seasons: the rainy season (July to October), the cold dry season (November to February), and the hot dry season (March to June). In general, flooding for irrigation begins in June/July and the rice is harvested in October/November. Peak production of anophelines occurs in August/September, when the rice has been transplanted but is not yet dense enough to shade the water.11 In some of the irrigated areas and in some years, a second rice crop is grown, beginning in March and harvested in June. In such areas, there are anophelines and malaria transmission through much of the year, with less marked seasonality.12 Detailed descriptions of the study area have been reported.10,12,13 The relationship between rice cultivation and malaria transmission has been described by Sissoko and others.14
Entomologic data
Eight entomologic surveys were conducted between April 1999 and January 2001, during the middle and end of the rainy season (August and October, respectively), the off-season crop time (April), and the harvesting period (January) (Table 1). Anopheles gambiae s.l. indoor resting density (Nt) was calculated based on pyrethrum spray catch (PSC) collections in 30 randomly chosen houses per village/survey (a different set of 30 houses were sampled in each survey).15 The sample of 30 houses was based on the maximum number that a team could logistically sample in two-day field surveys, allowing them to complete 18 villages per season. Because they were selected randomly, they were expected to represent a wide range of environmental conditions within the village, in terms of distance to rice fields and other potential breeding sources. In a previous study in this area, Dolo and others12 found that 99.6% of all An. gambiae s.l. were An. gambiae s.s., and of those, 98.6% were of the Mopti chromosomal form.
Table 1.
Season and date of collections used to map rice cultivation patterns*
| Survey | Season | Year | Date | Landsat date | Landsat granule ID |
|---|---|---|---|---|---|
| 1 | Dry | 1999 | Apr 20–May 8 | No RS data | |
| 2 | Rainy | 1999 | Aug 3–19 | Oct 18 | E1SC:L70RWRS.002:2000341539 |
| 3 | End rainy | 1999 | Oct 12–29 | Oct 18 | E1SC:L70RWRS.002:2000341539 |
| 4 | Harvest | 2000 | Jan 17–Feb 3 | No RS data | |
| 5 | Dry | 2000 | Apr 19–May 6 | Apr 27 | E1SC:L70RWRS.002:2000958529 |
| 6 | Rainy | 2000 | Aug 4–21 | Sep 18 | E1SC:L70RWRS.002:2001541048 |
| 7 | End rainy | 2000 | Oct 12–27 | Sep 18 | E1SC:L70RWRS.002:2001541048 |
| 8 | Harvest | 2001 | Jan 8–26 | Jan | E1SC:L70RWRS.002:2002182021 |
Landsat ETM+ data at the end of the rainy season (surveys 3 and 7) was used to back-estimate the stage of rice present during the rainy season (surveys 2 and 6). Landsat granule ID for the scenes used are provided for reference (U.S. Geological Service and the National Aeronautics and Space Administration).16
Satellite data
We acquired four Landsat 7 ETM+ scenes from the U.S. Geological Service, Greenbelt, MD) and the National Aeronautics and Space Administration (Washington, DC).16 The dates were close to the adult mosquito collections in April 2000 and January 2001. In August of both years, however, Landsat scenes were covered with clouds, so we back-estimated the rice stage present in August from that present in September 2000 and October 1999 (see detailed methods in Diuk-Wasser and others17). We could not obtain adequate satellite data for April 1999 or January 2000. We georeferenced the September 18, 2000 scene using 80 ground control points collected in the field in October 2000 and August 2001 (road and irrigation channel intersections), achieving a root mean square error of 0.1. We referenced all the files to this base scene using a first-degree polynomial model and a nearest neighbor resampling algorithm.18
To account for differences in solar azimuth, elevation, and time of year between the scenes, we converted all digital numbers to exoatmospheric reflectance values using post-launch gains and offset.19 We extracted subsets of 1,878 × 3,109 pixels and applied a mask to all scenes to exclude the Sahel Desert area outside the irrigation perimeter. To minimize the effects of atmospheric scattering, we performed a dark object subtraction algorithm to all scenes20 and excluded ETM+ band 1 (with most atmospheric bias) from the analyses. Only the September 2000 scene showed a small percent cover of clouds. We excluded from the analysis seven villages from the August 2000 dataset, which were within 2,000 meters of clouds in the September 2000 scene (Coccodi, Nango, Niessoumana, Niono Koroni, Sounkalo Kan, Tenegue and Tigabougou). Also excluded from the August 1999 dataset was one village that was flooded (Tissana).
Land use map
We generated land use maps using a supervised maximum likelihood classification algorithm.18 We mapped four rice parcels in each village in four different directions and at different distances from the village center to use as training and testing pixels for the rice classes. At the times of the satellite acquisitions, we recorded whether each of the four basins in a parcel was being exploited with rice, other crops (garden), or laid fallow (bare soil) and noted the stage of rice if present (early vegetative, late vegetative, reproductive or maturing). Using this ground data, we classified the rice based on when it was planted, early or late in the season. Rice was classified as late if it was still in vegetative stage in September/October and as early if it had already reached the reproductive or maturing stages at this date (see Diuk-Wasser and others17 for details). During the dry season, we recorded only if rice was present or not present, regardless of rice stage, because rice was planted synchronously and was roughly at the same stage in all fields at one particular time.
The bare soil class included fields that lay fallow during the dry season. During the rainy season, however, few fields lay fallow. Thus, we extracted random pixels from bare soil present within the villages, which were spectrally similar to fallow fields. Similarly, the garden class included non-rice crops cultivated in fields during the dry season as well as gardens cultivated year-round near villages in the rainy season. To classify flooded areas, we randomly selected pixels within the central irrigation channel. The output of the classification resulted in flooded pixels both within the channel (that we relabeled as river) and in flooded fields (that we kept as the flooded class). We identified an additional class by photointerpretation along natural streams and around the margins of the irrigation scheme. These pixels had high values for the normalized difference vegetation index in all seasons, which indicated that vegetation was present year-round. We labeled them as perennial vegetation and selected random pixels within these areas to use for training.
To classify the different stages of rice, garden and bare soil classes (for which we had ground data), we used 75% of the pixels available for training and the remaining 25% for testing the accuracy of the resulting land use map. We generated confusion (or contingency) matrices to determine the overall percent accuracy of the classification (number of ground pixels correctly classified/total number of pixels used for testing × 100) and the producer’s accuracy (number of correctly classified pixels in each category the number of training pixels used for that category × 100).18 We also calculated the kappa coefficient,21 which is an indicator of the extent to which the percentage correct values are due to true versus chance agreement.
Statistical methods
We expressed indoor resting density (Nt) in each village as the average of the number of mosquitoes captured in the 30 houses sampled in each survey. We used a GIS procedure known as buffering22 to extract the area of different land uses around the villages. We initially used 1 km as the buffer radius, based on the typical flight range reported for An. gambiae in the region.23–25 We ran hierarchical stepwise multiple linear regression of Nt in each of the surveys against the area of different land uses, including year and zone as covariates. The significance level was 0.1 for removal and 0.05 for addition.
To refine the models, we explored whether the use of different radii to estimate land use area would improve the model fit. To do this, we extracted the area around the villages covered by the land uses selected in the initial regression models using buffers of different radii, from 100 meters to 3,000 meters, in intervals of 100 meters. We then calculated the Spearman rank correlation coefficient26 between Nt and the area of each land use for each buffer size. Finally, we re-ran the regression models using the buffer sizes that resulted in the maximum value of the correlation coefficient and also 100, 200, and 300 meters smaller and larger buffers than the optimum. We used Akaike’s information criterion27 to select the most parsimonious model for the data.
RESULTS
Land use map
Overall classification accuracy ranged between 70% for October 1999 to 86% for April 2000 (Table 2). The percent of the rice class that was correctly classified (producer’s accuracy) was more than 90% for the dry seasons, more than 96% for the rainy season if all rice stages were pooled, and more than 65% for the different stages of rice in the rainy season. Gardens were the class with the lowest classification accuracy, and were sometimes misclassified as either rice or bare soil.
Table 2.
Classification accuracies in percent and number of pixels (in parenthesis) for the land use classes present in the four scenes analyzed*
| Landsat ETM+ scene: October 18, 1999 | Landsat ETM+ scene: September 18, 2000 | ||||||||
|---|---|---|---|---|---|---|---|---|---|
| Overall accuracy = (538/767) = 70.14% | Overall accuracy = (588/691) = 85.09% | ||||||||
| Kappa coefficient = 0.59 | Kappa coefficient = 0.77 | ||||||||
| Late | Early | Garden | Bare soil | Late | Early | Garden | Bare soil | ||
| Late | 74.44 (41) | 18.62 (70) | 4.35 (3) | 0.81 (2) | Late | 89.34 (285) | 7.95 (7) | 0 (0) | 0.81 (2) |
| Early | 23.64 (13) | 65.69 (292) | 5.80 (4) | 4.05 (10) | Early | 7.21 (23) | 87.50 (77) | 10.53 (4) | 2.44 (6) |
| Garden | 1.82 (1) | 2.66 (10) | 84.06 (58) | 20.65 (51) | Garden | 1.88 (6) | 1.14 (1) | 50.00 (19) | 12.6 (31) |
| Bare soil | 0 (0) | 1.06 (4) | 5.80 (4) | 74.49 (194) | Bare soil | 1.57 (5) | 3.41 (3) | 39.47 (15) | 84.15 (207) |
|
| |||||||||
| Landsat ETM+ scene: April 27, 2000 | Landsat ETM+ scene: January 8, 2001 | ||||||||
| Overall accuracy = (227/264) = 85.98% | Overall accuracy = (364/429) = 85.08% | ||||||||
| Kappa coefficient = 0.69 | Kappa coefficient = 0.65 | ||||||||
|
| |||||||||
| Rice | Garden | Bare soil | Rice | Garden | Bare soil | ||||
|
| |||||||||
| Rice | 92.59 (25) | 21.95 (9) | 3.57 (7) | Rice | 91.49 (43) | 29.79 (14) | 5.07 (17) | ||
| Garden | 3.70 (1) | 63.41 (6) | 6.63 (13) | Garden | 6.38 (3) | 61.70 (29) | 7.46 (25) | ||
| Bare soil | 3.70 (1) | 14.63 (41) | 89.8 (176) | Bare soil | 2.13 (1) | 8.51 (4) | 87.46 (293) | ||
75% of ground pixels collected were used for the maximum likelihood classification and 25% were used for testing the accuracy of the classification. Late = rice that was still in vegetative stage in September/October; Early = rice that had already reached the reproductive/maturing stage in September/October. In the cold/dry season (January) none of the rice fields had been harvested.
Anopheles gambiae density and landscape composition around villages
The number of An. gambiae captured by PSC showed statistically significant relationships with land use. The final models, which were selected after optimizing the buffer area, are shown in Table 3. The optimum buffer areas for the variables selected in the regression model are shown in Figure 1. The selected model for August 1999 and 2000 (F(3,22) = 43.55, P < 0.001, R2 = 0.86) (Figure 2) had a buffer radius of 900 meters. Late rice, gardens, and zone were included in the model. In the model developed for the October 1999 and 2000 data (F(2,23) = 8.47, P < 0.01, R2 = 0.42), early rice was negatively associated with An. gambiae abundance, which was likely because all early rice had been harvested by that date. The year of the survey was also a significant predictor in this model and the optimum buffer size was 1500 meters. Significant models were also developed for the dry season, both for April 2000 (F(1,16) = 28.41, P < 0.001, R2 = 0.64) and January 2001 (F(1,16) = 8.83, P < 0.01, R2 = 0.36). Anopheles gambiae numbers were negatively correlated with area of bare soil in April 2000 and positively correlated with rice in January 2001. The optimum buffer sizes were 1,800 meters and 1,000 meters, respectively.
Table 3.
Stepwise linear regression of the mean number of Anopheles gambiae captured per house by PSC versus the surface area of the different land uses within the optimized buffer around the villages centroids*
| Coefficient | Standard error | t | P > t | 95% Confidence interval | |
|---|---|---|---|---|---|
| August | |||||
| Late rice | 0.610 | 0.0070 | 8.70 | 0.000 | 0.047–0.076 |
| Garden | −0.020 | 0.0102 | −2.01 | 0.057 | −0.042–0.001 |
| Zone | −72.020 | 22.2477 | −3.24 | 0.004 | −118.160–−25.882 |
| October | |||||
| Early rice | −0.001 | 0.0002 | −3.76 | 0.001 | −0.002–−0.000 |
| Year | −3.910 | 0.9715 | −4.02 | 0.001 | −5.920–−1.900 |
| April 2000 | |||||
| Bare | −0.001 | 0.0003 | −5.33 | 0.000 | −0.002–−0.001 |
| January 2001 | |||||
| Rice | 0.002 | 0.0008 | 2.97 | 0.009 | 0.001–0.004 |
Year and zone were included as cofactors. PSC = pyrethrum spray catch.
Figure 1.
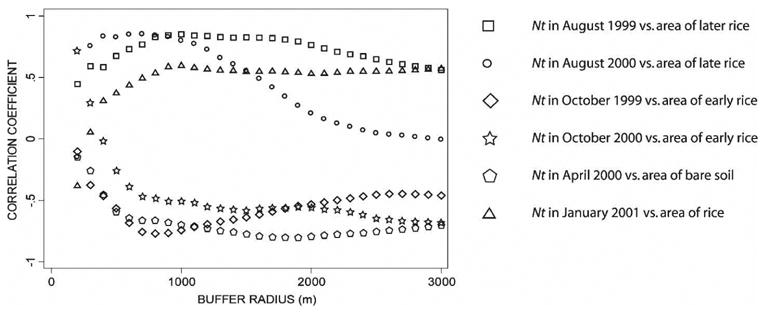
Pearson correlation coefficients between the mean indoor resting density of Anopheles gambiae per village (Nt) and the area of land uses significant in the selected regression models (see text) calculated using different-sized buffers. m = meters.
Figure 2.
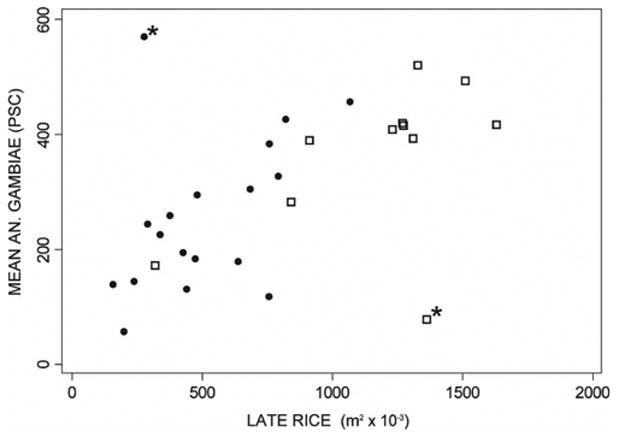
Mean number of Anopheles gambiae collected by pyrethrum spray catch (PSC) per village during the August 1999 (circles) and 2000 (squares) versus area of late rice in a 900-meter buffer area around the centroid of the village. The two villages marked with an asterisk were considered outliers and excluded from the regression analysis. Also excluded from the graph and analyses were the village of Tissana in August 1999 because the sample rice fields around it were flooded, and seven villages from August 2000, which were obstructed by clouds in the satellite images (see text).
DISCUSSION
Land use around study villages explained 86% of the inter-village variability in An. gambiae abundance in August, before the peak in human malaria transmission in September.14 Because mosquito abundance is linked to malaria transmission in this region,10 knowledge of planned or actual cultivation practices around villages is expected to inform preventive or treatment measures in high-risk villages. A model with 64% explanatory power for anopheline abundance was also developed for the dry transmission season, when rice cultivation only occurs in some of the villages/parcels.
The area planted with late rice was the strongest predictor in the model of August mosquito abundance. Rice planted late was at an early growth stage in August and would therefore result in large numbers of An. gambiae larvae.11,17 During the dry season, the area of rice was positively correlated with mosquito abundance in January 2001, and the area of bare soil was inversely related to mosquito abundance in April 2000, which implied that any irrigated area would be associated with higher mosquito abundance during the dry season. Agricultural practices are then clearly linked to the numbers of An. gambiae found in nearby villages.
Cultivation patterns would also affect malaria transmission, although opposite relationships are expected during the rainy and dry seasons. In a previous report,10 we found that the relationship between malaria transmission and mosquito abundance followed a quadratic relationship, with transmission increasing with increasing mosquito abundance when mosquito numbers where low and decreasing with abundance at very high mosquito numbers. During the rainy season, when the maximum numbers of mosquitoes are produced, a large number of fields with young rice could potentially increase mosquito densities to such levels that would result in a relative reduction in vectorial capacity. Conversely, during the dry season, when mosquito numbers are at the lower end of the quadratic curve, a large number of cultivated fields would lead to an increase in transmission.
The use of RS technology allowed us to discriminate among the land uses relevant to vector breeding by extrapolating from spectral signatures of land uses verified during ground surveys. Previous work exists on mapping the patterns of rice cultivation (reviewed by Van Niel and McVicar28) and on the effects of landcover on anopheline production.11,17,29–38 This is the first study to directly address how closely adult anopheline abundance traced cultivation patterns in an irrigated scheme in Africa. Landscape maps derived from satellite imagery were, however, affected by limitations in temporal availability. Only two rice classes could be discriminated. This was likely due to the use of scenes acquired later in the rice growth cycle, when spectral separability is usually lower.29–31
In studies involving a spatial component, it is essential to determine the most appropriate spatial scale for the biologic process in question. By examining several buffer sizes, we were able to determine the most appropriate scale for our study area in the different seasons (Figure 2). Correlation between mosquito abundance and buffer area peaked at 900 meters in August. Smaller buffer areas may not include rice fields used by the mosquitoes resting in the villages, and larger buffers could include breeding sites of mosquitoes that seek hosts in neighboring villages, therefore reducing the correlation. Larger buffer sizes in October and April indicate that mosquitoes may be dispersing longer distances during the dry season, when rice fields are patchier and other irrigated crops may also be used as breeding sites. Our results are consistent with previous studies that estimated dispersal distances of approximately 1 km for An. gambiae.39–41 Other studies aimed to determine the relevant land uses for anopheline breeding have used different areas (1 km32,33 and 2 km36,42). Our methodology allows for a specific determination of the buffer size appropriate for each system and season.
Previous studies have examined whether irrigation per se increased malaria transmission.43–45 However, given that an increase in irrigated land seems inevitable, the focus may need to shift to the design and management of irrigation schemes to minimize malaria risk and to planning interventions against potential malaria outbreaks. Given the nonlinear link proposed between vector abundance and transmission, it seems possible that malaria transmission could be reduced by synchronization of rice cultivation, so that either a very small or a very large proportion of the rice paddies are at the highly productive early stage at the same time and place. During the rainy season, more synchronous cultivation may result in reduced malaria transmission due to high mosquito numbers at the beginning of the season, when malaria preventive measures could be applied. All rice fields would then progress towards less favorable rice stages, thus significantly decreasing vector populations. During the dry season, cultivation is more synchronous, but there is high variability in the numbers of fields cultivating rice. If rice cultivation was concentrated in certain villages each year, either high or low mosquito numbers could be produced and transmission possibly reduced. Based on the findings presented in this report, these possibilities merit investigation.
Acknowledgments
We thank the Niono Health Center, the Office du Niger, the Institute d’Economie Rurale, and the Niono supervisors and village guides for their collaboration; and Yeya Touré, Robert Gwadz, and the members of the Medical Research and Training Center Geographic Information System Laboratory in Bamako for their advice and help. We also thank Nick Manoukis and Heidi Brown for comments on the manuscript.
Financial support: This work was supported by the U.S. National Institute of Health grant RO1 AI051633.
References
- 1.Dale P, Ritchie S, Territo B, Morris C, Muhar A, Kay B. An overview of remote sensing and GIS for surveillance of mosquito vector habitats and risk assessment. J Vector Ecol. 1998;23:54–61. [PubMed] [Google Scholar]
- 2.Hay S, Packer M, Rogers D. The impact of remote sensing on the study and control of invertebrate intermediate hosts and vectors for disease. Int J Remote Sens. 1997;18:2899–2930. [Google Scholar]
- 3.Hay S, Snow R, Rogers D. From predicting mosquito habitat to malaria seasons using remotely sensed data: practice, problems and perspectives. Parasitol Today. 1998;14:306–313. doi: 10.1016/s0169-4758(98)01285-x. [DOI] [PubMed] [Google Scholar]
- 4.Hay S, Omumbo J, Craig M, Snow R. Earth observation, geographic information systems and Plasmodium falciparum malaria in sub-Saharan Africa. In: Hay SI, Randolph SE, Rogers DF, editors. Advances in Parasitology, Remote Sensing and Geographic Information Systems in Epidemiology. London: Academic Press; 2000. pp. 173–215. [DOI] [PMC free article] [PubMed] [Google Scholar]
- 5.Kitron U. Landscape ecology and epidemiology of vector-borne diseases: tools for spatial analysis. J Med Entomol. 1998;35:435–445. doi: 10.1093/jmedent/35.4.435. [DOI] [PubMed] [Google Scholar]
- 6.Liebhold A, Rossi R, Kemp W. Geostatistics and geographic information-systems in applied insect ecology. Annu Rev Entomol. 1993;38:303–327. [Google Scholar]
- 7.Thomson M, Connor S. Environmental information systems for the control of arthropod vectors of disease. Med Vet Entomol. 2000;14:227–244. doi: 10.1046/j.1365-2915.2000.00250.x. [DOI] [PubMed] [Google Scholar]
- 8.Rogers D, Randolph SE, Snow RW, Hay SI. Satellite imagery in the study and forecast of malaria. Nature. 2002;415:710–715. doi: 10.1038/415710a. [DOI] [PMC free article] [PubMed] [Google Scholar]
- 9.Omumbo JA, Hay SI, Snow RW, Tatem AJ, Rogers DJ. Modelling malaria risk in east Africa at high-spatial resolution. Trop Med Int Health. 2005;10:557–566. doi: 10.1111/j.1365-3156.2005.01424.x. [DOI] [PMC free article] [PubMed] [Google Scholar]
- 10.Diuk-Wasser MA, Toure MB, Dolo G, Bagayoko M, Sogoba N, Traore SF, Manoukis N, Taylor CE. Vector abundance and malaria transmission in rice-growing villages in Mali. Am J Trop Med Hyg. 2005;72:725–731. [PMC free article] [PubMed] [Google Scholar]
- 11.Diuk-Wasser MA, Dolo G, Bagayoko M, Sogoba N, Toure MB, Moghaddam M, Manoukis N, Rian S, Traore SF, Taylor CE. Patterns of irrigated rice growth and malaria vector breeding in Mali using multi-temporal ERS-2 synthetic aperture radar. Int J Remote Sens. 2006;27:535–548. doi: 10.1080/01431160500104350. [DOI] [PMC free article] [PubMed] [Google Scholar]
- 12.Dolo G, Briet OJT, Dao A, Traore SF, Bouare M, Sogoba N, Niare O, Bagayogo M, Sangare D, Teuscher T, Toure YT. Malaria transmission in relation to rice cultivation in the irrigated Sahel of Mali. Acta Trop. 2004;89:147–159. doi: 10.1016/j.actatropica.2003.10.014. [DOI] [PubMed] [Google Scholar]
- 13.Klinkenberg E, Takken W, Huibers F, Touré YT. The phenology of malaria mosquitoes in irrigated rice fields in Mali. Acta Trop. 2003;85:71–82. doi: 10.1016/s0001-706x(02)00254-1. [DOI] [PubMed] [Google Scholar]
- 14.Sissoko MS, Dicko A, Briet OJ, Sissoko M, Sagara I, Keita HD, Sogoba M, Rogier C, Toure YT, Doumbo OK. Malaria incidence in relation to rice cultivation in the irrigated Sahel of Mali. Acta Trop. 2004;89:161–170. doi: 10.1016/j.actatropica.2003.10.015. [DOI] [PubMed] [Google Scholar]
- 15.Service MW. Mosquito Ecology: Field Sampling Methods. New York: Elsevier Applied Science; 1993. [Google Scholar]
- 16.U.S. Geological Service and the National Aeronautics and Space Administration. Earth Observing Systems Data Gateway: Land Processes Distributed Active Archive Center. Reston, VA: U.S. Geological Service; Washington, DC: National Aeronautics and Space Administration; 2006. [Google Scholar]
- 17.Diuk-Wasser MA, Bagayoko M, Sogoba N, Dolo G, Toure MB, Traore SF, Taylor CE. Mapping rice field anopheline breeding habitats in Mali, West Africa, using Landsat ETM+ sensor data. Int J Remote Sens. 2004;25:359–376. doi: 10.1080/01431160310001598944. [DOI] [PMC free article] [PubMed] [Google Scholar]
- 18.Lillesand T, Kiefer R. Remote Sensing and Image Interpretation. New York: John Wiley & Sons; 1994. [Google Scholar]
- 19.Landsat Project Science Office. Landsat 7 Science Data Users Handbook. Greenbelt, MD: National Aeronautics and Space Administration; 2006. [Google Scholar]
- 20.Chavez PS. An improved dark-object subtraction technique for atmospheric scattering correction of multispectral data. Remote Sens Environ. 1988;24:459–479. [Google Scholar]
- 21.Landis JR, Koch GG. Measurement of observer agreement for categorical data. Biometrics. 1977;33:159–174. [PubMed] [Google Scholar]
- 22.Longley P, Goodchild M, Maguire D, Rhind D. Geographical Information Systems: Principles, Techniques, Management and Applications. New York: Wiley & Sons; 1999. [Google Scholar]
- 23.Hobbs JH, Lowe RE, Schreck CE. Studies of flight range and survival of Anopheles albimanus Wiedemann in El Salvador. 1. Dispersal and survival during dry season. Mosq News. 1974;34:389–393. [Google Scholar]
- 24.Touré YT, Dolo G, Petrarca V, Traoré SF, Bouare M, Dao A, Carnahan J, Taylor CE. Mark-release-recapture experiments with Anopheles gambiae sl in Banambani Village, Mali, to determine population size and structure. Med Vet Entomol. 1998;12:74–83. doi: 10.1046/j.1365-2915.1998.00071.x. [DOI] [PubMed] [Google Scholar]
- 25.Costantini C, Li SG, DellaTorre A, Sagnon N, Coluzzi M, Taylor CE. Density, survival and dispersal of Anopheles gambiae complex mosquitoes in a West African Sudan savanna village. Med Vet Entomol. 1996;10:203–219. doi: 10.1111/j.1365-2915.1996.tb00733.x. [DOI] [PubMed] [Google Scholar]
- 26.Sokal RR, Rohlf FJ. Biometry: The Principles and Practice of Statistics in Biological Research. New York: W. H. Freeman; 1995. [Google Scholar]
- 27.Burnham KP, Anderson DR. Multimodel inference—understanding AIC and BIC in model selection. Sociol Methods Res. 2004;33:261–304. [Google Scholar]
- 28.Van Niel TG, McVicar TR. Current and potential uses of optical remote sensing in rice-based irrigation systems: a review. Aust J Agric Res. 2004;55:155–185. [Google Scholar]
- 29.Wood B, Beck L, Washino R, Palchick S, Sebesta P. Spectral and spatial characterization of rice field mosquito habitat. Int J Remote Sens. 1991;12:621–626. [Google Scholar]
- 30.Wood B, Washino R, Beck L, Hibbard K, Pitcairn M, Roberts D, Rejmankova E, Paris J, Hacker C, Salute J, Sebesta P, Legters L. Distinguishing high and low anopheline-producing rice fields using remote-sensing and GIS technologies. Prev Vet Med. 1991;11:277–288. [Google Scholar]
- 31.Wood BL, Beck LR, Washino RK, Hibbard KA, Salute JS. Estimating high mosquito-producing rice fields using spectral and spatial data. Int J Remote Sens. 1992;13:2813–2826. [Google Scholar]
- 32.Rodriguez A, Rodriguez M, Hernandez J, Dister S, Beck L, Rejmankova E, Roberts D. Landscape surrounding human settlements and Anopheles albimanus (Diptera: Culicidae) abundance in southern Chiapas, Mexico. J Med Entomol. 1996;33:39–48. doi: 10.1093/jmedent/33.1.39. [DOI] [PubMed] [Google Scholar]
- 33.Beck L, Rodriguez M, Dister S, Rodriguez A, Rejmankova E, Ulloa A, Meza R, Roberts D, Paris J, Spanner M, Washino R, Hacker C, Legters L. Remote sensing as a landscape epidemiologic tool to identify villages at high risk for malaria transmission. Am J Trop Med Hyg. 1994;51:271–280. doi: 10.4269/ajtmh.1994.51.271. [DOI] [PubMed] [Google Scholar]
- 34.Beck L, Rodriguez M, Dister S, Rodriguez A, Washino R, Roberts D, Spanner M. Assessment of a remote sensing-based model for predicting malaria transmission risk in villages of Chiapas, Mexico. Am J Trop Med Hyg. 1997;56:99–106. doi: 10.4269/ajtmh.1997.56.99. [DOI] [PubMed] [Google Scholar]
- 35.Kitron U, Otieno L, Hungerford L, Odulaja A, Brigham W, Okello O, Joselyn M, Mohamedahmed M, Cook E. Spatial analysis of the distribution of tsetse flies in the Lambwe Valley, Kenya, using Landsat TM satellite imagery and GIS. J Anim Ecol. 1996;65:371–380. [Google Scholar]
- 36.Thomas C, Lindsay S. Local-scale variation in malaria infection amongst rural Gambian children estimated by satellite remote sensing. Trans R Soc Trop Med Hyg. 2000;94:159–163. doi: 10.1016/s0035-9203(00)90257-8. [DOI] [PubMed] [Google Scholar]
- 37.Jacob BG, Arheart KL, Griffith DA, Mbogo CM, Githeko AK, Regens JL, Githure JI, Novak R, Beier JC. Evaluation of environmental data for identification of Anopheles (Diptera: Culicidae) aquatic larval habitats in Kisumu and Malindi, Kenya. J Med Entomol. 2005;42:751–755. doi: 10.1093/jmedent/42.5.751. [DOI] [PMC free article] [PubMed] [Google Scholar]
- 38.Jacob BG, Regens JL, Mbogo CM, Githeko AK, Keating J, Swalm CM, Gunter JT, Githure JI, Beier JC. Occurrence and distribution of Anopheles (Diptera: Culicidae) larval habitats on land cover change sites in urban Kisumu and urban Malindi, Kenya. J Med Entomol. 2003;40:777–784. doi: 10.1603/0022-2585-40.6.777. [DOI] [PubMed] [Google Scholar]
- 39.Gillies M. The Anophelinae of Africa South of the Sahara (Ethiopian Zoogeographical Region) Johannesburg: South African Institute for Medical Research; 1968. [Google Scholar]
- 40.Thomson M, Connor S, Quinones M, Jawara M, Todd J, Greenwood B. Movement of Anopheles gambiae Sl malaria vectors between villages in the Gambia. Med Vet Entomol. 1995;9:413–419. doi: 10.1111/j.1365-2915.1995.tb00015.x. [DOI] [PubMed] [Google Scholar]
- 41.Carter R, Mendis K, Roberts D. Spatial targeting of interventions against malaria. Bull World Health Organ. 2000;78:1401–1411. [PMC free article] [PubMed] [Google Scholar]
- 42.Briët O, Dossou-Yovo J, Akodo E, van de Giesen N, Teuscher T. The relationship between Anopheles gambiae density and rice cultivation in the savannah zone and forest zone of Côte d’Ivoire. Trop Med Int Health. 2003;8:439–448. doi: 10.1046/j.1365-3156.2003.01054.x. [DOI] [PubMed] [Google Scholar]
- 43.Ijumba J, Lindsay S. Impact of irrigation on malaria in Africa: paddies paradox. Med Vet Entomol. 2001;15:1–11. doi: 10.1046/j.1365-2915.2001.00279.x. [DOI] [PubMed] [Google Scholar]
- 44.Keiser J, Singer BH, Utzinger J. Reducing the burden of malaria in different eco-epidemiological settings with environmental management: a systematic review. Lancet Infect Dis. 2005;5:695–708. doi: 10.1016/S1473-3099(05)70268-1. [DOI] [PubMed] [Google Scholar]
- 45.Keiser J, de Castro MC, Maltese MF, Bos R, Tanner M, Singer BH, Utzinger J. Effect of irrigation and large dams on the burden of malaria on a global and regional scale. Am J Trop Med Hyg. 2005;72:392–406. [PubMed] [Google Scholar]