

Abstract
Purpose
To compare the ability of the Heidelberg retina tomograph version 3 (HRT 3) and HRT version 2 (HRT 2) to discriminate between healthy and glaucomatous eyes.
Design
Retrospective cross-sectional study.
Participants
Seventy-one eyes of 71 healthy volunteers and 50 eyes of 50 glaucoma patients were studied. The average visual field mean deviation of the glaucoma group was −6.03±5.78 dB.
Intervention
All participants had comprehensive ocular examinations, perimetry, and HRT scanning within 6 months. HRT 2 data were analyzed using HRT 3 software without modifying the disc margin.
Main Outcome Measures
Discrimination capabilities between healthy and glaucomatous eyes were determined by areas under the receiver operating characteristics (AROCs) curves. Comparisons between corresponding AROCs obtained by HRT 2 and HRT 3 analyses were performed using the nonparametric DeLong method. Agreement between classifications as defined by the different analysis methods was quantified by κ analysis.
Results
The individual stereometric parameters with the best discrimination were linear cup/disc ratio (AROC = 0.897; 95% confidence interval [Cl], 0.836–0.958) for standard HRT 3 analysis and horizontal retinal nerve fiber layer curvature (0.905) for HRT 3 glaucoma probability score (GPS) analysis. Areas under the receiver operating characteristics for discrimination between glaucomatous and healthy eyes of the overall classification by HRT 2 Moorfields regression analysis (MRA), HRT 3 MRA, and GPS were 0.927 (95% Cl, 0.877–0.977), 0.934 (0.888–0.980), and 0.880 (0.812–0.948), respectively. The difference between the 3 AROCs was not significant (P = 0.44). The agreement between HRT 2 and HRT 3 overall MRA classification was good (κ = 0.70; Cl, 0.59–0.80) with HRT 3 tending to report more abnormalities than HRT 2 analysis. The agreement between overall HRT 3 MRA and overall GPS was κ = 0.58 (Cl, 0.45–0.70).
Conclusions
The glaucoma discriminating ability of the new HRT 3 software is similar to that of the previous generation HRT 2. The GPS analysis showed promising results in differentiating between healthy and glaucomatous eyes without the need for subjective operator input.
Confocal scanning laser ophthalmoscopy uses a diode-laser light source to produce quantitative measurements of the optic nerve head (ONH) and posterior segment. A commercially available confocal scanning laser ophthalmoscopy device, the Heidelberg retina tomograph (HRT; Heidelberg Engineering GmbH, Heidelberg, Germany) has been shown to be capable of detecting the structural alterations in glaucoma. Numerous studies have reported that HRT measurements are highly reproducible.1–7 Previous studies have also shown that HRT morphologic parameters can discriminate between healthy eyes and eyes with glaucomatous visual field (VF) defects.8–12
One of the limitations of the HRT is the requirement that the operator manually create a contour line. The contour line is placed at the inner border of scleral ring, and many of the quantitative measurements depend on proper line placement. Drawing the contour line is not only time consuming, but also may introduce interoperator variability.7,13,14 The newly released HRT 3 software (version 3.0) offers an option for alternative analysis that does not require placement of a contour line. The technique provides stereometric data by applying an automatic model of the ONH shape as suggested by Swindale et al.15 The resultant morphologic parameters are analyzed by a machine learning classifier (relevance vector machine) resulting in a glaucoma probability score (GPS).
The new software version also includes a larger and ethnicity-specific normative database. Although the normative database in HRT 2 included 349 subjects for the stereoscopic parameters and 110 subjects for the Moorfields regression analysis (MRA), HRT 3 normative database includes 733 healthy Caucasian eyes and 215 healthy African American eyes.16 Based on the enlarged database, the equations of the MRA were modified. In addition, stereometric parameters are compared to the values of the normative dataset and between the eyes.
The objective of this study was to compare the performance of the conventional HRT 3, GPS, and HRT 2 analysis in the discrimination of healthy and glaucomatous eyes.
Materials and Methods
Subjects
In this retrospective cross-sectional study, all subjects were ≥ 18 years with best-corrected visual acuity of ≥ 20/40 and spherical refraction between +6.00 and −6.00 diopters with cylinder power < 3.00 diopters. The exclusion criteria were a history of diabetes and eyes with signs of retinal or ONH pathology other than those attributed to glaucoma, significant media opacity in which the fundus was not visible, or eyes with any intraocular trauma or surgery except for uneventful cataract or glaucoma surgeries at least 6 months before recruitment. Subjects with neurologic conditions that might affect their VF were also excluded from the study.
All participants underwent a comprehensive ophthalmic examination, which included medical and family history, best-corrected visual acuity and refraction, intraocular pressure measurement, detailed stereoscopic biomicroscopy of the anterior and posterior segments before and after pupil dilation, Swedish interactive thresholding algorithm standard 24-2 perimetry (Carl Zeiss Meditec, Dublin, CA), and HRT 2 scanning. Pupillary dilation was obtained with 1% tropicamide (Alcon Laboratories Inc., Fort Worth, TX) and 2.5% phenylephrine hydrochloride (Alcon Laboratories Inc.).
The study was approved by the institutional review board/ethics committee, and adhered to declaration of Helsinki and the Health Insurance Portability and Accountability Act regulations. Informed consent was obtained from all participants.
Two clinically defined groups were included in this study: healthy subjects and glaucoma patients. Because the primary outcome parameter of the study was the ability of the various HRT software packages to discriminate between healthy and glaucomatous eyes, and because the HRT quantifies structural features of the ONH, the definition of normal and glaucoma used in this study was based on VF findings alone. Eyes were classified as healthy if they had no history of glaucoma, intraocular pressure of ≤ 21 mmHg, and normal Swedish interactive thresholding algorithm 24-2 VF.
Eyes were classified as glaucomatous if VF defects were evident on 2 consecutive VF tests. Defects were defined as a glaucoma hemifield test outside normal limits (ONL), or a pattern standard deviation probability of < 5%, or a cluster of ≥ 3 non-edge points in a location typical for glaucoma, all of which were depressed on the pattern deviation plot at a P <5% level and at least 1 of which depressed at a P < 1% level. A reliable test was defined as one with <30% fixation losses, <30% false-positive responses, and <30% false-negative responses.
Heidelberg Retina Tomograph
All participants were scanned with the HRT 2 device. Three scans were acquired automatically after initial positioning by the operator. All scans were assessed subjectively for the presence of good ONH centration, focus, and uniform illumination. All scans had InterScan standard deviation of < 50 μm. The operator manually defined the ONH margin as the inner border of the Elschnig ring.
Heidelberg retina tomograph 2 data were exported and reanalyzed by HRT 3 software without modifying the disc margin location as identified by the drawn reference circle. The conventional stereometric parameters were calculated by HRT 3 accounting for the disc margin location. The new HRT 3 software included a larger and ethnicity-specific normative database. The parameters were compared to the normative dataset and labeled with ordinal classifications of within normal limits (WNL), borderline (BL), or ONL. Moorfields regression analysis was similarly updated and used the same classifications. In addition, an automatic analysis of the topographic image was included. The output of the analysis was provided as a GPS ranging from 0% to 100%. Scores from 0% to 27% were categorized by the software as WNL, 28% to 64% as BL, and 65% to 100% as ONL. The overall GPS diagnosis was provided as an ordinal output only.
A horizontal scaling error was reported by the manufacturer, in which horizontal HRT 2 stereometric measurements were 4% enlarged; this was corrected in HRT 3.16 The following global HRT 3 stereometric parameters were recorded: linear cup/disc ratio, cup shape measure, rim area, rim volume, height variation contour, and mean retinal nerve fiber layer (RNFL) thickness. Overall, global and sectoral HRT 2 MRA, HRT 3 MRA, and GPS classification were recorded. Global stereometric parameters from the GPS printout including cup depth, horizontal RNFL curvature, vertical RNFL curvature, GPS numeric score, rim steepness, and cup size were also recorded. The impact of the inclusion of ethnicity data on discriminating power of HRT 3 MRA versus HRT 2 MRA was also examined.
Analysis
The outcome parameters of WNL, BL, and ONL were treated as ordinal data. All other parameters were treated as continuous data. The data were collected on a statistical software database (IMP software, SAS Institute, Gary, NC). Differences among groups were assessed by a Student’s t test for continuous parameters, chi-square test for categorical parameters, and Wilcoxon test for nonparametric comparison. Receiver operating characteristic (ROC) curves were used with continuous and ordinal categories created from the continuous stereometric variables to determine the discrimination capabilities between healthy and glaucomatous eyes. Areas under the ROCs curves (AROC) were compared using DeLong’s nonparametric method.17 The agreement among classifications by HRT 2 MRA, HRT 3 MRA, and GPS was assessed using the κ coefficient. Logistic regression was used to assess the contribution of age, gender, ethnicity, and disc size for the prediction of glaucoma as defined by HRT 2 MRA, HRT 3 MRA, and GPS. Interactions between parameters were included in the models when they were significant. The most theoretically meaningful models were fitted and the one with the most explanatory factors that were statistically significant was chosen. Separate ordinal logistic regression models were created for glaucoma prediction using HRT 2 MRA, HRT 3 MRA, and GPS as categorical 3-level variables with WNL category as the base for comparison. A multivariate test was done for all 3 AROCs using the DeLong method. In cases where the difference was not significant, no additional analysis was conducted. In cases where the multivariate test was significant, the 3 possible univariate tests were calculated.
The analysis was conducted using IMP, SAS (SAS Institute) and the R language and environment for statistical computing (R Foundation for Statistical Computing, www.r-project.org). A significance level of P <0.05 indicated statistical significance.
Results
Subjects’ Characteristics
Fifty eyes of 50 glaucoma patients and 71 eyes of 71 healthy volunteers were enrolled in this study. The study demographics are summarized in Table 1. Healthy subjects were significantly younger than glaucoma patients (P<0.001). The average VF mean deviation was −6.03±5.78 dB in the glaucoma group, spanning the spectrum from early to advanced disease, but reflecting on average a moderate degree of glaucomatous damage, and −0.46±0.96 dB in the healthy group. The disc area ranged between 0.835 and 3.798 mm2 (average, 1.91 ±0.5 mm2).
Table 1.
Characteristics of the Study Population
| Healthy (n =71) | Glaucoma (n = 50) | P | |
|---|---|---|---|
| Age (yrs) | 45. 1±17.7 (18.6–79.0) | 66.4± 12.7 (35.0–88.3) | <0.0001* |
| Gender (M/F) | 21/50 | 27/23 | 0.007† |
| Race | 0.11 | ||
| Caucasian | 64 | 39 | |
| Asian | 1 | 3 | |
| African American | 6 | 8 | |
| Eye (R/L) | 29/42 | 26/24 | 0.2† |
| Mean deviation (dB) | −0.46±0.96 (−3.04–1.28) | −6.03±5.78 (−21.49–0.32) | <0.0001‡ |
| SD of HRT scans (mm) | 16.1±7.9(8–50) | 21.4±8.5 (10–45) | <0.0001‡ |
F = female; HRT = Heidelberg retina tomograph; L = left; M = male; NA = not applicable; R = right; SD = standard deviation.
Values are n or means ± SD.
t test.
Chi-square test.
Wilcoxon test.
Discrimination by Stereometric Parameters
The best discriminating ability between glaucoma and healthy subjects among the conventional stereometric parameters of HRT 3 was obtained with linear cup/disc ratio (AROC = 0.897; Table 2). The best AROC among GPS individual parameters was obtained with horizontal RNFL curvature (AROC = 0.905). Using the ordinal classification of the stereometric parameters (WNL, BL, or ONL) the discriminating ability of all parameters decreased compared to the continuous measure. There was no overlap in the confidence intervals between the numerical and ordinal parameters. Therefore, a significant difference between the methods was noted for the following parameters: linear cup/disc ratio, cup shape measure, and mean RNFL.
Table 2.
Area under the Receiver Operating Characteristics (95% Confidence Interval) for Discrimination between Healthy and Glaucomatous Eyes Using Heidelberg Retina Tomograph (HRT) 3 Stereometric Parameters
| Characteristic | Numerical Output | Ordinal Output |
|---|---|---|
| HRT 3 | ||
| Linear cup/disc ratio | 0.897 (0.836–0.958) | 0.693 (0.623–0.763) |
| Cup shape measure | 0.871 (0.809–0.932) | 0.664(0.596–0.731) |
| Rim area | 0.839 (0.759–0.920) | 0.815 (0.744–0.886) |
| Rim volume | 0.825 (0.745–0.906) | 0.753 (0.677–0.828) |
| Mean RNFL thickness | 0.790 (0.702–0.877) | 0.623 (0.560–0.686) |
| Height variation contour | 0.615 (0.504–0.726) | 0.530 (0.497–0.563) |
| GPS | ||
| Horizontal RNFL curvature | 0.905 (0.844–0.966) | NA |
| GPS global | 0.899(0.837–0.961) | 0.862 (0.794–0.929) |
| Cup size | 0.768 (0.678–0.858 | NA |
| Vertical RNFL curvature | 0.731 (0.636–0.731) | NA |
| Rim steepness | 0.686 (0.586–0.786) | NA |
| Cup depth | 0.560 (0.453–0.666) | NA |
GPS = glaucoma probability score; NA = not applicable; RNFL = retinal nerve fiber layer.
Discrimination by Classification Methods
The AROC for differentiation between glaucomatous and healthy eyes was 0.927 using HRT 2 overall MRA classification, 0.934 for HRT 3, and 0.880 for overall GPS ordinal analysis (P = 0.44 between the 3 methods; Fig 1).
Figure 1.
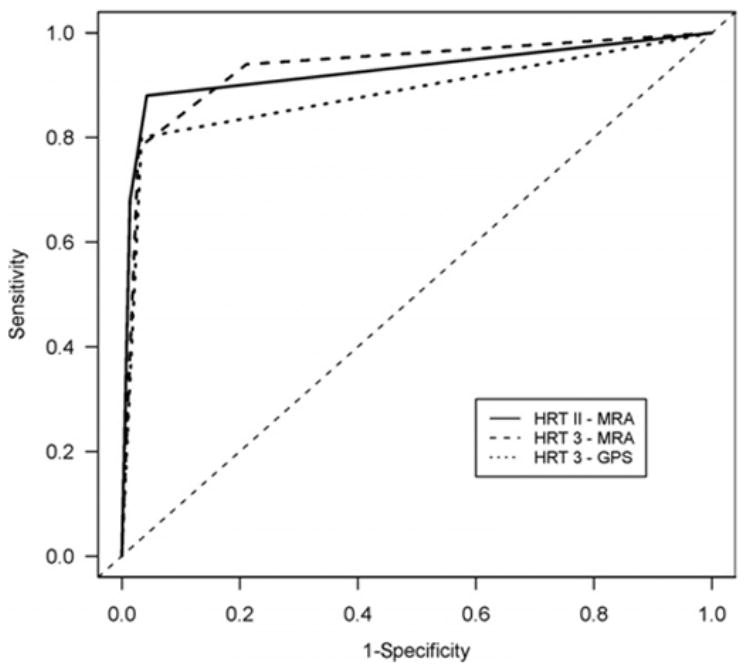
Receiver operating characteristic curve for discriminating between healthy and glaucomatous eyes using overall Heidelberg retina tomograph (HRT) 2 Moorfields regression analysis (MRA), HRT 3 MRA, and HRT 3 glaucoma probability score (GPS).
Age was a significant contributor to the prediction of glaucoma as defined by HRT 2 and HRT 3 MRA (both P = 0.001). In our sample, gender, ethnicity, and disc size did not contribute significantly to the prediction of disease (all P >0.05). In reviewing the effect of ethnicity on the differences in MRA outcomes between HRT 2 and HRT 3, there was 1 African American subject for whom the original classification with HRT 2 was BL and that with HRT 3 was ONL. All other differences between the 2 MRA classifications occurred in Caucasian subjects. For GPS analysis, age was the only significant contributor to the prediction (P = 0.0001). Gender, ethnicity, and disc size did not significantly affect the prediction ability of GPS.
Agreements between Classification Methods
Table 3 outlines the agreement between the classification by HRT 2 MRA and HRT 3 MRA. The overall κ agreement was 0.70 (95% confidence interval, 0.59–0.80). Generally, HRT 3 MRA defines more eyes as abnormal compared with HRT 2 MRA. Although all 35 eyes that were ONL by HRT 2 were also ONL by HRT 3, 20% (15 out of 74) of subjects that were classified as WNL by HRT 2 were BL by HRT 3 and 50% (6 out of 12) of the BL eyes by HRT 2 were considered ONL by HRT 3. Table 4 outlines the agreement between the classification by HRT 3 MRA and the ordinal classification of GPS. The overall agreement between HRT 3 MRA and GPS was κ = 0.58 (95% confidence interval, 0.45–0.70) and there was no apparent pattern in the classification of eyes that were differently labeled by the 2 methods.
Table 3.
Subjects’ Classification by Overall Heidelberg Retina Tomograph (HRT) 2 Moorfields Regression Analysis (MRA) and HRT 3 MRA
| HRT 2
|
||||
|---|---|---|---|---|
| WNL | BL | ONL | Total | |
| HRT3 | ||||
| WNL | 59 | 0 | 0 | 59 |
| BL | 15 | 6 | 0 | 21 |
| ONL | 0 | 6 | 35 | 41 |
| Total | 74 | 12 | 35 | 121 |
BL = borderline; ONL = outside normal limits; WNL = within normal limits.
Table 4.
Subjects’ Classification by Overall Heidelberg Retina Tomograph (HRT) 3 Moorfields Regression Analysis and Glaucoma Probability Score (GPS)
| HRT 3
|
||||
|---|---|---|---|---|
| WNL | BL | ONL | Total | |
| GPS | ||||
| WNL | 50 | 11 | 2 | 63 |
| BL | 6 | 7 | 6 | 19 |
| ONL | 3 | 3 | 33 | 39 |
| Total | 59 | 21 | 41 | 121 |
BL = borderline; ONL = outside normal limits; WNL = within normal limits.
Discrimination by Global and Sectoral Classification Methods
The AROCs for discrimination between glaucomatous and healthy eyes by sectoral and global HRT 2 MRA, HRT 3 MRA, and ordinal results of GPS appear in Table 5. The AROC for GPS was significantly larger than for both HRT 2 MRA and HRT 3 MRA in all sectors except for the nasal inferior and global. The differences in AROCs between HRT 2 MRA and HRT 3 MRA were not significant. Using the continuous numerical GPS results the AROC ranged between 0.899 (global) to 0.950 (temporal superior). The differences between the numerical and ordinal GPS AROCs were significant for all sectors except for the global GPS.
Table 5.
Area under the Receiver Operating Characteristic Curve for Discriminating between Healthy and Glaucoma Eyes for Ordinal Heidelberg Retina Tomograph (HRT) 2 Moorfields Regression Analysis (MRA), HRT 3 MRA, and Glaucoma Probability Score (GPS) classification
| Sector | HRT 2 MRA | HRT 3 MRA | HRT 3 GPS |
|---|---|---|---|
| Overall | 0.927 (0.877–0.977) | 0.934 (0.888–0.980) | 0.880 (0.812–0.948) |
| Global | 0.769 (0.697–0.841) | 0.815 (0.744–0.886) | 0.862 (0.794–0.929) |
| Nasal | 0.669 (0.599–0.739) | 0.730 (0.657–0.812) | 0.897* (0.836–0.958) |
| Nasal inferior | 0.824 (0.755–0.893) | 0.843 (0.774–0.911) | 0.896 (0.836–0.956) |
| Nasal superior | 0.731 (0.658–0.803) | 0.755 (0.679–0.830) | 0.900* (0.841–0.959) |
| Temporal | 0.620 (0.560–0.680) | 0.686 (0.610–0.762) | 0.897* (0.836–0.958) |
| Temporal inferior | 0.843 (0.776–0.909) | 0.846 (0.783–0.917) | 0.907* (0.876–0.939) |
| Temporal superior | 0.710 (0.641–0.779) | 0.731 (0.657–0.806) | 0.900* (0.841–0.959) |
Significant difference between GPS and both HRT 2 and HRT 3 MRA.
Agreement between Global and Sectoral Classification Methods
The agreement between HRT 2 MRA and HRT 3 MRA sectoral classifications ranged between κ = 0.44 (temporal) and κ = 0.76 (temporal inferior). The agreement between HRT 3 MRA and GPS sectoral classification ranged between 0.14 (temporal) and 0.57 (nasal inferior).
Discussion
The new HRT 3 GPS software utilizes an automated analysis of the ONH shape without the need for manual definition of the optic disc margin. In this study, we found a similar ability to discriminate between healthy and glaucomatous eyes by the best individual morphologic parameter of the conventional method (linear cup/disc ratio AROC = 0.897) and the automated technique (horizontal RNFL curvature AROC = 0.905; Table 2). Overall MRA classification showed further improvement in the discriminating ability (AROC = 0.934) compared with the ability of the best single parameter, whereas for GPS the overall result remained at a similar level of discrimination as that of the single parameters (AROC = 0.880).
The HRT 3 software includes a larger normative database than that used in HRT 2. This allows the HRT 3 database to be stratified by various ethnic groups. Assessing the effect of these modifications on the discriminating ability of HRT, we could not find a significant difference between HRT 2 and HRT 3. Good agreement was observed between HRT 2 and HRT 3 MRA classification, although HRT 3 tended to report a higher degree of abnormality than HRT 2 (Table 3). This might be due to a narrower confidence interval in the enlarged normative dataset with a consequent tendency of reporting higher degree of abnormality. Interestingly, this tendency was not reflected in the discriminatory ability as was observed by the similar AROCs. Ethnicity was not a significant contributor to the prediction of glaucoma for both HRT 2 and HRT 3, and we observed only 1 African American subject where MRA classification was different in HRT 3 than the classification by HRT 2. This finding might be due to the relatively small percentage of non-Caucasians in our study group, or it might imply that the original MRA dataset, although not including non-Caucasians, accounted for most of the variability between races by adjusting for the disc size in the linear regression. Alternatively, it might be due to an inadequate number of subjects in the normative database that would allow appropriate ethnic specific adjustment.
Glaucoma probability score analysis has the theoretical advantage of obtaining structural measurements without the requirement of operator subjective intervention. We have shown that the discriminating ability of the method is similar to those observed by “conventional” single stereometric parameters or MRA (Tables 2, 5; Fig 1). It should be noted that the study group included moderately damaged glaucomatous eyes, which might overestimate the discriminatory ability of the device in early damaged eyes. Although the GPS algorithm does not include disc size, as opposed to MRA, and might be prone to failure in the assessment of small and shallow discs, there was no significant effect of disc size on the prediction of glaucoma by GPS. Other ocular features such as myopic disc and peripapillary atrophy might also influence the reliability of the GPS automatic assessment of the ONH. However, our study group included a small number of such features and no firm conclusion could be made. We found a significant contribution of age to the prediction of glaucoma by both MRA and GPS that might be due to less than optimal age adjustment in the normative dataset incorporated into the machine’s software.
In the original description of the GPS mathematical model by Swindale et al,15 the best single parameter of the model was horizontal image curvature (AROC = 0.93). This is in concordance with our observation that the best parameter in the commercial software was horizontal RNFL curvature. Horizontal image curvature (Swindale et al15) and horizontal RNFL curvature (the present study) each refer to the overall curvature along the nasotemporal axis.
Unlike MRA, where the overall classification outperformed the individual sectors, in GPS analysis the overall classification had similar discriminating ability compared to GPS analysis of the individual sectors (Table 5). Moreover, although we found that discriminating ability was significantly improved by segmental GPS results as compared with segmental MRA results, the GPS overall classification was not better than the MRA. These findings might indicate that the method used by the analysis for the overall classification where the worst segmental classification defined the overall classification might not be the best method for this parameter. Further investigation is warranted.
Although there was good agreement between HRT 2 and HRT 3 MRA, the agreement between the classification of eyes as defined by MRA and GPS was lower. This was evident both in the sectoral analysis and in the overall classification. Therefore, the anatomic features that each method used for defining glaucoma differed and the results were not interchangeable. A longitudinal study may determine which method was more accurate in predicting structural glaucomatous abnormalities.
The ordinal classification provided by HRT 3 software allows easier identification of abnormal results. However, significant differences were noted between the discrimination performance of the ordinal and continuous individual stereometric parameters, as well as GPS for most of the parameters (Table 2). Although a reduction in the ordinal categorization is expected, a few parameters showed discriminating ability as good as the continuous parameters. This might indicate that further tuning of the ordinal cutoffs might improve the performance of this classification method.
In summary, the new HRT software provides automatic interpretation of topographic images without the need for manual drawing of the counter line. This eliminates a major source of variability in HRT measurements.7,13,14 This mathematical model offers an ability to discriminate between healthy and glaucomatous eyes, similar to that of the HRT 2 without the need for subjective user input.
Acknowledgments
Supported in part by the National Institutes of Health, Bethesda, Maryland (grant nos. RO1-EY013178-6, P30-EY008098); Eye and Ear Foundation, Pittsburgh, Pennsylvania; and an unrestricted grant from Research to Prevent Blindness, Inc., New York, New York.
Footnotes
Presented at: Association of Research in Vision and Ophthalmology annual meeting, April 2006, Ft. Lauderdale, Florida.
References
- 1.Kruse FE, Burk RO, Volcker HE, et al. Reproducibility of topographic measurements of the optic nerve head with laser tomographic scanning. Ophthalmology. 1989;96:1320–4. doi: 10.1016/s0161-6420(89)32719-9. [DOI] [PubMed] [Google Scholar]
- 2.Dreher AW, Tso PC, Weinreb RN. Reproducibility of topographic measurements of the normal and glaucomatous optic nerve head with the laser tomographic scanner. Am J Ophthalmol. 1991;111:221–9. doi: 10.1016/s0002-9394(14)72263-9. [DOI] [PubMed] [Google Scholar]
- 3.Rohrschneider K, Burk RO, Volcker HE. Reproducibility of topometric data acquisition in normal and glaucomatous optic nerve heads with the laser tomographic scanner. Graefes Arch Clin Exp Ophthalmol. 1993;231:457–64. doi: 10.1007/BF02044232. [DOI] [PubMed] [Google Scholar]
- 4.Rohrschneider K, Burk RO, Kruse FE, Volcker HE. Reproducibility of the optic nerve head topography with a new laser tomographic scanning device. Ophthalmology. 1994;101:1044–9. doi: 10.1016/s0161-6420(94)31220-6. [DOI] [PubMed] [Google Scholar]
- 5.Chauhan BC, LeBlanc RP, McCormick TA, Rogers JB. Test-retest variability of topographic measurements with confocal scanning laser tomography in patients with glaucoma and control subjects. Am J Ophthalmol. 1994;118:9–15. doi: 10.1016/s0002-9394(14)72836-3. [DOI] [PubMed] [Google Scholar]
- 6.Janknecht P, Funk J. Optic nerve head analyser and Heidelberg retina tomograph: accuracy and reproducibility of topographic measurements in a model eye and in volunteers. Br J Ophthalmol. 1994;78:760–8. doi: 10.1136/bjo.78.10.760. [DOI] [PMC free article] [PubMed] [Google Scholar]
- 7.Miglior S, Albe E, Guareschi M, et al. Intraobserver and interobserver reproducibility in the evaluation of optic disc stereometric parameters by Heidelberg Retina Tomograph. Ophthalmology. 2002;109:1072–7. doi: 10.1016/s0161-6420(02)01032-1. [DOI] [PubMed] [Google Scholar]
- 8.Mikelberg FS, Parfitt CM, Swindale NV. Ability of the Heidelberg retina tomograph to detect early glaucomatous visual field loss. J Glaucoma. 1996;4:242–7. [PubMed] [Google Scholar]
- 9.Uchida H, Brigatti L, Caprioli J. Detection of structural damage from glaucoma with confocal laser image analysis. Invest Ophthalmol Vis Sci. 1996;37:2393–401. [PubMed] [Google Scholar]
- 10.Hatch WV, Flanagan JG, Etchells EE, et al. Laser scanning tomography of the optic nerve head in ocular hypertension and glaucoma. Br J Ophthalmol. 1997;81:871–6. doi: 10.1136/bjo.81.10.871. [DOI] [PMC free article] [PubMed] [Google Scholar]
- 11.Iester M, Mikelberg FS, Drance SM. The effect of optic disc size on diagnostic precision with the Heidelberg retina tomograph. Ophthalmology. 1997;104:545–8. doi: 10.1016/s0161-6420(97)30277-2. [DOI] [PubMed] [Google Scholar]
- 12.Wollstein G, Garway-Heath DF, Hitchings RA. Identification of early glaucoma cases with the scanning laser ophthalmoscope. Ophthalmology. 1998;105:1557–63. doi: 10.1016/S0161-6420(98)98047-2. [DOI] [PubMed] [Google Scholar]
- 13.Garway-Heath DF, Poinoosawmy D, Wollstein G, et al. Inter-and intraobserver variation in the analysis of optic disc images: comparison of the Heidelberg retina tomograph and computer assisted planimetry. Br J Ophthalmol. 1999;83:664–9. doi: 10.1136/bjo.83.6.664. [DOI] [PMC free article] [PubMed] [Google Scholar]
- 14.Iester M, Mikelberg FS, Courtright P, et al. Interobserver variability of optic disk variables measured by confocal scanning laser tomography. Am J Ophthalmol. 2001;132:57–62. doi: 10.1016/s0002-9394(01)00938-2. [DOI] [PubMed] [Google Scholar]
- 15.Swindale NV, Stjepanovic G, Chin A, Mikelberg FS. Automated analysis of normal and glaucomatous optic nerve head topography images. Invest Ophthalmol Vis Sci. 2000;41:1730–42. [PubMed] [Google Scholar]
- 16.Heidelberg Retina Tomograph Glaucoma Module. Operating Instructions Software Version 3.0. Heidelberg, Germany: Heidelberg Engineering; 2005. [Google Scholar]
- 17.DeLong E, DeLong D. Comparing the area under two or more correlated receiver operating characteristics curves: a non-parametric approach. Biometrics. 1988;44:837–45. [PubMed] [Google Scholar]