Abstract
Purpose
To compare visual field (VF) defects found by Swedish interactive thresholding Algorithm (SITA) perimetry and Matrix perimetry, a new VF device that utilizes frequency doubling technology in a 24-2 test pattern.
Design
Prospective cross-sectional study.
Participants
Fifty eyes from 50 subjects with SITA field defects were recruited for an observational study.
Methods
Swedish Interactive Threshold Algorithm and Matrix VF testing were performed on patients from a glaucoma practice. To evaluate the learning effect on the performance of the VF, we tested subsets of each group who had previous experience with standard automated perimetry (SAP).
Main Outcome Measures
Test duration, mean threshold, mean deviation (MD), pattern standard deviation (PSD), glaucoma hemifield test, and number of abnormal points on the pattern deviation plot were evaluated for each device.
Results
Test duration was significantly shorter for Matrix (SITA, 357.0±85.6 seconds; Matrix, 319.5±16.5 seconds; P = 0.0002, paired t-test). Thirty-six percent of eyes with SITA VF defects showed a normal Matrix field. In 30 of 32 eyes (94%) where both devices showed VF defects, the defects were congruent. Mean threshold value was significantly lower with Matrix compared to SITA (P<0.0001, paired t-test), as was MD (−5.34±5.42 dB, −4.14±5.29 dB, respectively; P = 0.03, paired t-test). There was no significant difference in PSD between the 2 devices (P = 0.78, paired t-test). Matrix delineated significantly smaller (P = 0.005, Wilcoxon’s test) and deeper (P<0.001, Wilcoxon’s test) defects than those found with SITA. Similar results were observed in the subgroups with prior SAP experience.
Conclusions
The Matrix examination did not detect 36% of abnormal SITA fields. Matrix field defects were smaller and deeper than those appearing in SITA perimetry.
Glaucoma is a leading cause of blindness worldwide. When assessing glaucoma, the severity of disease is often quantified by the degree of visual field (VF) loss. Currently, standard achromatic perimetry (SAP) is the clinical test most often used for evaluating the VF in these patients; however, it has been shown that this device does not detect VF abnormalities until 30% to 50% of retinal ganglion cell axons are lost.1 Therefore, a need exists for a visual function assessment technology capable of earlier detection of glaucomatous damage.2,3
One method that has been studied extensively is frequency doubling technology (FDT) perimetry, which may be sensitive to deficits in visual function before they are detectable by SAP.4 The FDT stimulus consists of alternating white and black bars that are presented as low spatial frequency (0.5 cyc/deg) sinusoidal grating undergoing high temporal frequency counterphase flickering (18 Hz). This produces a frequency doubling illusion of twice as many bars being seen, which is mediated by the magnocellular retinal ganglion cells.5 Previous studies have shown that these cells are preferentially lost in glaucoma.6 The accuracy of FDT was demonstrated in several studies that showed high sensitivity and specificity for detecting VF deficits compared to SAP testing.7–9 Furthermore, its utility and effectiveness in earlier detection has been demonstrated in longitudinal studies that revealed that deficits noted by FDT perimetry were predictive of abnormalities before they could be detected by SAP testing, as well as the location of those defects.4,10 However, it is difficult to compare FDT findings to those obtained by SAP directly, because FDT tests 19 locations (using the 30-2 screening protocol) whereas SAP tests 76 locations (30-2 protocol). In addition, the threshold values generated by FDT are measured through a different mechanism than SAP, so the values are not directly comparable. Frequency doubling technology measures threshold values as the contrast sensitivity threshold to counterphase flickering of sine waves,5 whereas SAP determines threshold values as the white-on-white light intensity.11 To simulate the SAP results with FDT, the manufacturer of the device devised a proprietary scaling factor.7
Recently, a new iteration of FDT, called Matrix, became commercially available. It employs the same fundamental testing principle as FDT but utilizes smaller stimuli in a test pattern similar to SAP. The stimulus of Matrix is a 5° square target; the stimulus of SITA size III is a 0.43° round target. The stimuli are evenly distributed 6° apart throughout the testing area for both devices. A recent study by Spry and Johnson12 demonstrated that threshold values obtained using these smaller stimuli were highly and significantly correlated with those found with standard FDT stimuli. Theoretically, Matrix perimetry could be used like FDT perimetry to detect early glaucomatous VF abnormalities with the benefit of having a direct correlation with SAP in terms of testing locations. The purpose of this study was to compare the properties, depth and size of VF defects detected by Matrix to those found using Swedish interactive thresholding algorithm (SITA) perimetry.
Materials and Methods
This cohort study included consecutive glaucoma patients from the University of Pittsburgh Medical Center Eye Center at the Eye and Ear Institute, the Department of Ophthalmology of the University of Pittsburgh School of Medicine. Institutional Review Board/Ethics Committee approval was obtained for the study, and all participants provided informed consent before participating in the study. All methods adhered to the Declaration of Helsinki for research involving human subjects.
Inclusion Criteria
Subjects had to be ≥ 18 years of age, with a best-corrected visual acuity of >20/40, and have a SITA VF defect.
Exclusion Criteria
Patients with a history of intraocular eye diseases (e.g., age-related macular degeneration) or neurologic diseases (e.g., pituitary lesions or demyelinating diseases) that could cause nonglaucomatous field defects were excluded from the study.
All subjects underwent a comprehensive ophthalmologic examination, including medical and family history, visual acuity testing, slit-lamp biomicroscopy, Goldmann applanation tonometry, and dilated fundoscopic examination. All subjects also underwent full-threshold 24-2 Matrix perimetry (Carl Zeiss Meditec, Dublin, CA) and SITA standard 24-2 perimetry (Carl Zeiss Meditec). The order of the 2 tests was alternated between consecutive patients (SITA first and then Matrix, Matrix first and then SITA) and both were completed within 6 months. If both tests were conducted at the same visit, a rest period of ≥ 10 minutes was given between tests. A reliable test was defined as having ≤30% of fixation losses, false-positive, or false-negative responses. Tests were excluded if there was obvious rim artifact in either testing procedure. Visual field defects were defined as clusters of ≥3 adjacent points with P<5% on the pattern deviation plot or ≥2 adjacent points with P<1%. If both eyes were eligible for the study, the eye with more advanced VF abnormality was selected.
The entire cohort is referred to as all comers, and includes patients with a wide range of perimetric abnormalities with and without previous VF testing experience. A subset analysis was performed in patients who had prior experience with SAP to determine the influence of experience on all outcome parameters.
For threshold data analysis purposes, all VF threshold data were transposed for the right eye orientation. Although blind spot probability values are reported by Matrix in the pattern deviation plot, they are eliminated in SITA perimetry. For comparative analysis, the blind spot data were not used. The size of the glaucomatous defects was determined by counting the number of abnormal points in the pattern deviation plot that fit the criteria listed. The depth of the defect was assessed by averaging the threshold values of the abnormal points. Congruence of VF defects was defined as ≥ 1 overlapping defective location on both devices with the other 2 defective locations overlapping or adjacent to the locations of the defective points on the other device.
We also compared the commonly used grading system scores between the 2 VF devices: glaucoma hemifield test (GHT), the Advanced Glaucoma Intervention Study (AGIS) severity scale,13 the Collaborative Initial Glaucoma Treatment Study (CIGTS) severity scale,14 and the Hodapp–Parrish–Anderson (HPA) grading scale.15
Statistical Analysis
The data were analyzed using IMP 4.0.4 software (SAS Institute, Gary, NC). Paired t-test was used for comparing continuous measurements as obtained by the 2 devices. Wilcoxon’s nonparametric t-test was used for comparing mean ordinal or nonnormally distributed measurements from both devices. Pearson’s correlation coefficient and linear regression were calculated to assess the relationships between threshold values, MD, and PSD between both devices. Glaucoma hemifield test and HPA categorical scores were compared between the devices using κ analysis. The ordinal numeric data of AGIS and CIGTS grading scores were compared using Kruskal-Wallis rank test. An α level of ≤ 0.05 was considered significant for all tests.
Results
Fifty glaucomatous eyes of 50 patients were included in this study. The patients had a mean age ± standard deviation of 58.8± 12.8 years (range, 23.0–82.8 years). Eighteen men and 32 women were included in the study. Forty-one of the subjects were Caucasian and 9 were African American. Mean interval between Matrix and SITA testing was 31 ±44 days. Twenty-seven subjects had SITA perimetry before Matrix and 23 in the reverse order. All subjects had VF defects on SITA, but 18 of them (36%) did not show any defect on Matrix tests. The overall mean SITA mean deviation (MD) was −4.14±5.29 dB and pattern standard deviation (PSD) was 4.48±3.86 dB (Table 1).
Table 1.
Characteristics of the SITA Field Defect Group
| SITA | Matrix | P* | Pearson’s Correlation Coefficient (P) | |
|---|---|---|---|---|
| Test Duration (sec) | 370.9 ± 100.1 | 319.3 ± 17.3 | 0.0002 | 0.54 (<0.0001) |
| Mean threshold (dB) | 25.91 ± 5.26 | 21.10 ± 5.65 | <0.0001 | 0.81 (<0.0001) |
| MD (dB) | −4.14 ± 5.29 | −5.34 ± 5.42 | 0.03 | 0.76 (<0.0001) |
| PSD (dB) | 4.48 ± 3.86 | 4.57 ± 2.40 | 0.78 | 0.78 (<0.0001) |
SITA = Swedish interactive thresholding algorithm; MD = mean deviation; PSD = pattern standard deviation.
P value for paired t-test comparing SITA and Matrix.
The mean test duration was significantly shorter (P = 0.0002, paired t-test) with Matrix as compared to SITA with a moderate correlation between the devices (r = 0.54, P<0.0001; Table 1). The duration of Matrix testing ranged from 297 to 389 seconds; for SITA, the range was 250 to 661 seconds.
Figure 1 demonstrates the overall threshold values as reported by both devices. Although both devices provide similar distribution of the threshold values, Matrix “utilized” only part of the values within the range. For each individual testing point throughout the VF, Matrix generally reported lower values than SITA and the magnitude of difference between the devices was similar at most points (Fig 2). However, at the blind spot, SITA values dipped much lower than Matrix values. The overall mean threshold level was significantly lower for Matrix than for SITA with a high correlation between the measurements (Table 1). Dividing the threshold values into centile subsets (0–9 dB, 10–19 dB, 20–29 dB, ≥ 30 dB) according to the SITA results, for the first centile SITA values were smaller than Matrix values by 7.47 dB (P<0.0001, paired t-test); for the other subsets, SITA readings were larger by 3.09 dB, 5.77 dB, and 6.17 dB, respectively (each P<0.0001).
Figure 1.
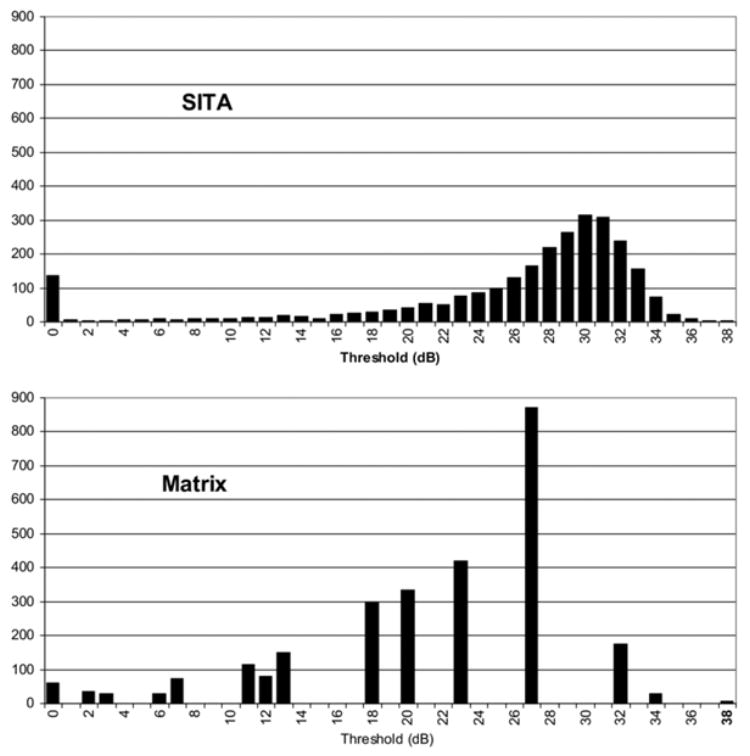
Distribution of threshold values obtained by Swedish interactive thresholding algorithm (SITA) and Matrix. dB = decibels.
Figure 2.
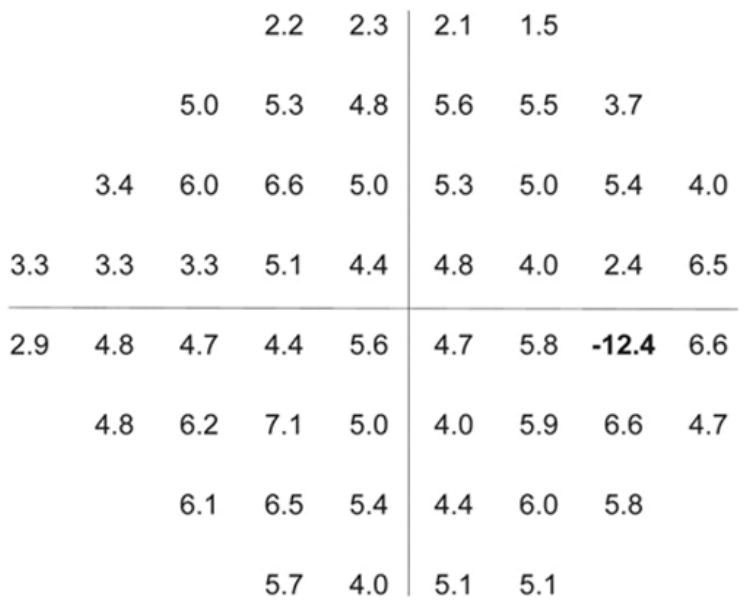
Difference in mean threshold (decibels) at each testing point between Swedish interactive thresholding algorithm (SITA) and Matrix. At the blind spot, Matrix showed higher values than SITA.
The overall number of points classified as abnormal by the pattern deviation plot is summarized in Table 2. The total number of abnormal points was significantly higher for SITA (P = 0.001, Wilcoxon’s test), mainly due to a higher number of early and intermediate abnormality points (P<5%, 2%, and 1%) in SITA as compared with Matrix. The mean size of the VF defect in SITA was significantly larger than Matrix (P = 0.005, paired t-test; Fig 3) and the mean depth was significantly shallower with SITA than Matrix (P<0.001, paired t-test; Fig 4). In the 32 eyes that had VF defects with both devices, the location of the defect was congruent in 30 eyes (94%).
Table 2.
Number of Points, Defect Size, and Depth on the Pattern Deviation Plot for the Swedish Interactive Thresholding Algorithm (SITA)-Defined Visual Field Defect Group
| SITA | Matrix | P | |
|---|---|---|---|
| Number of normal Test Locations | 1855 (71.3%) | 2017 (77.6%) | 0.06* |
| Number of abnormal test locations | 745 (28.7%) | 583 (22.4%) | 0.001* |
| P<5% | 216 (8.3%) | 170 (6.5%) | 0.03* |
| P<2% | 106 (4.1%) | 68 (2.6%) | 0.003* |
| P<1% | 108 (4.2%) | 50 (1.9%) | 0.0005* |
| P<0.5% | 315 (12.1%) | 295 (11.4%) | 0.63* |
| Mean defect size | 14.9 ± 9.5 | 11.7 ± 9.7 | 0.005† |
| Mean defect depth (dB) | 21.71 ± 6.65 | 14.96 ± 6.04 | <0.001† |
Wilcoxon’s nonparametric t-test.
Paired t-test.
Figure 3.
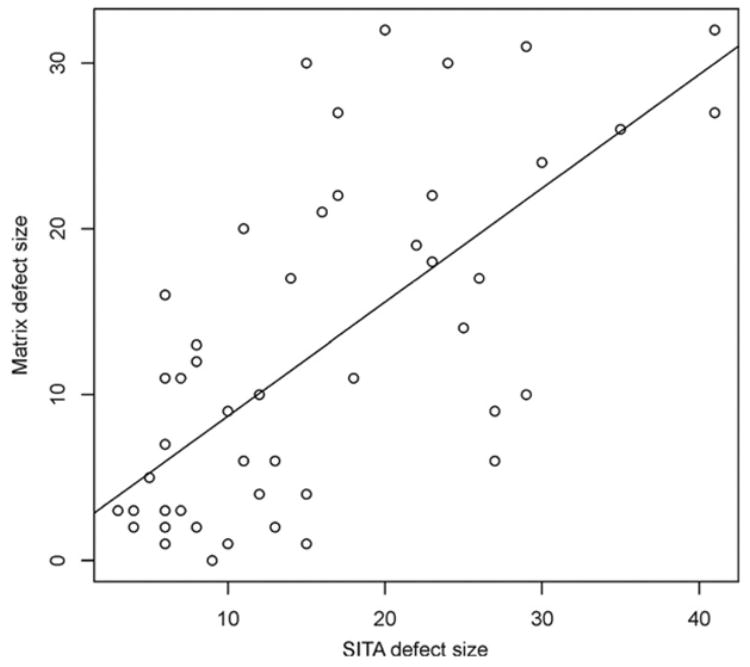
Scatter plot of visual field defect size in Swedish interactive thresholding algorithm (SITA) and Matrix perimetries.
Figure 4.
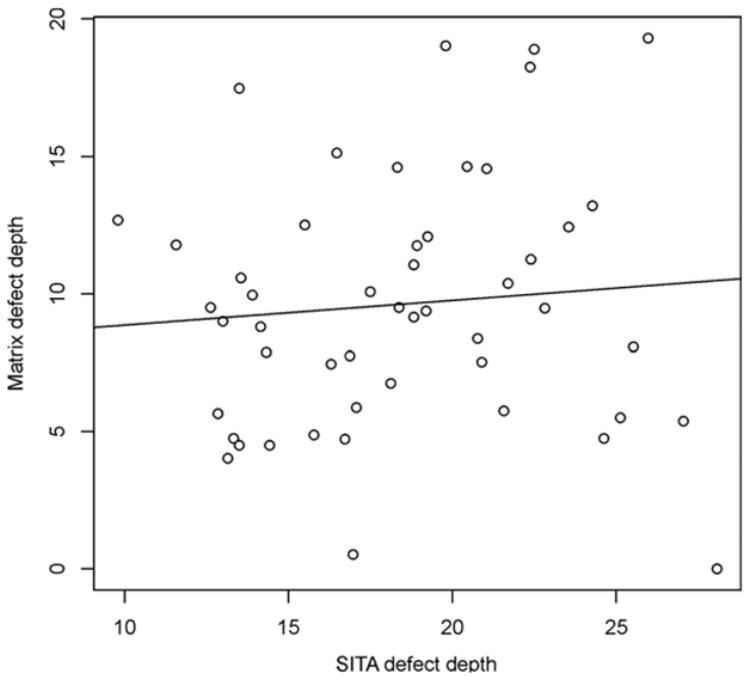
Scatter plot of visual field defect depth in Swedish interactive thresholding algorithm (SITA) and Matrix perimetries (decibels).
Mean deviation was strongly correlated (r = 0.76, P<0.0001, Pearson’s coefficient) between the devices (Fig 5), with significantly lower values for Matrix as compared with SITA, with an average difference of −1.2 dB (P = 0.03, paired t-test; Table 1). Pattern standard deviation also demonstrated a strong correlation (r = 0.78, P<0.0001, Pearson’s coefficient) between the devices (Fig 6). The overall difference in PSD between the devices was not significant (P = 0.78, paired t-test). The number of eyes that were labeled as abnormal by SITA and Matrix MD and PSD probability of P<5% appears in Figure 7.
Figure 5.
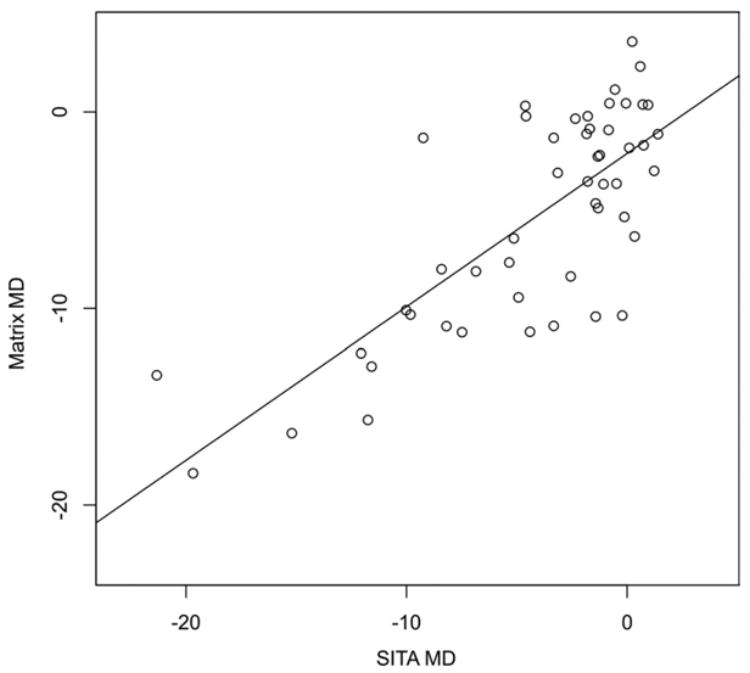
Scatter plot of visual field mean deviation (MD) as obtained by Swedish interactive thresholding algorithm (SITA) and Matrix perimetries (decibels).
Figure 6.
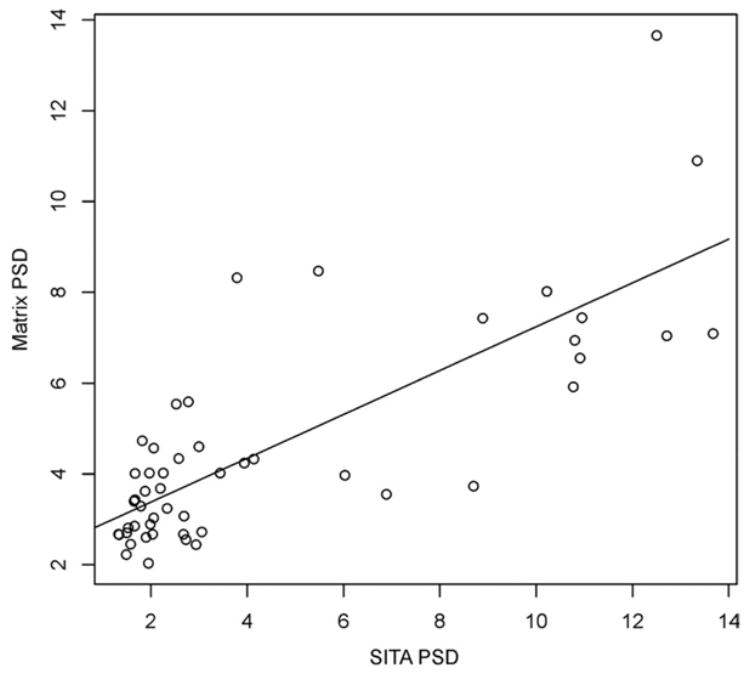
Scatter plot of visual field pattern standard deviation (PSD) as obtained by Swedish interactive thresholding algorithm (SITA) and Matrix perimetries (decibels).
Figure 7.
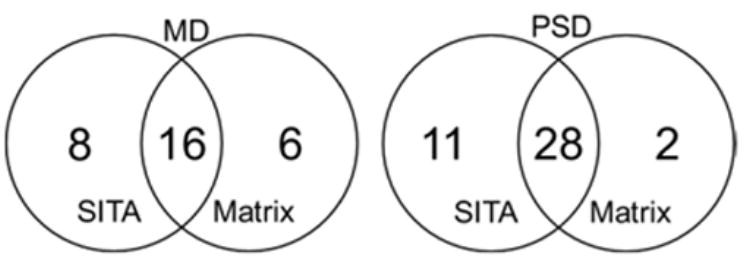
Number of eyes that were classified as abnormal based on SITA and Matrix mean deviation (MD) (left) and pattern standard deviation (PSD) (right) probability of P<5%.
SITA classified fewer eyes as within normal limits by GHT and a greater number of eyes as borderline as compared with Matrix (Table 3). The overall agreement on the GHT classification was poor (κ = 0.23).
Table 3.
Glaucoma Hemifield Test, Swedish Interactive Thresholding Algorithm (SITA), and Matrix Results for Subjects with SITA-Defined Visual Field Defect
| SITA
|
||||
|---|---|---|---|---|
| WNL | Borderline | ONL | Total | |
| Matrix | ||||
| WNL | 7 | 4 | 6 | 17 |
| Borderline | 1 | 1 | 2 | 4 |
| ONL | 5 | 4 | 20 | 29 |
| Total | 13 | 9 | 28 | 50 |
ONL = outside normal limits; WNL = within normal limits.
Overall the agreement between the classifications was poor (κ = 0.23).
Evaluating the commonly used scoring systems, the HPA scoring system showed moderate agreement between the devices (κ = 0.49; Table 4). The median AGIS score for SITA was 0 (range, 0–15), whereas the median in Matrix was 1.5 (range, 0–14; P = 0.006, Kruskal-Wallis rank test). For the CIGTS scoring system, the median value was 1.39 (range, 0–19.04) for SITA and 1.44 (range, 0–17.40) for Matrix (P = 0.07, Kruskal-Wallis rank test).
Table 4.
Hodapp–Parrish–Anderson Scoring, Swedish Interactive Thresholding Algorithm (SITA), and Matrix Results for Subjects with SITA-Defined Visual Field Defects
| SITA
|
||||
|---|---|---|---|---|
| Early | Moderate | Severe | Total | |
| Matrix | ||||
| Early | 20 | 6 | 0 | 26 |
| Moderate | 4 | 5 | 2 | 11 |
| Severe | 0 | 4 | 9 | 13 |
| Total | 24 | 15 | 11 | 50 |
Overall the agreement between the classifications was moderate (κ = 0.49).
Twenty-four patients had experience with SAP testing. The results in these patients were similar to those reported for the original group. The size of the defects was significantly larger in SITA compared to Matrix (mean numbers of abnormal points were 18.2 and 13.8 points, respectively; P = 0.01, paired t-test). Swedish interactive thresholding algorithm defects (19.38±7.53 dB) were shallower than those of Matrix (13.31±7.04 dB; P<0.0001, Wilcoxon’s test), similar to the finding in the original group. The difference in MD between the devices was 1.5 dB (P = 0.04, paired t-test), although there was no significant difference for PSD (P = 0.18, paired t-test) as reported in the original group. Swedish interactive thresholding algorithm GHT classified more eyes as within normal limits than Matrix and fewer eyes as ONL with a slight improvement in the agreement (κ = 0.39) than what was found in the original group.
Discussion
Numerous studies have demonstrated the utility of FDT perimetry in early detection of glaucoma;4,7–10 however, given the unique FDT test pattern, comparing defects between FDT and SAP is difficult. Humphrey Matrix was devised to enable detailed VF examination and better comparison with SITA with the continued advantages of FDT, namely earlier detection and shorter test duration. Analyzing the outcomes of all comers (subjects with or without previous experience with perimetry) with SITA field defects, we found that Matrix perimetry reported normal fields in 36% of the eyes and thus showed lower sensitivity than SITA. Matrix had lower threshold levels than SITA, and smaller and deeper defects than those reported by SITA. Artes et al16 reported that there was no systematic difference in defect size between Matrix and SITA (P = 0.78) in a small group with previous experience with both testing devices. The lack of statistical significance shown in their study may be due to their small sample size.
As expected, test duration was significantly shorter with Matrix and the variability in Matrix test duration as reflected by the standard deviation is markedly lower than SITA standard (Table 1). This difference reflects the different mode of testing used by the devices. Matrix used the maximum likelihood estimation (ZEST) procedure where each point was tested 4 times in various thresholds according to the patient response.17 Because of the fixed number of tests at each point, the duration of the test was shortened and nearly constant with a narrow standard deviation. The SITA, on the other hand, used multiple stimulations at each point with a gradual increase in the threshold level until the stimulus was observed.
The distribution of threshold values revealed that Matrix used only limited number of values within the testing dynamic range (Fig 1). This feature is inherent to the testing mode employed by Matrix. The dynamic range for threshold values ranged between 0 and 38 dB. For each testing point 4 thresholds are presented and the yes/no response for each stimulus provided a limited number of discrete threshold values within the dynamic range.
The comparison of mean threshold values at each test point (Fig 2) demonstrated that Matrix values were lower than SITA values and differed by a nearly constant amount. It should be noted that although SITA does not report probability values at the blind spot, Matrix perimetry does provide these values because of the large stimulus size. Dividing the threshold values into centiles based on SITA results, it is evident that Matrix reports lower threshold values, and the difference between the devices increases as the threshold values approach normal values. On the other hand, for advanced damage (threshold values 0–9 dB), it is apparent that Matrix values are higher than those reported by SITA. This should be taken into consideration when comparing readings from both devices on an individual testing point scale.
Given that Matrix was designed using the FDT principle, which can detect glaucoma at an earlier stage than SAP, it was expected that there might be more defects found on Matrix than SITA VFs; however, SITA demonstrated significantly more abnormal points on the pattern deviation plot. In addition, a substantial number of eyes with SITA field defects showed no defects on Matrix (36%). Comparing between devices (only eyes with VF defect with both devices), the location of VF defects was congruent in all but 2 of these eyes.
These findings might be explained by the larger stimulus used by Matrix as compared to SITA. Marginal locations of the field defects might be perceived as normal when stimuli are larger, whereas smaller stimuli are more likely to be confined to the region of abnormality. Smaller stimuli might be expected to detect the border between the affected and nonaffected areas more precisely. Other possible explanations for these findings include suboptimal use of the normative database by Matrix or that FDT is not suitable to detect early VF defects before their appearance in SITA. Alternatively, it might be that SITA showed a high number of false-positive responses and Matrix results were closer to reality. It should be also remembered that the devices test different physical properties of the visual system and thus might identify different subpopulations.
Another component that should be assessed to determine the utility of these devices for following patients is the test–retest variability, which was beyond the scope of our study. Artes et al16 reported a near constant test–retest range along the entire measurement range for Matrix, whereas in SITA the range was wider for lower threshold values and smaller for near normal values.
In terms of global indices, our data revealed that the Matrix MD results were significantly lower than those of SITA (Table 1, Fig 5). However, using the probability data, 18 of the 28 eyes (64.3%) that were labeled as abnormal by SITA MD were also labeled as abnormal by Matrix. For PSD, there was no significant difference between Matrix and SITA VFs (Table 1, Fig 6). For comparison between VFs that were obtained by both SITA and Matrix, PSD is the global index that might be useful, because there was no significant difference between the devices for this parameter. The GHT results demonstrate that Matrix is more likely to classify a test as either within normal limits or ONL, whereas SITA is more likely to classify such a test as borderline (Table 3).
Assessing the performance of various grading systems, we found that these scoring systems (HPA, AGIS, CIGTS) yield different results when applied to the 2 different field tests.
The results of the analysis for all comers with SITA field defects were nearly identical to those found for subjects with previous experience with perimetry, and thus reduce the likelihood that the study findings are influenced by the level of test experience.
It should be noted that although both devices use dB units to measure the threshold levels, the physical properties that they represent are substantially different. Caution should therefore be used when considering Matrix as a replacement for SITA.
In summary, contrary to what was expected based on the previous studies with FDT, The Matrix examination did not detect 36% of abnormal SITA fields. Matrix delineated smaller and deeper defects than those shown by SITA. It is possible that this finding was secondary to the larger size of the Matrix stimulus or because of less than optimal performance of the normative database. Further studies would help to elucidate these issues.
Acknowledgments
Supported in part by the National Institutes of Health, Bethesda, Maryland (grant nos.: RO1-EY013178-5, P30-EY008098); the Eye and Ear Foundation, Pittsburgh, Pennsylvania; and an unrestricted grant from Research to Prevent Blindness, Inc., New York, New York.
Footnotes
Presented at: Association of Research in Vision and Ophthalmology annual meeting, April 2004, Fort Lauderdale, Florida, and International Glaucoma Symposium, February 2005, Cape Town, South Africa.
References
- 1.Quigley HA, Addicks EM, Green WR. Optic nerve damage in human glaucoma. III. Quantitative correlation of nerve fiber loss and visual field defect in glaucoma, ischemic neuropathy, papilledema, and toxic neuropathy. Arch Ophthalmol. 1982;100:135–46. doi: 10.1001/archopht.1982.01030030137016. [DOI] [PubMed] [Google Scholar]
- 2.Quigley HA, Dunkelberger GR, Green WR. Retinal ganglion cell atrophy correlated with automated perimetry in human eyes with glaucoma. Am J Ophthalmol. 1989;107:453–64. doi: 10.1016/0002-9394(89)90488-1. [DOI] [PubMed] [Google Scholar]
- 3.Kerrigan-Baumrind LA, Quigley HA, Pease ME, et al. Number of ganglion cells in glaucoma eyes compared with threshold visual field tests in the same persons. Invest Ophthalmol Vis Sci. 2000;41:741–8. [PubMed] [Google Scholar]
- 4.Medeiros FA, Sample PA, Weinreb RN. Frequency doubling technology perimetry abnormalities as predictors of glaucomatous visual field loss. Am J Ophthalmol. 2004;137:863–71. doi: 10.1016/j.ajo.2003.12.009. [DOI] [PubMed] [Google Scholar]
- 5.Kelly DH. Nonlinear visual responses to flickering sinusoidal gratings. J Opt Soc Am. 1981;71:1051–5. doi: 10.1364/josa.71.001051. [DOI] [PubMed] [Google Scholar]
- 6.Quigley HA, Sanchez RM, Dunkelberger GR, et al. Chronic glaucoma selectively damages large optic nerve fibers. Invest Ophthalmol Vis Sci. 1987;28:913–20. [PubMed] [Google Scholar]
- 7.Burnstein Y, Ellish NJ, Magbalon M, Higginbotham EJ. Comparison of frequency doubling perimetry with Humphrey visual field analysis in a glaucoma practice. Am J Ophthalmol. 2000;129:328–33. doi: 10.1016/s0002-9394(99)00364-5. [DOI] [PubMed] [Google Scholar]
- 8.Cello KE, Nelson-Quigg JM, Johnson CA. Frequency doubling technology perimetry for detection of glaucomatous visual field loss. Am J Ophthalmol. 2000;129:314–22. doi: 10.1016/s0002-9394(99)00414-6. [DOI] [PubMed] [Google Scholar]
- 9.Johnson CA, Samuels SJ. Screening for glaucomatous visual field loss with frequency-doubling perimetry. Invest Ophthalmol Vis Sci. 1997;38:413–25. [PubMed] [Google Scholar]
- 10.Bayer AU, Erb C. Short wavelength automated perimetry, frequency doubling technology perimetry, and pattern electroretinography for prediction of progressive glaucomatous standard visual field defects. Ophthalmology. 2002;109:1009–17. doi: 10.1016/s0161-6420(02)01015-1. [DOI] [PubMed] [Google Scholar]
- 11.Anderson DR. Standard perimetry. Ophthalmol Clin North Am. 2003;16:205–12. vi. doi: 10.1016/s0896-1549(03)00005-1. [DOI] [PubMed] [Google Scholar]
- 12.Spry PG, Johnson CA. Within-test variability of frequency-doubling perimetry using a 24-2 test pattern. J Glaucoma. 2002;11:315–20. doi: 10.1097/00061198-200208000-00007. [DOI] [PubMed] [Google Scholar]
- 13.Advanced Glaucoma Intervention Study. 2 Visual field test scoring and reliability. Ophthalmology. 1994;101:1445–55. [PubMed] [Google Scholar]
- 14.Musch DC, Lichter PR, Guire KE, et al. The Collaborative Initial Glaucoma Treatment Study: study design, methods, and baseline characteristics of enrolled patients. Ophthalmology. 1999;106:653–62. doi: 10.1016/s0161-6420(99)90147-1. [DOI] [PubMed] [Google Scholar]
- 15.Hodapp E, Parrish RK, II, Anderson DR. Clinical Decisions in Glaucoma. St. Louis: Mosby-Year Book; 1993. pp. 11–63. [Google Scholar]
- 16.Artes PH, Hutchinson DM, Nicolela MT, et al. Threshold and variability properties of Matrix frequency-doubling technology and standard automated perimetry in glaucoma. Invest Ophthalmol Vis Sci. 2005;46:2451–7. doi: 10.1167/iovs.05-0135. [DOI] [PubMed] [Google Scholar]
- 17.Turpin A, McKendrick AM, Johnson CA, Vingrys AJ. Development of efficient threshold strategies for frequency doubling technology perimetry using computer simulation. Invest Ophthalmol Vis Sci. 2002;43:322–31. [PubMed] [Google Scholar]


