Abstract
The problem of functional annotation based on homology modeling is primary to current bioinformatics research. Researchers have noted regularities in sequence, structure and even chromosome organization that allow valid functional cross-annotation. However, these methods provide a lot of false negatives due to limited specificity inherent in the system. We want to create an evolutionarily inspired organization of data that would approach the issue of structure-function correlation from a new, probabilistic perspective. Such organization has possible applications in phylogeny, modeling of functional evolution and structural determination. ELISA (Evolutionary Lineage Inferred from Structural Analysis, http://romi.bu.edu/elisa) is an online database that combines functional annotation with structure and sequence homology modeling to place proteins into sequence-structure-function "neighborhoods". The atomic unit of the database is a set of sequences and structural templates that those sequences encode. A graph that is built from the structural comparison of these templates is called PDUG (protein domain universe graph). We introduce a method of functional inference through a probabilistic calculation done on an arbitrary set of PDUG nodes. Further, all PDUG structures are mapped onto all fully sequenced proteomes allowing an easy interface for evolutionary analysis and research into comparative proteomics. ELISA is the first database with applicability to evolutionary structural genomics explicitly in mind.
Availability: The database is available at http://romi.bu.edu/elisa.
Keywords: Database, Bioinformatics, Functional Annotations, Structure Determination
Background
Structural genomics [1] is a science in its infancy. The main task of structural genomics is to combine available data on genes and gene products such as structure, sequence, function and chromosomal proximity [2,3] in a meaningful way so as to procure biological insight [4-10]. These patterns can later be used to characterize newly sequenced or crystallized proteins or even complexes. Primarily the insight from structural genomics comes from the observation that similar sequences and structures yield similar functions. For example, recently the structural analysis of inositol monophosphate (IMPase) from M. janaschii showed an addition of "new" function to a protein with "known" function. [11] In this case, a protein that was thought to act as only an FBPase (1,6-fructobiphosphatase) was also implicated as an IMPase via homology modeling. In light of cases like these we have decided to build a database that maximizes the specificity of functional annotation, albeit at an expense of its sensitivity.
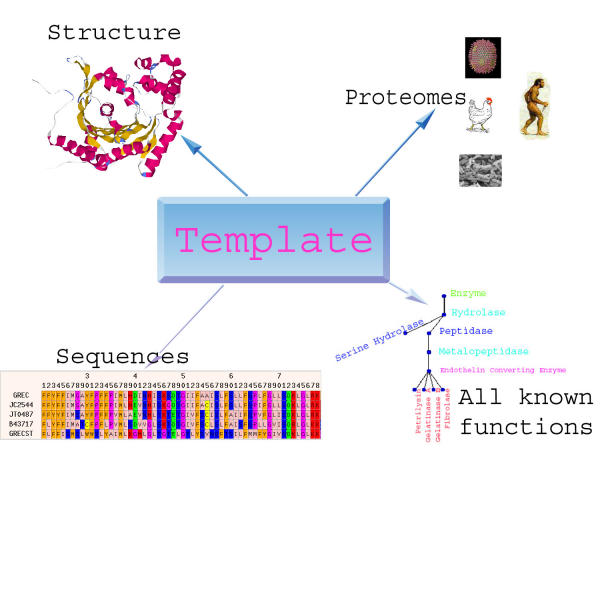
Evolutionary models provide a means for organization of the diverse glut of experimental data that has become the cornerstone of bioinformatics research. Seeking evolutionary justification for organization of data has been adopted by many databases [12,13,5] where relationships, and sometimes tools used in determining them are justified by some evolutionary model. In the case of structural genomics, domains can be functionally independent, can be expressed outside larger protein complexes in genomes and are often rearranged through alternative splicing. Thus we can infer that domains serve as a good evolutionary unit subject to structure-function pressures and choose to work with annotations and comparisons of domains instead of whole proteins. We also consider all the sequences that fold into that domain as instances of those structures in different genomes as orthologs and in the same genome as paralogs. (Fig. 1)
Figure 1.
The basic data-type of ELISA. The template is created from a characteristic three-dimensional structure of a domain and all sequences that fold into this domain. All sequences from the domain are mined for functional annotation, and this functional annotation is used to build a "consensus tree". This consensus tree represents all possible functions of the collection of sequences that fold into a structure. The multiple sequence alignment is also used in finding close homologous sequences in all fully sequenced proteomes.
Efforts to annotate function based on structure and sequence homology alone are complicated and more often than not lead to mis-annotations [14,15] This is partly due to the fact that different sequences can fold into similar structures but have different functions [16-19] This creates the problem of similar structures performing many, sometimes different functions. A notable example of functional diversity inside a structurally homologous family is the case of the P-loop NTPases. For example, the structures of RecA (2reb) [20] and adenylate kinase (2ak3) [21] proteins are similar. Both are alpha and beta proteins. Both contain P-loop topology. Both are placed in the same SCOP family. Yet, their functions are quite distinct. RecA is a DNA repair protein, while the adenylate kinase is a transfer protein facilitating the transfer of phosphate groups between AMP and ADP. Because of these difficulties and because of possible insights gained from annotating from all homologs, not just the closest ones, ELISA addresses the issue of functional annotation as one of probabilistic analysis where the putative function is one of many accessible upon sequence mutation of a gene. The justification for this is evidenced further by directed evolution studies that enable the derivation of new function from homologous sequence [19,22] e.g. the alternate must also be true: homologous sequences may have different functions.
Construction and Content
ELISA was built using four types of data: sequence, structure, function and genomic representation (Fig. 1). Structural templates were mined from SCOP [12] and FSSP[9,23]. The sequence data was taken from Swiss-Prot [8]. The alignments of Swiss-Prot sequences to templates were done using iterative homology searches [4,24], secondary structure prediction [25] and HSSP [7] methods. These alignments with sequences that are more than 25% homologous to each other and to the sequence of the template constitute a node on PDUG (Fig. 1).
The connections between the nodes which represent structural comparison were done using the DALI structure comparison engine [9,10]. The nodes were also mapped onto all publicly available proteomes from the NCBI web-site using PSI-BLAST [4]. This yields information on all structures in the proteomes that are PDUG subgraphs. The functional annotation of nodes was done through reconstruction of a single tree for all aligned Swiss-Prot sequences in the node. (Fig. 1,4) This yields comprehensive information on all possible functions for that structural template.
Figure 4.
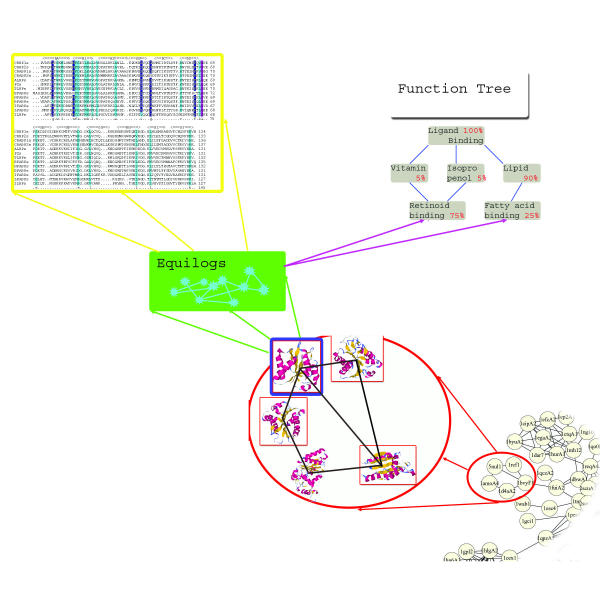
Organisation of ELISA. Elisa is divided into two levels. On the first level, a user needs to define a domain on the PDUG with the closest homology (blue square). This step can be done either through sequence homology, structure, function or taxonomic representation. For example, in the sequence query the closest homologue or set of homologues is identified. After a single domain of interest is placed, all information about the sequence, structure and function of that node is available. The next level asks to define a complex query that delineates all neighbors of the domain in question thus delineating the SSF neighborhood. For example, if we consider the node with a blue square, all the nodes with red squares constitute its structural neighbors at some similarity cutoff. The constraints on delineating the neighborhoods may include structure, function or taxonomic representation characteristics. ELISA then calculates consensus functional, structural and taxonomic trees for the whole SSF neighborhood defined in the previous step (not shown on picture).
The core of ELISA is a relational database system powered by MySQL. http://www.mysql.org This database stores information on all PDUG nodes, their characteristics and connections to other nodes of PDUG. Each domain (node) has structure, sequence and taxonomic data recorded, as well as SCOP fold name and PDUG cluster information. It also includes structure comparison and sequence comparison data to other nodes on PDUG.
Utility
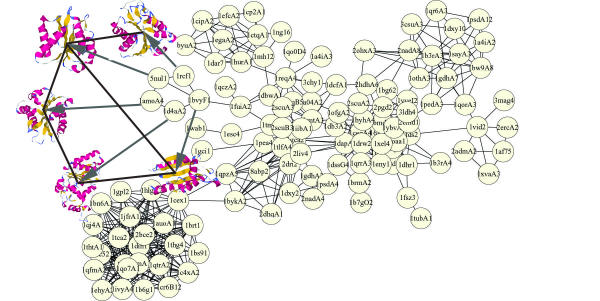
We provide a dynamic web interface for the underlying relational database. The query is divided into two levels. The final result is an SSF neighborhood with a combined functional fingerprint[26], SCOP tree and a table describing the phylogeny of the cluster. The purpose of the first level is to choose the closest matching sequence neighborhood via queries of sequence homology, fold type or function. The user can type in the sequence and find the putative structures via sequence comparison. The other query options include finding all domains with a certain fold, function or those that occur in some organism. This query is designed to "anchor" on the PDUG graph (Fig. 2) and find a recently diverged set of sequences that most closely match the query. Even though this is a set of very recently diverged sequences a functional fingerprint is still supplied in the form of a GO tree. The second level is designed to delineate the limits of evolutionary divergence for the sequence, structure and function. For example, setting the structural similarity parameter to 9 finds all structures similar to the "anchor" found on the previous level on the PDUG graph with Z-score of 9 or more. Similarly checking off a certain function finds all the structures that share that function with the "anchor".
Figure 2.
Protein Domain Universe Graph (PDUG). Nodes are structural templates and edges are 3-d comparisons of these templates. A large cluster of TIM barrel domains is shown here. Edges are unweighted in the picture because this cluster was computed by taking only those structures that are similar to each other by more than Zc = 9.
ELISA enables researches to perform evolutionarily inspired queries, such as a search for possibly orthologous proteins between proteomes. For example, we were able to use ELISA to discover a very interesting possible adaptation between thermophiles and mesophiles. During metabolism of arginine and proline, the cell has to convert ornithine to putrescine [27]. Ornithine decarboxylase [28,29] (ODX), the enzyme responsible for this reaction, exists in two forms: one [28] used by the earlier diverged thermophiles A. aeolicus and T. maritama and another [29] used by the mesophillic eubacteria. Strikingly, T. tengcongenesis adapts by removing this enzyme altogether and instead utilizes a promiscuous enzyme ornithine carbomyltransferase [30], with a fold [31] that is structurally similar (in the same structural neighborhood) to the mesophillic ODX Z= 4.1 to catalyze the ornithine to putrscine reaction. Presumably, this example shows both the adaptation to the relaxation of thermal pressure as well as to its reinstitution. In both cases, the organism adapts at least in part by optimizing designability of the protein fold responsible for ornithine decarboxylation.
Discussion
The organization and search engine of ELISA is created with the explicit purpose of aiding the emerging field of structural genomics. Recent research has revealed that in functional annotation by homology modeling the closest homologue may lead to misannotation. This is due to the extreme complexity of biological systems and the inherent redundancy in the structure-function relationship. This means that it is almost impossible to find the single best putative function for any protein or gene sequence by homology methods alone. Instead, the most that we can do is limit the number of possible functions that this sequence could perform. The reason why we can limit the number of functions is because functional fingerprints of structural neighborhoods do not overlap.
The idea of functional fingerprints can be extended further. If the initial homology is poor, the stringency of the thresholds can be relaxed to encompass a larger divergence time. We may consider not only the sequence homologues but also the structurally neighboring gene families when considering possible functions of a particular gene. ELISA allows the user to define a sequence-structure-function neighborhood by limiting the possible structures and functions as well as genomes where the protein is likely to be found. Through this "limitation of divergence" of the set, the researcher can find out the prevailing trends in the evolution of the domain as well as calculate the functional, structural and taxonomic determinants of an almost arbitrary set of homologous genes and gene families.
Conclusions
We organize available biological data hierarchically into structural templates, sequences that fold into these templates and then clusters of templates Fig. 1. In this way, we have organized PDUG into sequence-structure-function (SSF) "neighborhoods". Each node, a sequence neighborhood, on PDUG represents a gene family of homologous sequences that have been aligned using BLAST (Fig. 1) [32] and show more than 25 percent sequence identity to each other. Representative three-dimensional structures are compared to each other using DALI and clustered into structural "neighborhoods" (Fig. 2) These structural neighborhoods are distantly related gene families, or alternatively the variability available to a gene given a long period of mutation.
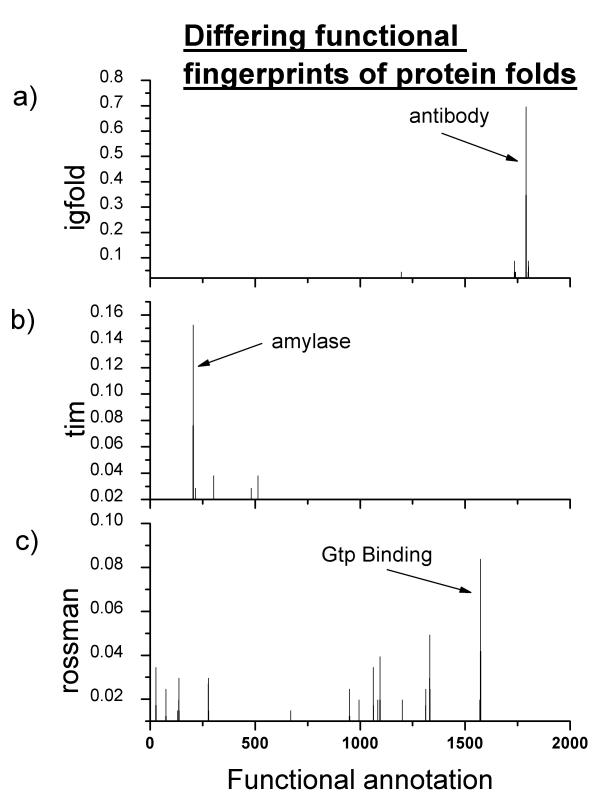
We have recently found that these structural neighborhoods have unique and non-overlapping sets of functional annotations. [26] (Fig. 3) These sets can be thought of as probabilistic distributions of functions i.e. if there is a novel member of that neighborhood its probability of being a certain function is distributed as the functional fingerprint. The use of functional fingerprints essentially limits the number of possible functional annotations for a particular structure from several thousand possibilities to several dozen. Three examples of functional fingerprints for three clusters of proteins sharing the same fold are shown in (Fig 3). Functional annotation through fingerprinting maximizes the probability that the correct function is part of the functional fingerprint albeit at the expense of an increase in the total number of possibilities.
Figure 3.
Examples of different functional fingerprints for structurally similar protein clusters. The X axis signifies the functional annotation and the Y axis is the percentage of proteins in that group that are annotated as such. A) Functional fingerprint for protein cluster that includes Igfold proteins. B) Functional fingerprint for protein cluster that includes Tim fold proteins C) Functional fingerprint for protein cluster that includes Rossman fold proteins. Importantly, the functional fingerprints have a small subset of dominating functions that do not significantly overlap with other clusters of structurally related proteins.
While the analysis and result mentioned above has been described before elsewhere[26], we mention it here to emphasize the utility of our database and the kind of research that can be done using the tools. ELISA builds on the approach of the previous work and includes information about organismal PDUG subgraphs, SCOP annotations and ability for functional comparison among others for greater flexibility in queries and research. ELISA enables us to create functional fingerprints for an arbitrary set of homologous sequences, not just sequences sharing a single fold (Fig 4). The purpose of representing putative functions through functional fingerprints is to maximize the probability that the functional annotation contains the correct function i.e. the function of the protein can be one of many, pertaining to this structure, or its structural homologues. This organization of data is vastly different, and shows different results upon implementation than other domain repositories such as SMART [33], Pfam [5] and CDD [34]. For example, our probabilistic approach of functional annotation allows for weighted implication in a set of possible functions for a new sequence, not just the function belonging to the closest homologue. If the sequence homology is poor, structural comparison may yield additional data on functional information of the query. The most interesting and unique feature of ELISA is that it enables exploration at quantitatively user-defined levels of various different characteristic evolutionary divergence distances such as structure, function and even taxonomy.
Availability
The database is available at http://romi.bu.edu/elisa.
Author's Contributions
BES designed the database and contributed to its development, JMH did a lot of programming for the database and contributed to the development, SC and DL helped with the implementation, CD and ES provided thoughtful insights and helped in testing.
Acknowledgments
Acknowledgements
We are grateful to the authors of DALI and HSSP for creating an invaluable resource. We thank Robert Berwick and Simon Kasif for helpful discussions. We also thank Joe Mellor for technical help and insightful reading.
Contributor Information
Boris E Shakhnovich, Email: borya@bu.edu.
John M Harvey, Email: max10@bu.edu.
Steve Comeau, Email: scomeau@bu.edu.
David Lorenz, Email: dlorenz@bu.edu.
Charles DeLisi, Email: delisi@bu.edu.
Eugene Shakhnovich, Email: eugene@belok.harvard.edu.
References
- Baker D, Sali A. Protein structure prediction and structural genomics. Science. 2001;294:93–96. doi: 10.1126/science.1065659. [DOI] [PubMed] [Google Scholar]
- Yanai I, Mellor JC, DeLisi C. Identifying functional links between genes using conserved chromosomal proximity. Trends Genet. 2002;18:176–179. doi: 10.1016/S0168-9525(01)02621-X. [DOI] [PubMed] [Google Scholar]
- Mellor JC, Yanai I, Clodfelter KH, Mintseris J, DeLisi C. Predictome: a database of putative functional links between proteins. Nucleic Acids Res. 2002;30:306–309. doi: 10.1093/nar/30.1.306. [DOI] [PMC free article] [PubMed] [Google Scholar]
- Altschul SF, Madden TL, Schaffer AA, Zhang J, Zhang Z, Miller W, Lipman DJ. Gapped BLAST and PSI-BLAST: a new generation of protein database search programs. Nucleic Acids Res. 1997;25:3389–3402. doi: 10.1093/nar/25.17.3389. [DOI] [PMC free article] [PubMed] [Google Scholar]
- Bateman A, Birney E, Cerruti L, Durbin R, Etwiller L, Eddy SR, Griffiths-Jones S, Howe KL, Marshall M, Sonnhammer EL. The Pfam protein families database. Nucleic Acids Res. 2002;30:276–280. doi: 10.1093/nar/30.1.276. [DOI] [PMC free article] [PubMed] [Google Scholar]
- Dengler U, Siddiqui AS, Barton GJ. Protein structural domains: analysis of the 3Dee domains database. Proteins. 2001;42:332–344. doi: 10.1002/1097-0134(20010215)42:3<332::AID-PROT40>3.3.CO;2-J. [DOI] [PubMed] [Google Scholar]
- Dodge C, Schneider R, Sander C. The HSSP database of protein structure-sequence alignments and family profiles. Nucleic Acids Res. 1998;26:313–315. doi: 10.1093/nar/26.1.313. [DOI] [PMC free article] [PubMed] [Google Scholar]
- Gasteiger E, Jung E, Bairoch A. SWISS-PROT: connecting biomolecular knowledge via a protein database. Curr Issues Mol Biol. 2001;3:47–55. [PubMed] [Google Scholar]
- Holm L, Sander C. Dali/FSSP classification of three-dimensional protein folds. Nucleic Acids Res. 1997;25:231–234. doi: 10.1093/nar/25.1.231. [DOI] [PMC free article] [PubMed] [Google Scholar]
- Holm L, Sander C. Dali: a network tool for protein structure comparison. Trends Biochem Sci. 1995;20:478–480. doi: 10.1016/S0968-0004(00)89105-7. [DOI] [PubMed] [Google Scholar]
- Stec B, Yang H, Johnson KA, Chen L, Roberts MF. MJ0109 is an enzyme that is both an inositol monophosphatase and the 'missing' archaeal fructose-1,6-bisphosphatase. Nat Struct Biol. 2000;7:1046–1050. doi: 10.1038/80968. [DOI] [PubMed] [Google Scholar]
- Lo Conte L, Brenner SE, Hubbard TJ, Chothia C, Murzin AG. SCOP database in 2002: refinements accommodate structural genomics. Nucleic Acids Res. 2002;30:264–267. doi: 10.1093/nar/30.1.264. [DOI] [PMC free article] [PubMed] [Google Scholar]
- Teichmann SA, Murzin AG, Chothia C. Determination of protein function, evolution and interactions by structural genomics. Curr Opin Struct Biol. 2001;11:354–363. doi: 10.1016/S0959-440X(00)00215-3. [DOI] [PubMed] [Google Scholar]
- Bork P, Koonin EV. Predicting functions from protein sequences--where are the bottlenecks? Nat Genet. 1998;18:313–318. doi: 10.1038/ng0498-313. [DOI] [PubMed] [Google Scholar]
- Hegyi H, Gerstein M. The relationship between protein structure and function: a comprehensive survey with application to the yeast genome. J Mol Biol. 1999;288:147–164. doi: 10.1006/jmbi.1999.2661. [DOI] [PubMed] [Google Scholar]
- Murzin AG, Brenner SE, Hubbard T, Chothia C. SCOP: a structural classification of proteins database for the investigation of sequences and structures. J Mol Biol. 1995;247:536–540. doi: 10.1006/jmbi.1995.0159. [DOI] [PubMed] [Google Scholar]
- Wise E, Yew WS, Babbitt PC, Gerlt JA, Rayment I. Homologous (beta/alpha)8-barrel enzymes that catalyze unrelated reactions: orotidine 5'-monophosphate decarboxylase and 3-keto-L-gulonate 6-phosphate decarboxylase. Biochemistry. 2002;41:3861–3869. doi: 10.1021/bi012174e. [DOI] [PubMed] [Google Scholar]
- Nagano N, Orengo CA, Thornton JM. One fold with many functions: the evolutionary relationships between TIM barrel families based on their sequences, structures and functions. J Mol Biol. 2002;321:741–765. doi: 10.1016/S0022-2836(02)00649-6. [DOI] [PubMed] [Google Scholar]
- Jurgens C, Strom A, Wegener D, Hettwer S, Wilmanns M, Sterner R. Directed evolution of a (beta alpha)8-barrel enzyme to catalyze related reactions in two different metabolic pathways. Proc Natl Acad Sci U S A. 2000;97:9925–9930. doi: 10.1073/pnas.160255397. [DOI] [PMC free article] [PubMed] [Google Scholar]
- Story RM, Weber IT, Steitz TA. The structure of the E. coli recA protein monomer and polymer. Nature. 1992;355:318–325. doi: 10.1038/355318a0. [DOI] [PubMed] [Google Scholar]
- Diederichs K, Schulz GE. The refined structure of the complex between adenylate kinase from beef heart mitochondrial matrix and its substrate AMP at 1.85 A resolution. J Mol Biol. 1991;217:541–549. doi: 10.1016/0022-2836(91)90756-v. [DOI] [PubMed] [Google Scholar]
- Altamirano MM, Blackburn JM, Aguayo C, Fersht AR. Directed evolution of new catalytic activity using the alpha/beta-barrel scaffold. Nature. 2000;403:617–622. doi: 10.1038/35001001. [DOI] [PubMed] [Google Scholar]
- Holm L, Sander C. Touring protein fold space with Dali/FSSP. Nucleic Acids Res. 1998;26:316–319. doi: 10.1093/nar/26.1.316. [DOI] [PMC free article] [PubMed] [Google Scholar]
- Aravind L, Koonin EV. Gleaning non-trivial structural, functional and evolutionary information about proteins by iterative database searches. J Mol Biol. 1999;287:1023–1040. doi: 10.1006/jmbi.1999.2653. [DOI] [PubMed] [Google Scholar]
- Stuber K. Nucleic acid secondary structure prediction and display. Nucleic Acids Res. 1986;14:317–326. doi: 10.1093/nar/14.1.317. [DOI] [PMC free article] [PubMed] [Google Scholar]
- Shakhnovich BE, Dokholyan NV, DeLisi C, Shakhnovich EI. Functional fingerprints of folds: evidence for correlated structure-function evolution. J Mol Biol. 2003;326:1–9. doi: 10.1016/S0022-2836(02)01362-1. [DOI] [PubMed] [Google Scholar]
- Cataldi AA, Algranati ID. Polyamines and regulation of ornithine biosynthesis in Escherichia coli. J Bacteriol. 1989;171:1998–2002. doi: 10.1128/jb.171.4.1998-2002.1989. [DOI] [PMC free article] [PubMed] [Google Scholar]
- Kern AD, Oliveira MA, Coffino P, Hackert ML. Structure of mammalian ornithine decarboxylase at 1.6 A resolution: stereochemical implications of PLP-dependent amino acid decarboxylases. Structure Fold Des. 1999;7:567–581. doi: 10.1016/S0969-2126(99)80073-2. [DOI] [PubMed] [Google Scholar]
- Momany C, Ernst S, Ghosh R, Chang NL, Hackert ML. Crystallographic structure of a PLP-dependent ornithine decarboxylase from Lactobacillus 30a to 3.0 A resolution. J Mol Biol. 1995;252:643–655. doi: 10.1006/jmbi.1995.0526. [DOI] [PubMed] [Google Scholar]
- Lipscomb WN. Aspartate transcarbamylase from Escherichia coli: activity and regulation. Adv Enzymol Relat Areas Mol Biol. 1994;68:67–151. doi: 10.1002/9780470123140.ch3. [DOI] [PubMed] [Google Scholar]
- Beernink PT, Endrizzi JA, Alber T, Schachman HK. Assessment of the allosteric mechanism of aspartate transcarbamoylase based on the crystalline structure of the unregulated catalytic subunit. Proc Natl Acad Sci U S A. 1999;96:5388–5393. doi: 10.1073/pnas.96.10.5388. [DOI] [PMC free article] [PubMed] [Google Scholar]
- Holm L, Sander C. Protein folds and families: sequence and structure alignments. Nucleic Acids Res. 1999;27:244–247. doi: 10.1093/nar/27.1.244. [DOI] [PMC free article] [PubMed] [Google Scholar]
- Schultz J, Copley RR, Doerks T, Ponting CP, Bork P. SMART: a web-based tool for the study of genetically mobile domains. Nucleic Acids Res. 2000;28:231–234. doi: 10.1093/nar/28.1.231. [DOI] [PMC free article] [PubMed] [Google Scholar]
- Marchler-Bauer A, Panchenko AR, Shoemaker BA, Thiessen PA, Geer LY, Bryant SH. CDD: a database of conserved domain alignments with links to domain three-dimensional structure. Nucleic Acids Res. 2002;30:281–283. doi: 10.1093/nar/30.1.281. [DOI] [PMC free article] [PubMed] [Google Scholar]


