

Abstract
Systems Biology has emerged as an exciting research approach in molecular biology and functional genomics that involves a systematic use of genomic, proteomic, and metabolomic technologies for the construction of network based models of biological processes. These endeavors, collectively referred to as systems biology establish a paradigm by which to systematically interrogate, model, and iteratively refine our knowledge of the regulatory events within a cell. Here we present a new systems approach, integrating DNA and transcript expression information, specifically designed to identify transcriptional networks governing the macrophage immune response to Lipopolysaccaride (LPS). Using this approach we are not only able to infer a global macrophage transcriptional network, but also time-specific sub-networks that are dynamically active across the LPS response. We believe that our system biological approach could be useful for identifying other complex networks mediating immunological responses.
Keywords: Systems Biology, Networks, Transcriptional regulation, Regulatory circuits, Dynamics, Protein-protein interactions, Genome, Macrophages, Innate immunity
Introduction
Macrophages are without any doubts one of the most important cell type of the innate immune system, they play many roles spanning from development, wound healing and homeostasis; yet their destructive potential and secretory products are central to the pathology of acute and chronic inflammatory disease [1], [2]. This functional diversity reflects the complex interplay of regulatory networks regulating macrophages functions [3], [4], [5]. As part of the innate immune response, macrophages recognize and are activated by conserved components of microorganisms (pathogen-associated molecular patterns or PAMPs ), and respond with a massive alteration in transcriptional output [5], [6], [7], [8]. Expression profiling has revealed thousands of genes that are induced or repressed in macrophages in response to the classical activating agent lipopolysaccharide (LPS) and other PAMPs, reflecting the presence of complex regulatory mechanisms underlying this response.
Although expression profiles alone are very informative they are limited to describing the complexity of the macrophage activation [4] as the underlying regulatory networks cannot be resolved. To advance the understanding beyond associations between groups of genes eit her a systematic perturbation analysis has to be employed [9], [10], [11], [12] or different types of data has to be integrated with the expression data [3], [13]. Yet, up to date there are only few systems biology approaches were, expression measurements are integrated with other genome-wide datasets with the aim to gain deeper insights of regulatory mechanisms controlling the macrophage activation. Hence, in order to infer transcriptional networks regulating macrophage activation by LPS we and others have collected and integrated in a systems approach several types of genome-wide measurements including, transcriptome changes, quantitative expression of transcriptional regulators and the promoter structure [3], [13]. This approached required us to develop a new bioinformatics procedure on how to integrate these data into a network model representing the entire macrophage response to LPS. This enabled us to interrogate these time-dependent dynamic networks with specific biological questions.
Material and Methods
Bone marrow-derived macrophages and LPS treatment
Generation of bone marrow-derived macrophages (BMM) was performed as described previously [14]. Macrophages were seeded at 1×10⁷ cells/ml and incubated with 10ng/ml LPS. 3 × 10cm dishes were harvested for each time point – unstimulated (time 0, 2, 7 and 24 hours). Total RNA from BMM were extracted by using QIAGEN RNeasy Mini kits according to the manufacturer’s protocols.
Microarray data analysis and identification of clones differentially expressed over time
In order to identify statistically significant differentially expressed clones over time, following a pretreatment of the data [13], we performed paired t-tests by comparing expression data sampled from the following time points: 0h–2h, 0h–7h, 0h–24h, 2h–7h, 2h–24h and 7h–24h. A single list representing all the transcripts differentially expressed at least in one of these comparisons was obtained by taking the union of the lists.
A stringent significance threshold for differential expression (p<0.001) was used to limit the number of false positive findings together with a multivariate permutation test [15] which provided a 75% confidence estimation that the number of false-positive genes did not exceed 10. Expression data was normalized so that the average of each gene across time points equals 1. Hierachical clustering was performed with Mathematica 5.1 (Wolfram Research, Inc., www.wolfram.com). For robustness against outliers, we chose the L-1 (Manhattan) distance metric and average linkage. Clusters were delimited manually from the resulting dendrogram.
Transcription factors quantitative real-time PCR
Gene-specific primer pairs were designed using Primer3 software (http://frodo.wi.mit.edu/cgi-bin/primer3/primer3_www.cgi), with an optimal primer size of 20 bases, amplification size of 140 bp, and annealing temperature of 60°C for a set of 1559 proteins designated as transcription factors by either Gene Ontology or conserved domain architecture. A detail protocol for the qPCR and the list of the primers and accession numbers can be found elsewhere [13].
TFBS analysis
Our analysis covered the [−500, +200] regions relative to the transcription start site (TSS). Promoters that contained 5% or more ambiguous nucleotides were excluded from consideration, leaving 1,784 promoters in our target set. We used all available matrix models of TFBSs contained in TRANSFAC Professional (Version. 7.4) database [16] and the analysis was performed by using the command-line version of the MATCH program and the matrix models were mapped to the extracted promoter sequences. We used minSUM profiles [17] for thresholding of the matrix models: these profiles contain threshold values for the core and matrix scores, optimized to minimize the sum of false positive and false negative TFBS predictions. To determine TFBSs specificity of our target set of macrophage promoters, we calculated an over-representation index (ORI) [18] using a background set of 40,101 randomly chosen unique mouse promoters. This calculation was done by in-house computer scripts; readers interested in applying the same filtering process for annotation of promoters based on ORI should contact the authors. An ORI value of 1 means no over-representation of the motif in the target promoter group as compared to the background; a larger ORI value indicates larger over-representation. We filtered out all TFBSs with ORI below 2.8. The remaining TFBSs were used to annotate the target promoters, a detail protocol including equations used in this analysis are available at [13].
Networks visualization and analysis
Networks presented in figure 1 have been visualized using Cytoscape version 2.2, a freely available network visualization and analysis software (http://www.cytoscape.org) [19]. Network statistics was calculated by using in-house computer scripts running on the Mathematica 5.1 platform (Wolfram Research, Inc., www.wolfram.com).
Figure 1.
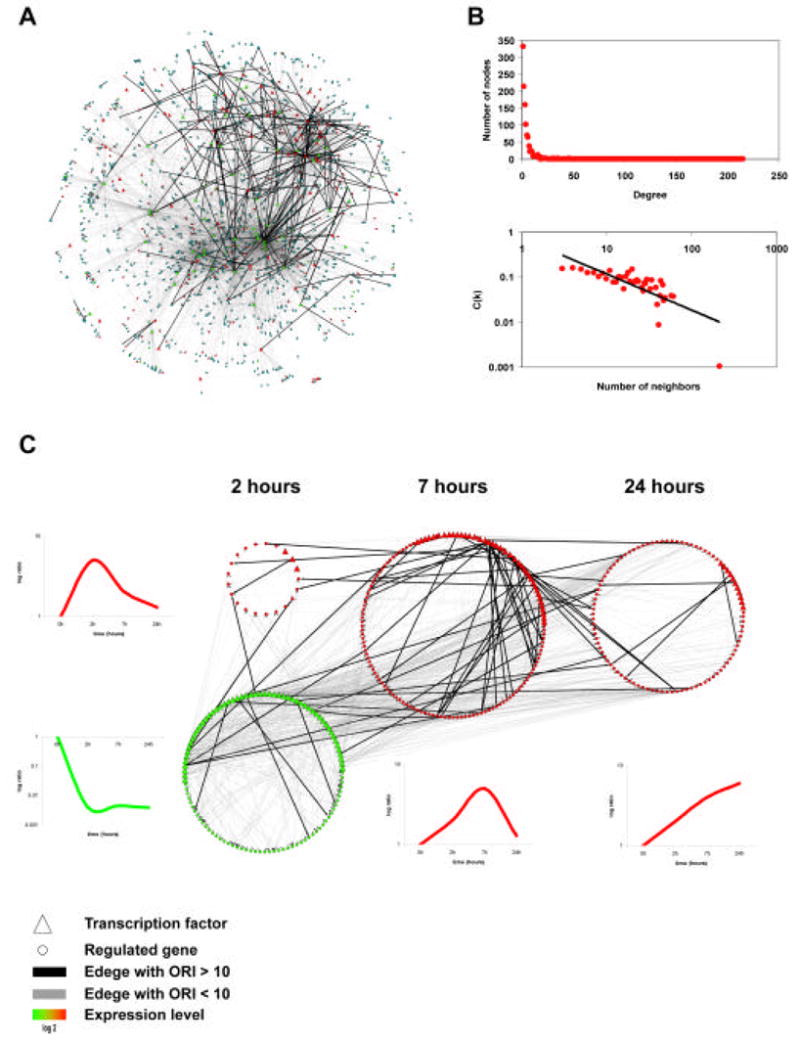
A) Global view of the macrophage LPS transcriptional network. Nodes represent transcription factors (triangle) or regulated genes (circle); inferred transcriptional control events are represented by an edge between a transcription factor and the regulated gene (solid line). This figure clearly illustrates the presence of highly connected transcription factors (hubs of the network).
B) Topological analysis of the global network. The macrophage transcriptional network is scale free, the degree distribution of the interactions follows a power-law relationship (top plot). In other words there are only few nodes (hubs) with high probability of interaction P(k). Also the distribution of the clustering coefficients C(k), follows a power-law relationship (bottom plot). These are global characteristic common to many “real” networks [25].
C) Networks dynamics during the macrophage LPS response. Our approach enables us to define time-specific sub-networks, based on the dynamic profiles of TFs and their regulated genes; we have identified sub-networks that are particularly active at specific time-points during the macrophage response to LPS. Interestingly there are evidences of high connectivity between the sub-networks (edges across the 4 sub-network). The plots show the representative expression profile of the majority of the TFs and genes for each sub-network. The thickness of the edge indicates the score calculated from the TFBSs overrepresentation index (ORI) as described in the methods.
Results
Definition of the node and edge libraries for the construction of the macrophage network
Our analysis follows a three step strategy. First, the nodes in the network are defined by the genes which are “active” in the gene expression data. Next, we perform a promoter analysis to collect an edge library for the active genes. Finally, we define time-dependent sub-networks by combining the edge library with the genes that are active in each time-point of the LPS response.
Nodes; In order to define the nodes in the macrophage transcriptional network we integrated two types of genome-wide measurements from murine bone Morrow-derived macrophage (BMM) at four time-points after LPS stimulation (unstimulated; 2 hours; 7 hours and 24 hours post stimulation).
First, we used RIKEN 60,000 cDNA array as a platform to monitor the genome-wide changes in macrophage genes expression over the time-course. 2,219 (4%) non-redundant array spots out of the 60,000 were above the detection limit and significantly changed over the time-course after LPS stimulation. Our results were in agreement with previously published analysis [3], [4], [5] showing groups of genes with precise time-specific dynamic expression where the main classification categories were: “early” up-regulated (0h to 2h) “middle” up regulated (2h to 7h), “late” up-regulated (7h to 24h), “early” down-regulated (0h to 2h) and transcripts expressed continuously over the time-course.
As a second data-source for defining the nodes we performed quantitative real-time PCR (qPCR) of 1,559 known and predicted transcripts coding for transcription factors and other putative nuclear proteins (TFs). The rationale is that we are focusing on the transcriptional networks and because transcriptional regulators are often expressed below the detection limit of microarrays [20]. From the qPCR data we identified 43% (673/1559) of the TFs monitored to be significantly expressed or differentially regulated over the time-course with a dynamical response resembling the transcriptome changes detected by RIKEN cDNA microarray described previously [5], [13].
Edges; an essential step toward the construction of networks is the definition of edge libraries, namely interactions among the networks nodes (i.e. protein; genes; promoters etc.). In order to computationally define edges between the 2,892 (2,219 from the microarray + 673 from the qPCR) nodes expressed/regulated in our system we used the promoter sequences as defined by the Genome Network Project (GNP) by using the Cap Analysis of Gene Expression (CAGE) [6], [21]. This new technique enables a systematic mapping of transcription starting sites (TSS) in the genome and it is therefore a more accurate definition of proximal promoters of virtually any gene expressed in the system under investigation [22]. The GNP generated CAGE libraries for each of the four time-points of the LPS time-course and the corresponding results of the entire CAGE dataset analysis for the macrophage system has been presented elsewhere [6], [21]. For the current analysis we have defined the active 800 kilobases promoter sequences of the 2,892 nodes in CAGE libraries corresponding to the four time-points during the LPS time -course and performed predictions of transcription factor binding sites (TFBSs) based on the Transfac matrix models. With this method, we identified 298 distinct transcription factors (TFs) from our node library with at least one associated TFBS in at least one of the 2,892 promoters, filtered by removing the predicted binding sites that were frequently found also in a background set. In summary, we obtained 3,824 TF-promoter interactions.
The global macrophage network
Integrating these datasets we have been able to infer the first macrophage transcriptional network, where the topological representation of the entire network is displayed in figure 1A. To further validate our approach we characterized the topological properties of the macrophage network. Previous studies, mainly by Barabasi and colleagues [23], [24], [25], revealed that complex systems including biological systems exhibit scale-free properties, where some nodes act as “highly connected hubs” (having many more connections than the average), although most nodes have few connections (Fig 1B) [23], [24], [26]. A similar analysis demonstrated that some of the most connected TFs in the macrophages network are: Nrf-2 (out-degree= 242); Atf-3 (out-degree= 116), Ets-1 (out-degree= 100) and Irf-1 (out-degree= 76); TFs with central roles in controlling the LPS response in macrophage have been extensively verified (Ets-1 and Irf-1) [27], [28] or recently linked to this biology as for the case of Nrf-2 and Atf-3 [3], [13], [29].
Network dynamics
Because of the dynamical nature of the measurements we used for the network construction we were able to analyze the entire network in order to identify sub-networks which were particularly active (up-regulated or down regulated) during specific time-points of the LPS time-course. Here we defined a 20 sub-networks active at discrete time-points defining dynamic regulatory circuits likely to be necessary for the innate immunity program in macrophages (Fig. 1C).
Discussion
Here we have presented a scalable systems biology approach to construct a regulatory network in LPS activated macrophages by integrating expression measurement and promoter structure. Our approach turned out to be very powerful and unbiased in defining not only time-specific sub-networks but also high connected TFs (hubs of the network) that are likely to be play fundamental roles during the innate immune program.
There are several noise sources in our analysis which could potentially contaminate the resulting network. For example, the data quality of the high-throughput datasets which define the nodes in the network, the edges of the network are not defined from physical interactions (i.e. protein-protein interaction and TF location analysis) but on the promoter occurrence inferred from computationally predicted TFBS. Despite these limitations we believe that our system approach is applicable in understanding virtually any mammalian cell type. The definition of nodes will be improved with increasing quality and amount of expression data generated from array technologies. The edge library can also be improved by adding other data-sources such as physical binding information [30] and algorithms for identifying gene-to-gene interactions [12]. Therefore, we will be able to further refine our predictions and infer a more robust macrophage network that can be interrogated by other researches with specific biological questions related to immunity.
Acknowledgments
This research has been supported by: Research Grant for the Scripps NeuroAIDS Preclinical Studies Center (SNAPS) from the National Institute of Mental Health (NIMH), grant number: 2P30MH062261-07 to T.R and the PhD programme in medical bioinformatics (R.N), Swedish Research Council (J.B), Clinical Gene Networks AB and Linköping University (J.T).
Footnotes
Publisher's Disclaimer: This is a PDF file of an unedited manuscript that has been accepted for publication. As a service to our customers we are providing this early version of the manuscript. The manuscript will undergo copyediting, typesetting, and review of the resulting proof before it is published in its final citable form. Please note that during the production process errors may be discovered which could affect the content, and all legal disclaimers that apply to the journal pertain.
References
- 1.Nathan C. Points of control in inflammation. Nature. 2002;420:846–852. doi: 10.1038/nature01320. [DOI] [PubMed] [Google Scholar]
- 2.Wells CA, Ravasi T, Hume DA. Inflammation suppressor genes: please switch out all the lights. J Leukoc Biol. 2005;78:9–13. doi: 10.1189/jlb.1204710. [DOI] [PubMed] [Google Scholar]
- 3.Gilchrist M, Thorsson V, Li B, Rust AG, Korb M, Kennedy K, Hai T, Bolouri H, Aderem A. Systems biology approaches identify ATF3 as a negative regulator of Toll-like receptor 4. Nature. 2006;441:173–178. doi: 10.1038/nature04768. [DOI] [PubMed] [Google Scholar]
- 4.Ravasi T, Wells C, Forest A, Underhill DM, Wainwright BJ, Aderem A, Grimmond S, Hume DA. Generation of diversity in the innate immune system: macrophage heterogeneity arises from gene-autonomous transcriptional probability of individual inducible genes. J Immunol. 2002;168:44–50. doi: 10.4049/jimmunol.168.1.44. [DOI] [PubMed] [Google Scholar]
- 5.Wells CA, Ravasi T, Faulkner GJ, Carninci P, Okazaki Y, Hayashizaki Y, Sweet M, Wainwright BJ, Hume DA. Genetic control of the innate immune response. BMC Immunol. 2003;4:5. doi: 10.1186/1471-2172-4-5. [DOI] [PMC free article] [PubMed] [Google Scholar]
- 6.Carninci P, Kasukawa T, Katayama S, Gough J, Frith MC, et al. The transcriptional landscape of the mammalian genome. Science. 2005;309:1559–1563. doi: 10.1126/science.1112014. [DOI] [PubMed] [Google Scholar]
- 7.Katayama S, Tomaru Y, Kasukawa T, Waki K, Nakanishi M, et al. Antisense transcription in the mammalian transcriptome. Science. 2005;309:1564–1566. doi: 10.1126/science.1112009. [DOI] [PubMed] [Google Scholar]
- 8.Wells CA, Ravasi T, Sultana R, Yagi K, Carninci P, et al. Continued discovery of transcriptional units expressed in cells of the mouse mononuclear phagocyte lineage. Genome Res. 2003;13:1360–1365. doi: 10.1101/gr.1056103. [DOI] [PMC free article] [PubMed] [Google Scholar]
- 9.Bansal M, Gatta GD, di Bernardo D. Inference of gene regulatory networks and compound mode of action from time course gene expression profiles. Bioinformatics. 2006;22:815–822. doi: 10.1093/bioinformatics/btl003. [DOI] [PubMed] [Google Scholar]
- 10.di Bernardo D, Thompson MJ, Gardner TS, Chobot SE, Eastwood EL, Wojtovich AP, Elliott SJ, Schaus SE, Collins JJ. Chemogenomic profiling on a genome-wide scale using reverse-engineered gene networks. Nat Biotechnol. 2005;23:377–383. doi: 10.1038/nbt1075. [DOI] [PubMed] [Google Scholar]
- 11.Gardner TS, di Bernardo D, Lorenz D, Collins JJ. Inferring genetic networks and identifying compound mode of action via expression profiling. Science. 2003;301:102–105. doi: 10.1126/science.1081900. [DOI] [PubMed] [Google Scholar]
- 12.Tegner J, Bjorkegren J. Perturbations to uncover gene networks. Trends Genet. 2007;23:34–41. doi: 10.1016/j.tig.2006.11.003. [DOI] [PubMed] [Google Scholar]
- 13.Nilsson R, Bajic VB, Suzuki H, di Bernardo D, Bjorkegren J, et al. Transcriptional network dynamics in macrophage activation. Genomics. 2006;88:133–142. doi: 10.1016/j.ygeno.2006.03.022. [DOI] [PubMed] [Google Scholar]
- 14.Sweet MJ, Hume DA. CSF-1 as a regulator of macrophage activation and immune responses. Arch Immunol Ther Exp (Warsz) 2003;51:169–177. [PubMed] [Google Scholar]
- 15.Xiao Y, Frisina R, Gordon A, Klebanov L, Yakovlev A. Multivariate search for differentially expressed gene combinations. BMC Bioinformatics. 2004;5:164. doi: 10.1186/1471-2105-5-164. [DOI] [PMC free article] [PubMed] [Google Scholar]
- 16.Matys V, Fricke E, Geffers R, Gossling E, Haubrock M, et al. TRANSFAC: transcriptional regulation, from patterns to profiles. Nucleic Acids Res. 2003;31:374–378. doi: 10.1093/nar/gkg108. [DOI] [PMC free article] [PubMed] [Google Scholar]
- 17.Kel AE, Gossling E, Reuter I, Cheremushkin E, Kel-Margoulis OV, Wingender E. MATCH: A tool for searching transcription factor binding sites in DNA sequences. Nucleic Acids Res. 2003;31:3576–3579. doi: 10.1093/nar/gkg585. [DOI] [PMC free article] [PubMed] [Google Scholar]
- 18.Bajic VB, Choudhary V, Hock CK. Content analysis of the core promoter region of human genes. In Silico Biol. 2004;4:109–125. [PubMed] [Google Scholar]
- 19.Shannon P, Markiel A, Ozier O, Baliga NS, Wang JT, Ramage D, Amin N, Schwikowski B, Ideker T. Cytoscape: a software environment for integrated models of biomolecular interaction networks. Genome Res. 2003;13:2498–2504. doi: 10.1101/gr.1239303. [DOI] [PMC free article] [PubMed] [Google Scholar]
- 20.Holland MJ. Transcript abundance in yeast varies over six orders of magnitude. J Biol Chem. 2002;277:14363–14366. doi: 10.1074/jbc.C200101200. [DOI] [PubMed] [Google Scholar]
- 21.Carninci P, Sandelin A, Lenhard B, Katayama S, Shimokawa K, et al. Genome-wide analysis of mammalian promoter architecture and evolution. Nat Genet. 2006;38:626–635. doi: 10.1038/ng1789. [DOI] [PubMed] [Google Scholar]
- 22.Bajic VB, Tan SL, Christoffels A, Schonbach C, Lipovich L, et al. Mice and men: their promoter properties. PLoS Genet. 2006;2:e54. doi: 10.1371/journal.pgen.0020054. [DOI] [PMC free article] [PubMed] [Google Scholar]
- 23.Barabasi AL, Albert R. Emergence of scaling in random networks. Science. 1999;286:509–512. doi: 10.1126/science.286.5439.509. [DOI] [PubMed] [Google Scholar]
- 24.Barabasi AL, Oltvai ZN. Network biology: understanding the cell’s functional organization. Nat Rev Genet. 2004;5:101–113. doi: 10.1038/nrg1272. [DOI] [PubMed] [Google Scholar]
- 25.van Nimwegen E. Scaling laws in the functional content of genomes. Trends Genet. 2003;19:479–484. doi: 10.1016/S0168-9525(03)00203-8. [DOI] [PubMed] [Google Scholar]
- 26.Luscombe NM, Babu MM, Yu H, Snyder M, Teichmann SA, Gerstein M. Genomic analysis of regulatory network dynamics reveals large topological changes. Nature. 2004;431:308–312. doi: 10.1038/nature02782. [DOI] [PubMed] [Google Scholar]
- 27.Kollet JI, Petro TM. IRF-1 and NF-kappaB p50/cRel bind to distinct regions of the proximal murine IL-12 p35 promoter during costimulation with IFN-gamma and LPS. Mol Immunol. 2005 doi: 10.1016/j.molimm.2005.04.004. [DOI] [PubMed] [Google Scholar]
- 28.Roger T, Miconnet I, Schiesser AL, Kai H, Miyake K, Calandra T. Critical role for Ets, AP-1 and GATA-like transcription factors in regulating mouse Toll-like receptor 4 (Tlr4) gene expression. Biochem J. 2005;387:355–365. doi: 10.1042/BJ20041243. [DOI] [PMC free article] [PubMed] [Google Scholar]
- 29.Rushworth SA, Chen XL, Mackman N, Ogborne RM, O’Connell M A. Lipopolysaccharide-Induced Heme Oxygenase-1 Expression in Human Monocytic Cells Is Mediated via Nrf2 and Protein Kinase C. J Immunol. 2005;175:4408–4415. doi: 10.4049/jimmunol.175.7.4408. [DOI] [PubMed] [Google Scholar]
- 30.Workman CT, Mak HC, McCuine S, Tagne JB, Agarwal M, Ozier O, Begley TJ, Samson LD, Ideker T. A systems approach to mapping DNA damage response pathways. Science. 2006;312:1054–1059. doi: 10.1126/science.1122088. [DOI] [PMC free article] [PubMed] [Google Scholar]