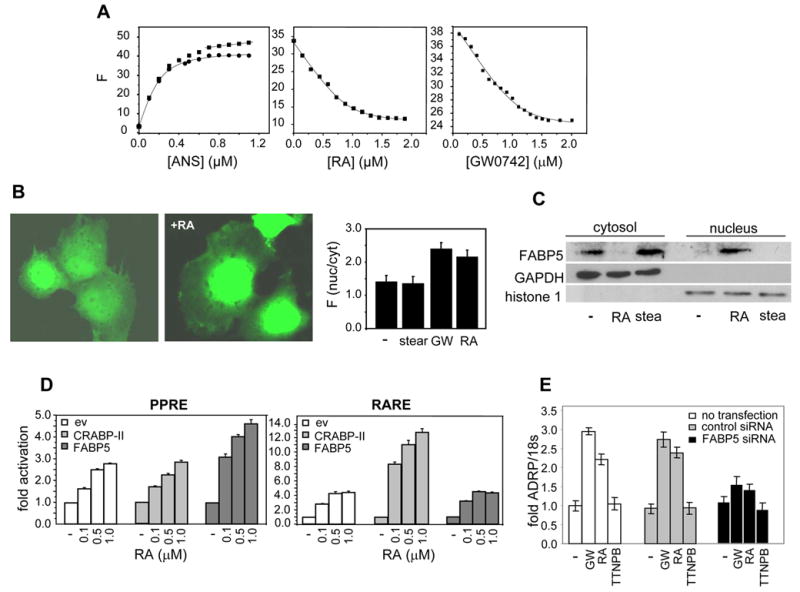
Figure 3. FABP5 binds RA, translocates to the nucleus in response to this ligand, and enhances RA-induced activation of PPARβ/δ.

A. FABP5 was titrated with the fluorescence probe ANS. Titrations curves (left panel, filled squares) were corrected for linear non-specific fluorescence (solid line at end of titration curve), and corrected data (filled circles) analyzed to yield a Kd of 57 ± 7.3 nM (mean ± SD, n=3). Kds for the association of FABP5 with RA (middle panel) and with GW0742 (right panel) were determined by fluorescence competition titrations. B. COS-7 cells were transfected with an expression vector harboring GFP-FABP5 and imaged. Images were acquired from live cells before and after a 30 min. treatment with RA (1 μM). Right panel: quantitation of nuclear/cytoplsmic partitioning of FABP5 in cells treated with denoted ligands. Forty cells of each treatment group were analyzed (mean ± SEM) C. HaCaT cells were treated with denoted RA or with stearic acid (1μM, 30 min.). Nuclei were separated from cytosol by subcellular fractionation (Calbiochem ProtoExtract Subcellular Proteome Extraction kit) and anlyzed for the presence of FABP5 by immunoblots. Efficiency of fractionation was validated by immunoblotting for the cytosolic marker GAPDH, and the nuclear marker histone 1. D. Transactivation assays were carried out in COS-7 cells cotransfected with a luciferase reporter driven by a PPRE and an expression vector for PPARβ/δ (left panel) or with an RARE-driven reporter together with an expression vector for RARα (right panel) Cells were also transfected with an empty vector or with expression vectors for either FABP5 or CRABP-II, treated with RA, lysed, and luciferase activity determined. Data are mean ± SEM, n=3. E. HaCaT cells were not transfected, or transfected with either control siRNA or a construct harboring FABP5 siRNA (24 hr.). The ability of denoted ligands to induce ADRP expression was monitored by Q-PCR and normalized to 18s mRNA. Data are mean ± SEM, n=3.
