

Abstract
Initiation of apoptosis by many agents is preceded by mitochondrial dysfunction and depolarization of the mitochondrial inner membrane. Here we demonstrate that, in renal proximal tubular cells (RPTC), cisplatin induces mitochondrial dysfunction associated with hyperpolarization of the mitochondrial membrane and that these events are mediated by protein kinase C (PKC)-α and ERK1/2. Cisplatin induced sustained decreases in RPTC respiration, oxidative phosphorylation, and increases in the mitochondrial transmembrane potential (ΔΨm), which were preceded by the inhibition of F0F1-ATPase and cytochrome c release from the mitochondria, accompanied by caspase-3 activation, and followed by RPTC apoptosis. Cisplatin also decreased active Na+ transport as a result, in part, of the inhibition of Na+/K+-ATPase. These changes were preceded by PKC-α and ERK1/2 activation. Inhibition of cisplatin-induced PKC-α and ERK1/2 activation using Go6976 and PD98059, respectively, abolished increases in ΔΨm, diminished decreases in oxidative phosphorylation, active Na+ transport, and decreased caspase-3 activation without blocking cytochrome c release. Caspase inhibitor benzyloxycarbonyl-Val-Ala-Asp-fluoromethylketone (zVAD-fmk) did not prevent increases in ΔΨm. Furthermore, inhibition of PKC-α did not prevent cisplatin-induced ERK1/2 activation. We concluded that in RPTC: 1) cisplatin-induced mitochondrial dysfunction, decreases in active Na+ transport, and apoptosis are mediated by PKC-α and ERK1/2; 2) PKC-α and ERK1/2 mediate activation of caspase-3 by acting downstream of cytochrome c release from mitochondria; and 3) ERK1/2 activation by cisplatin occurs through a PKC-α-independent pathway.
Cisplatin is used alone or in combination with other agents in the treatment of many solid tumors and metastatic cancers (including ovarian, testicular, bladder, head and neck, lung, cervical, and breast cancers) that are no longer amenable to local treatments such as surgery and/or radiotherapy. The major disadvantage of this antineoplastic agent is dose-dependent and cumulative nephrotoxicity (1-3). A single therapeutic dose of cisplatin causes kidney damage within 48 h (4, 5). Therefore, the dose used in cancer chemotherapy is limited by the risk of acute or chronic renal failure (1-3, 6-8). Renal proximal tubular cells (RPTC)1 are the major target for cisplatin toxicity within the kidney, as cisplatin nephrotoxicity manifests primarily as proximal tubule dysfunction (6-8). Cisplatin alters a variety of RPTC functions including DNA, mRNA, protein syntheses, transport of organic and inorganic solutes, activities of some ATPases, γ-glutamyl transpeptidase, and organization of intracellular cytoskeleton (2-12).
In in vitro conditions, concentrations higher than 50 μm cisplatin result in necrosis whereas lower concentrations induce apoptosis (13, 14). Multiple mechanisms have been implicated in cisplatin-induced nephrotoxicity including DNA damage, oxidative stress, mitochondrial dysfunction, and alteration in signal transduction pathways involved in apoptosis. Cisplatin-induced apoptosis in renal epithelial cells is generally considered to be the result of DNA damage and is associated with caspase-3 activation (15, 16). This event is followed by cleavage of poly(ADP-ribose) polymerase (PARP), chromatin condensation and DNA fragmentation, dissociation of different proteins from cytoskeleton, and disruption of intermediate filament organization of cytoskeleton (5, 11, 16). Oxidative stress has been also implicated in cisplatin-induced nephrotoxicity. Cisplatin treatment increases renal lipid peroxidation, blood urea nitrogen, creatinine, and oxidized glutathione levels, but depletes renal glutathione (17-19). Large bolus of intravenous glutathione blocks these effects and cisplatin-induced nephrotoxicity (10).
Mitochondria are a major target of cisplatin in cancer cells. In ovarian cancer, HeLa, and 3T3 cells, cisplatin treatment decreases mitochondrial uptake of rhodamine 123 and induces morphological changes in mitochondria concomitant with cytochrome c release to the cytoplasm (20-22). Cisplatin-resistant cells exhibit inhibition of cytochrome c release from mitochondria as a result of overexpression of Bcl-xL (23, 24). Mitochondrial injury has been proposed as an early event in cisplatin toxicity in RPTC (9). Higher concentrations of cisplatin that induce cell necrosis (0.1–2.0 mm) cause disruption of the mitochondrial respiratory chain as a result of inhibition of complexes I–IV (2, 9, 17). The residual electron flow through the respiratory chain is the source of reactive oxygen species, but formation of reactive oxygen species is not a direct cause of the renal cell toxicity induced by high concentrations of cisplatin (17, 25). These changes are accompanied by the decrease in state 3 respiration and intracellular ATP content (9). Cisplatin also inhibits mitochondrial phosphate transport, possibly by a direct interaction with the mitochondrial phosphate carrier (26). So far, however, mitochondrial dysfunction has been reported only in renal proximal tubules exposed to higher concentrations of cisplatin. Therefore, the first goal of this study was to determine whether lower concentrations of cisplatin cause alterations in mitochondrial function that may contribute to toxicity of this drug.
Cisplatin activates multiple signal transduction pathways, which can lead to different cellular responses (27). In various cancer cells, cisplatin activates the MEK1 cascade and members of the mitogen-activated protein kinase family including c-Jun N-terminal kinase, p38, and extracellular signal-regulated kinases 1 and 2 (ERK1/2) (27-29). Activation of these kinases results in p53 phosphorylation, activation of caspase-3, generation of catalytic domains of different isozymes of protein kinase C (PKC), including PKC-δ, PKC-ε, and PKC-ζ, and is followed by cell death (30-32). PKC isozymes have been implicated in cisplatin toxicity in renal proximal tubules as well (4, 33). It has been shown that cisplatin administration in vivo increases protein levels of PKC-α in renal proximal tubules and that pretreatment with general protein kinase inhibitors protects kidneys from cisplatin-induced injury (4). On the other hand, there are reports showing that the exposure of renal cortical slices to cisplatin decreases total PKC activity (33).
PKC-α and ERK1/2 are present in RPTC and play an important role in the responses of these cells to various types of injury. However, the effect of cisplatin on PKC-α and ERK1/2 in RPTC is not known, and it is unknown whether these kinases are involved in cisplatin nephrotoxicity. Therefore, the second goal of this study was to determine whether PKC-α and/or ERK1/2 play roles in cisplatin-induced injury in RPTC and whether these kinases mediate cisplatin effects on mitochondrial function.
EXPERIMENTAL PROCEDURES
Materials
Female New Zealand White rabbits (2.0–2.5 kg) were purchased from Myrtle's Rabbitry (Thompson Station, TN). Cisplatin (cis-diamminedichloroplatinum(II)) was supplied by Aldrich. 5,5′,6,6′-Tetrachloro-1,1′,3,3′-tetraethylbenzimidazolylcarbocyanine iodide (JC-1) and 4′,6-diamidino-2-phenylindole dihydrochloride (DAPI) were obtained from Molecular Probes (Eugene, OR). l-Ascorbic acid-2-phosphate magnesium salt and cell culture media were obtained from Wako BioProducts (Richmond, VA) and Invitrogen, respectively. Caspase-3 and caspase-9 fluorometric substrates (DEVD-7-amino-4-trifluoromethyl coumarin (AFC) and LEHD-AFC, respectively), AFC, and buffers for caspase assays were purchased from BioVision (Palo Alto, CA). PKC-α inhibitor (Go6976) and MEK inhibitors (PD98059 and UO126) were supplied by Calbiochem (La Jolla, CA). zVAD-fmk was purchased from Biomol (Plymouth Meeting, PA). Protease inhibitor and phosphatase inhibitor mixtures were supplied by Oncogene (San Diego, CA) and Sigma, respectively. Phospho-p44/42 ERK, phospho-PKC-δ, and active caspase-3 antibodies were obtained from Cell Signaling Technology (Beverly, MA). Phospho-PKC-α and phospho-PKC-ε antibodies were purchased from Upstate Biotechnology (Lake Placid, NY). PKC-α and p44/42 ERK antibodies were obtained from BD Transduction Laboratories (San Diego, CA) and cytochrome c antibody from Santa Cruz (Santa Cruz, CA). Anti-rabbit and anti-mouse IgG coupled to horseradish peroxidase were supplied by Kirkegaard & Perry Laboratories (Gaithersburg, MD) and Supersignal Chemiluminescent Substrate by Pierce. The sources of the other reagents and cell culture hormones have been described previously (34).
Isolation of Proximal Tubules and Culture Conditions
Rabbit renal proximal tubules were isolated by the iron oxide perfusion method and grown in 35-mm culture dishes in optimized conditions as described previously (34). The purity of the renal proximal tubular segments isolated by this method is ∼96%. The culture medium was a 50:50 mixture of Dulbecco's modified Eagle's medium and Ham's F-12 nutrient mix without phenol red, pyruvate, and glucose, supplemented with 15 mm NaHCO3, 15 mm Hepes, and 6 mm lactate (pH 7.4, 295 mosmol/kg). Human transferrin (5 μg/ml), selenium (5 ng/ml), hydrocortisone (50 nm), bovine insulin (10 nm), and l-ascorbic acid-2-phosphate (50 μm) were added to the medium immediately before daily media change (2 ml/dish).
Cisplatin Treatment of RPTC Monolayers
RPTC monolayers reached confluence within 6 days and were treated with cisplatin on day 6 of culture. Samples of RPTC were taken at various time points (between 0.5 and 24 h) of cisplatin exposure for immunoblotting, measurements of mitochondrial functions, and caspase activities. Various inhibitors (Go6976, PD98059, UO126, zVAD-fmk) were added 0.5 h prior to cisplatin treatment. Control RPTC were treated with diluent (dimethyl sulfoxide; 0.1% final concentration)
Mitochondrial Function
Mitochondrial function was assessed by measurements of oxygen consumption, intracellular ATP content, and mitochondrial transmembrane potential.
Oxygen Consumption (QO2)
RPTC monolayers were gently detached from the dishes with a rubber policeman, suspended in 37 °C culture medium, and transferred to the QO2 measurement chamber. QO2 was measured polarographically using Clark type electrode as described previously (34). Basal QO2 was measured in each run prior to any additions. Oligomycin-sensitive QO2 was used as a marker of oxidative phosphorylation, measured in the presence of oligomycin (0.6 μg/ml), and calculated as a difference between basal and oligomycin-insensitive QO2. Uncoupled QO2 was used as a marker of the activity of electron transport through the respiratory chain and was measured after addition of carbonyl cyanide p-(trifluoromethoxy)phenylhydrazone (FCCP; 2 μm).
Measurement of Intracellular ATP Content
ATP content in RPTC was measured by the luciferase method in freshly prepared cellular lysates using the ATP bioluminescence assay kit supplied by Roche Molecular Biochemicals and instructions provided by the manufacturer.
Mitochondrial Membrane Potential (ΔΨm)
ΔΨm was assessed using JC-1, a cationic dye that exhibits potential-dependent accumulation and formation of red fluorescent J-aggregates in mitochondria. In contrast, changes in plasma membrane potential do not affect the JC-1 status. The JC-1 monomer accumulates in the cytoplasm, where it produces green fluorescence. Formation of J-aggregates in the mitochondria is indicated by a fluorescence emission shift from green (525 nm) to red (590 nm). Mitochondrial depolarization is indicated by a decrease in the red/green fluorescence intensity ratio. At different time points of cisplatin exposure, RPTC monolayers were loaded with 10 μm JC-1 for 30 min at 37 °C. After loading, media were aspirated, monolayers kept on ice, washed twice with ice-cold phosphate-buffered saline (PBS), scraped off culture dishes, washed, and resuspended in PBS. Fluorescence was analyzed by flow cytometry (FACSCalibur, BD Biosciences) using excitation by a 488-nm argon-ion laser. The JC-1 monomer (green) and the J-aggregate (red) were detected separately in FL1 (emission, 525 nm) and FL2 (emission, 590 nm) channels, respectively.
The JC-1 accumulation in mitochondria of control and cisplatin-treated RPTC was visualized by fluorescence microscopy. RPTC were loaded with JC-1 as described above, washed twice, and overlaid with ice-cold PBS. Live RPTC monolayers were examined under a Zeiss fluorescent microscope (Axioskop) using water immersion objective.
Isolation of RPTC Mitochondria and Cytosol
Mitochondria were isolated from RPTC as described by Lash and Sall (35). RPTC were homogenized in the ice-cold isolation buffer (225 mm sucrose, 10 mm Tris-HCl, 10 mm potassium phosphate (pH 7.0), 5 mm MgCl2, 20 mm KCl, 0.1 mm phenylmethylsulfonyl fluoride, 2 mm EGTA, 1 mm dithiothreitol, and protease inhibitor mixture) using Dounce homogenizer and centrifuged at 1,000 × g for 10 min at 4 °C. Supernatant was collected and centrifuged at 15,000 × g for 10 min at 4 °C. The pellet was washed twice by re-suspending in the isolation buffer followed by centrifugation at 15,000 × g for 10 min at 4 °C. The final mitochondrial pellet was resuspended in 10 mm Tris-HCl buffer (pH 7.4) containing 25 mm sucrose, 75 mm mannitol, 100 mm KCl, 0.05 mm K2EDTA, 5 mm H3PO4, and used for measurement of F0F1-ATPase activity and immunoblotting. The supernatant collected after the first centrifugation at 15,000 × g for 10 min (mitochondrial pellet) was further spun down at 100,000 × g for 30 min at 4 °C, and the supernatant resulting from this centrifugation was used as the cytosolic fraction.
Measurement of F0F1-ATPase Activity
F0F1-ATPase activity was determined in freshly isolated RPTC mitochondria by measuring the release of Pi from ATP as described by Law et al. (36).
Cytochrome c Release from Mitochondria
Cytosolic and mitochondrial fractions were isolated from RPTC at various time points of cisplatin exposure. Mitochondria were isolated from RPTC as described above. The supernatant resulting from the mitochondrial spin was further centrifuged at 100,000 × g for 30 min at 4 °C to obtain the cytosolic fraction, which was used to examine protein levels of cytochrome c by means of immunoblotting.
Active Na+ Transport
Ouabain-sensitive QO2 was used as a marker of active Na+ transport in RPTC as described previously (34). Ouabain-sensitive QO2 was measured in the presence of 1.0 mm ouabain and calculated as a difference between basal and ouabain-insensitive QO2.
Measurement of Na+/K+-ATPase Activity
RPTC lysates were prepared as described previously (37). Briefly, 1.0 mg of RPTC protein was added to 0.1 ml of 25 mm imidazole buffer (pH 7.0) containing 0.065% SDS, 1% bovine serum albumin, and a phosphatase inhibitor mixture. Following incubation for 10 min at 22 °C, 0.6 ml of 0.3% bovine serum albumin in 25 mm imidazole buffer was added to lower the SDS concentration and aliquots were used for measurement of Na+/K+-ATPase activity. Na+/K+-ATPase activity was determined in cellular lysates by measuring the difference between total ATPase activity and ouabain-insensitive ATPase activity as described previously (37).
Measurement of Caspase-3 Activity
Caspase-3 activity was quantified by fluorometric detection of free AFC after cleavage from DEVDAFC. In brief, the media were aspirated from the culture dishes, then the RPTC monolayers were washed with ice-cold PBS, scraped off culture dishes, and spun down at 1,000 × g for 2 min. The pellet was resuspended in cell lysis buffer (BioVision, Palo Alto, CA), incubated on ice for 10 min, and centrifuged at 15,000 × g for 10 min at 4 °C. The pellets were discarded and the supernatants used for caspase assays. Cell lysates were incubated for 1 h at 37 °C in the presence of reaction buffer optimized for caspase activity assays (BioVision), 1 mm dithiothreitol, and 50 μm DEVD-AFC. The fluorescence was read at 380/500 nm (excitation/emission), and the amount of product cleaved was determined from the AFC standard curve.
Immunoblotting
Immunoblot analysis was used for the measurement of protein levels of both total and phosphorylated forms of ERK1/2, PKC-α, PKC-δ, and PKC-ε in the total RPTC homogenates and RPTC mitochondria and also for the assessment of protein levels of cytochrome c and active caspase 3 in RPTC cytosol. RPTC homogenates and mitochondrial and cytosolic fractions of RPTC were lysed and boiled for 10 min in Laemmli sample buffer (60 mm Tris-HCl, pH 6.8 containing 2% SDS, 10% glycerol, 100 mm β-mercaptoethanol, and 0.01% bromphenol blue) (38). Proteins were separated using SDS-PAGE. Following electroblotting of the proteins to a nitrocellulose membrane, blots were blocked for 1 h in Tris-buffered saline buffer containing 0.5% casein and 0.1% Tween 20 (blocking buffer), and incubated overnight at 4 °C in the presence of primary antibodies diluted in the blocking buffer. Following washing, the membranes were incubated for 1 h with anti-rabbit or anti-mouse IgG coupled to horseradish peroxidase and washed again. The supersignal chemiluminescent system was used for protein detection and scanning densitometry for the quantification of results.
Assessment of Apoptosis
RPTC nuclei were visualized by DAPI staining. The monolayers were fixed in 3.7% formaldehyde for 15 min, rinsed with PBS, and incubated in the presence of 8 μm DAPI for 2 h at room temperature. Following staining, RPTC monolayers were rinsed with PBS, coverslips mounted, and the nuclei evaluated under a Zeiss Fluorescent Microscope. Total and apoptotic nuclei were counted in 6–8 different areas of each monolayer using two plates per each experimental group.
Protein Assay
Protein concentration in all samples was determined using bicinchoninic acid assay with bovine serum albumin as the standard.
Statistical Analysis
Data are presented as means ± S.E. and were analyzed for significance by analysis of variance. Multiple means were compared using Student-Newman-Keuls test. Statements of significance were based on p < 0.05. Renal proximal tubules isolated from an individual rabbit represented a separate experiment (n = 1) consisting of data obtained from two to four plates.
RESULTS
Oxygen Consumption (QO2)
Basal QO2 in control confluent quiescent RPTC monolayers was 21.1 ± 1.2 nmol of O2/mg of protein/min. Exposure of RPTC to 5 and 10 μm cisplatin for 48 h had no effect on basal QO2 (data not shown). Two-hour exposure to 50 μm cisplatin decreased basal QO2 by 23%, but this decrease was transient and basal QO2 returned to control level at 4 h of the treatment (Fig. 1A). However, at 24 h of cisplatin exposure, basal QO2 in RPTC decreased by 49% and was accompanied by cell death (Figs. 1A and 12B).
Fig. 1. The effect of cisplatin on basal oxygen consumption (QO2) and oligomycin-sensitive QO2 (A) and uncoupled QO2 (B).

RPTC were treated with 50 μm cisplatin, and samples were taken at 1, 2, 4, 8, 12, and 24 h of cisplatin exposure for measurements of QO2. Control RPTC were treated with vehicle (Me2SO) alone. Basal QO2 in controls did not change over the course of 24 h. Basal QO2 (●) represents the total amount of oxygen consumed by RPTC and was measured as described under “Experimental Procedures.” Oligomycin-sensitive QO2 (○) was measured in the presence of oligomycin (0.6 μg/ml) and calculated as a difference between basal and oligomycin-insensitive QO2. Uncoupled QO2 (■) was measured after addition of FCCP (2 μm). Results are the average ± S.E. of six experiments (RPTC isolations).
Fig. 12. The effect of cisplatin on caspase-3.

Caspase-3 activity was quantified by fluorometric detection of free AFC after cleavage from 50 μm DEVD-AFC, and the amount of product cleaved was determined from the AFC standard curve. A, the effect of inhibitors of ERK1/2 activation (50 μm PD98059 and 3 μm UO126) on cisplatin (50 μm)-induced caspase-3 activation. B, the effect of inhibition of PKC-α activation (10 nm Go6976) or treatment with caspase inhibitor (50 μm Z-VAD) on cisplatin (50 μm)-induced caspase-3 activation. Results are the average ± S.E. of four to nine independent experiments (RPTC isolations).
Oligomycin-sensitive QO2 (a marker of oxidative phosphorylation) in control confluent quiescent RPTC monolayers was 15.3 ± 1.0 nmol of O2/mg of protein/min. Exposure of RPTC to 5 and 10 μm cisplatin for 48 h did not have a significant effect on oligomycin-sensitive QO2 (data not shown). Exposure to 50 μm cisplatin had effects on oligomycin-sensitive QO2 similar to the effects it had on basal QO2, but the decreases in oligomycin-sensitive QO2 (42 and 66% at 2 and 24 h, respectively) were more pronounced than the reduction in basal QO2 (Fig. 1A). Oligomycin-insensitive QO2 in RPTC was not changed by cisplatin exposure.
Uncoupled QO2 (a marker of electron transport through the respiratory chain) in confluent quiescent control RPTC monolayers was 51.6 ± 5.0 nmol of O2/mg of protein/min. Exposure of RPTC to 5 and 10 μm cisplatin for 48 h had no effect on uncoupled QO2 (data not shown). Exposure of RPTC to 50 μm cisplatin decreased uncoupled QO2 by 25 and 53% at 2 and 24 h of treatment, respectively (Fig. 1B). These data show that: 1) cisplatin induces a transient reduction in RPTC respiration during early exposure, followed by a sustained decrease in RPTC respiration during later time points of exposure; and 2) oxidative phosphorylation and the electron transport chain are the targets of cisplatin in RPTC mitochondria.
F0F1-ATPase Activity and Intracellular ATP Content
As shown in Fig. 2A, exposure of RPTC for 1 h to 50 μm cisplatin decreased activity of mitochondrial F0F1-ATPase by 43%. This decrease preceded the reductions in basal, oligomycin-sensitive, and uncoupled QO2s (Figs. 1 and 2A). The activity of F0F1-ATPase remained decreased until the end of cisplatin exposure in RPTC (24 h).
Fig. 2. The effect of cisplatin on F0F1-ATPase activity (A) and intracellular ATP content (B).

A, RPTC were treated with 50 μm cisplatin and mitochondria were isolated at 1, 2, 4, 8, 12, 18, and 24 h of cisplatin exposure. The F0F1-ATPase activity assay was performed at 31 °C in 10 mm Tris-HCl, pH 8.2, containing 200 mm KCl, 3 mm MgCl2, and RPTC mitochondria. The reaction was initiated by the addition of ATP (5 mm) and terminated after 5 min by adding 3 m trichloroacetic acid to precipitate protein. The inorganic phosphate concentration in the supernatant was determined using Sumner reagent. Each mitochondrial sample was run in the absence and presence of oligomycin (10 μg/ml), and the F0F1-ATPase activity was expressed as the oligomycin-sensitive phosphate production. Results are the average ± S.E. of three experiments (RPTC isolations). B, RPTC were treated with 50 μm cisplatin and samples were taken at 1, 2, 4, 8, 18, and 24 h of cisplatin exposure for measurements of intracellular ATP content. Results are the average ± S.E. of five experiments (RPTC isolations).
The intracellular ATP concentration was examined to determine whether cisplatin-induced toxicity in RPTC was caused by decreases in intracellular ATP levels. The ATP content in cisplatin-treated RPTC decreased by 32 and 25% at 6 and 8 h of exposure, respectively, but was not different from control levels at 18 and 24 h of exposure (Fig. 2B). The decreases in ATP content were preceded by transient reductions in the basal, oligomycin-sensitive, and uncoupled QO2s and the activity of F0F1-ATPase. However, sustained decrease in oxidative phosphorylation at 24 h of cisplatin treatment did not affect ATP content in these cells. These data suggest that cisplatin reduces ATP-consuming processes in RPTC.
Mitochondrial Membrane Potential (Δψm)
Mitochondrial respiration results in the generation of a proton and pH gradients across the inner mitochondrial membrane and produces the membrane potential (Δψm), which represents most of the energy of the proton gradient. Lipophilic cations such as JC-1 accumulate in the mitochondrial matrix driven by the electro-chemical gradient (negative inside the mitochondrion). The higher the Δψm, the more polarized is the mitochondrial membrane, and more JC-1 is taken up into the mitochondrial matrix. Once taken up into the mitochondrial matrix, JC-1 forms aggregates that fluoresce red (emission, 590 nm), whereas JC-1 in the cytosol exists in a monomeric form that fluoresces green (emission, 525 nm). Thus, an increase in intensity of red fluorescence of JC-1 indicates higher Δψm and mitochondrial membrane hyperpolarization, whereas loss of red and increased green fluorescence indicates decreased Δψm and mitochondrial membrane depolarization. The ratio of red to green fluorescence is dependent only on the mitochondrial membrane potential and not on the other factors such as plasma membrane potential, mitochondrial size, shape, and density that might affect a single component fluorescence signal such as red fluorescence.
Using fluorescent microscopy, we determined that the red fluorescence (JC-1 aggregates) was localized in the mitochondria (Fig. 3). Control RPTC had elongated yellow/orange and red fluorescing mitochondria, against a diffused greenish background corresponding to monomeric JC-1 in the cytoplasm (Fig. 3A). The green (monomer) fluorescence corresponds to values of Δψm higher than −140 mV (39). The orange fluorescence in mitochondria reflects Δψm of approximately −150 mV (40). Exposure of RPTC to cisplatin for 18 and 24 h resulted in an increase in red fluorescence in the mitochondria and a decrease in green fluorescence in the cytoplasm (Fig. 3, B and C). The increase in overall red fluorescence was a result of both the increase in the intensity of fluorescence in the mitochondria and the increase in the number of red-fluorescing mitochondria. Exposure of control RPTC to mitochondrial uncoupler (FCCP) resulted in the loss of red staining in RPTC, indicating mitochondrial membrane depolarization (Fig. 3D).
Fig. 3. Mitochondrial hyperpolarization induced by cisplatin exposure in RPTC.

RPTC were treated with 50 μm cisplatin and loaded with 10 μm JC-1 for 30 min at 37 °C, washed twice with ice-cold PBS, and overlaid with ice-cold PBS. The live RPTC monolayers were examined under Zeiss fluorescent microscope (Axioskop) using water-immersion objective. Original magnification, ×400. A, controls. B, RPTC treated with 50 μm cisplatin for 18 h. C, RPTC treated with 50 μm cisplatin for 24 h. Inset, a single cell (original magnification, ×800). D, mitochondrial depolarization in RPTC induced by FCCP (2 μm). These images are representative of three independent experiments (cell isolations).
Flow cytometry was used for the quantification of Δψm in RPTC. Δψm was assessed by the measurement of both red fluorescence (JC-1 aggregates present in mitochondria) and red/green fluorescence ratio (JC-1 aggregate/JC-1 monomer ratio). The JC-1 aggregate/monomer ratio increased by 43% at 2 h of cisplatin exposure (Fig. 5B). This increase was transient, and Δψm returned to control levels at 4 h of cisplatin exposure. However, at 12, 18, and 24 h of cisplatin exposure, Δψm increased 1.4-, 1.9-, and 2.4-fold, respectively (Figs. 4A and 5, A and B). Previously, it has been shown that a 12% change in fluorescence signal of JC-1 reflects a 10-mV change in the membrane potential (41). Therefore, the increases in JC-1 fluorescence at 12, 18, and 24 h of cisplatin exposure in RPTC correspond to Δψm of −180, −230, and −270 mV, respectively. The early (2 h) increase in Δψm followed the decrease in F0F1-ATPase activity and was accompanied by decreases in basal, oligomycin-sensitive, and uncoupled respiration of RPTC (Figs. 1, 2A, and 5, A and B). These results show that cisplatin treatment in RPTC results in a transient hyperpolarization of the mitochondrial membrane that occurs early during the exposure and is followed by sustained hyperpolarization of the mitochondrial membrane that precedes RPTC apoptosis.
Fig. 5. The effect of cisplatin exposure on Δψm in RPTC.

RPTC monolayers were treated and analyzed as described in the legend to Fig. 4. A, the effect of cisplatin on the average red fluorescence of JC-1 in RPTC. B, the effect of cisplatin on the red/green fluorescence ratio of JC-1 in RPTC. Results are the average ± S.E. of seven experiments (RPTC isolations).
Fig. 4. Quantification of JC-1 accumulation in mitochondria (red fluorescence) and cytoplasm (green fluorescence) in cisplatin-treated RPTC.

RPTC monolayers were exposed to 50 μm cisplatin for 24 h and loaded with 10 μm JC-1 for 30 min at 37 °C. After loading, media were aspirated and monolayers kept on ice, washed twice with ice-cold PBS, scraped off culture dishes, washed, and resuspended in PBS. Fluorescence was analyzed by flow cytometry (BD Biosciences FACSCalibur) using excitation by 488 nm argon-ion laser. The JC-1 monomer (green fluorescence) and J-aggregate (red fluorescence) were detected in FL1 (emission, 525 nm) and FL2 (emission, 590 nm) channels, respectively. A, the effect of cisplatin on JC-1 accumulation in RPTC mitochondria. B, the effect of inhibition of ERK1/2 (50 μm PD98059) on cisplatin-induced accumulation of JC-1 in mitochondria. C, the effect of inhibition of PKC-α (10 nm Go6976) on cisplatin-induced accumulation of JC-1 in mitochondria. Experiments were performed five times with comparable results.
Cytochrome c Release
Cisplatin exposure in RPTC induced the release of cytochrome c from the mitochondria to the cytosol. The protein levels of cytochrome c in the cytosolic fraction of RPTC increased 5-fold at 6 h of cisplatin exposure and continued to increase until 18 h of the treatment (Fig. 6). Cytochrome c translocation to the cytosol followed the initial transient disruption of mitochondrial function and preceded sustained decreases in oxidative phosphorylation electron transport rate, and hyperpolarization of the mitochondrial membrane (Figs. 1, 5, and 6). These data show that: 1) cisplatin exposure in RPTC induces the release of cytochrome c from mitochondria to the cytosol, and 2) cytochrome c release from mitochondria occurs following initial hyperpolarization of the mitochondrial membrane and the decrease in respiration. These data provide additional evidence for the disruption of mitochondrial function caused by cisplatin in RPTC.
Fig. 6. The effect of cisplatin exposure on the release of cyto-chrome c to RPTC cytosol and activation of caspase-3.
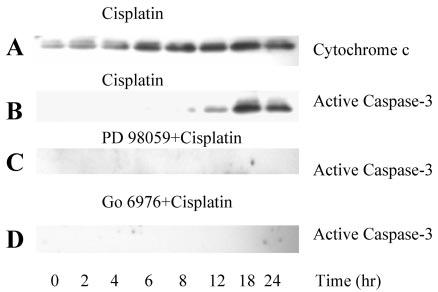
At different time points of cisplatin exposure, RPTC cytosol was isolated as described under “Experimental Procedures” and protein levels of cyto-chrome c and active caspase 3 (17–19-kDa cleaved fragment) determined by immunoblotting. A, the effect of cisplatin exposure on the release of cytochrome c to the RPTC cytosol. B, the effect of cisplatin on caspase-3 cleavage in RPTC. C, the effect of ERK1/2 inhibition (50 μm PD98059) on caspase-3 cleavage during cisplatin exposure in RPTC. D, the effect of PKC-α inhibition (10 nm Go6976) on caspase-3 cleavage during cisplatin exposure in RPTC. Experiments were performed three times with comparable results.
Active Na+ Transport
Active Na+ transport is an ATP-consuming process, as it is driven by Na+/K+-ATPase. The consumption of oxygen associated with production of ATP required for maintaining the Na+/K+-ATPase activity and active Na+ transport (ouabain-sensitive QO2) accounts for ∼50% of basal oxygen consumption in RPTC. Ouabain-sensitive QO2 (used as a marker of active Na+ transport) in control RPTC was 9.5 ± 1.1 nmol of O2/mg of protein/min. One- and 2-h exposures to cisplatin decreased ouabain-sensitive QO2 by 44 and 36%, respectively. Ouabain-sensitive QO2 remained decreased until 4 h of cisplatin exposure and transiently returned to control levels at 8 and 12 h of treatment (Fig. 7A). This transient increase in ouabain-sensitive QO2 between 8 and 12 h was accompanied by a decrease in intracellular ATP content (Figs. 2 and 7A). At 24 h of cisplatin exposure, ouabain-sensitive QO2 was reduced by 67% in comparison with controls (Fig. 7A). The decline in ouabain-sensitive QO2 occurred prior to any significant decreases in basal, oligomycin-sensitive, or uncoupled QO2 (Figs. 1 and 6).
Fig. 7. The effect of cisplatin on active Na+ transport.

A, the effect of cisplatin on ouabain-sensitive QO2. RPTC were treated with cisplatin, and samples were taken at 1, 2, 4, 8, 12, and 24 h of exposure for measurements of QO2. Ouabain-sensitive QO2 in controls did not change over the course of 24 h. Ouabain-sensitive QO2 was measured in the presence of 1.0 mm ouabain and calculated as a difference between basal and ouabain-insensitive QO2. B, the effect of cisplatin on the activity of Na+/K+-ATPase in RPTC. RPTC were treated with 50 μm cisplatin, and samples were taken at 2 and 24 h of exposure for measurements of Na+/K+-ATPase activity as described under “Experimental Procedures.” □, control RPTC treated with vehicle (Me2SO); ■, RPTC treated with 50 μm cisplatin. Results are the average ± S.E. of six independent experiments (RPTC isolations).
The activity of Na+/K+-ATPase was decreased 25 and 69% at 2 and 24 h of cisplatin exposure, respectively (Fig. 7B). These data show that the cisplatin-induced decrease in active Na+ transport in RPTC: 1) is an early event and occurs prior to any alterations in mitochondrial function, and 2) is not caused by reduced levels of intracellular ATP. These data also suggest that one of the major ATP-consuming processes (active Na+ transport) is significantly reduced early during cisplatin exposure.
Activation of PKC and ERK by Cisplatin
Fig. 8A shows that exposure of RPTC to 50 μm cisplatin was associated with the activation of PKC-α. The levels of phosphorylated PKC-α in cell homogenate increased 1.8- and 2.5-fold at 0.5 and 1 h of cisplatin exposure, respectively, and remained increased within the first 8 h of treatment (Fig. 8A). Go6976 (10 nm), an inhibitor of PKC-α, abolished the phosphorylation of PKC-α in cisplatin-treated RPTC (Fig. 8C). In contrast, cisplatin exposure had no effect on PKC-δ or PKC-ε (Fig. 8, E and F). Phosphorylated PKC-α was also present in RPTC mitochondria (Fig. 8G). However, cisplatin did not affect the phosphorylation of mitochondrial PKC-α (Fig. 8G).
Fig. 8. The effect of cisplatin on PKC-α, PKC-δ, and PKC-ε in RPTC.
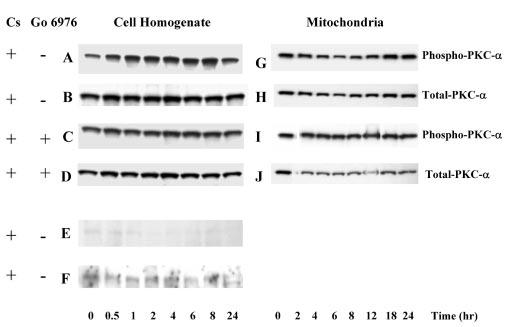
RPTC were treated with 50 μm cisplatin and samples were taken at 0, 0.5, 1, 2, 4, 6, 8, 12, 18, and 24 h for measurements of protein levels of phosphorylated (active) and total PKC-α, PKC-δ, and PKC-ε using immunoblotting. Samples were processed as described under “Experimental Procedures” and proteins separated using 10% SDSPAGE. Following electroblotting of the proteins to a nitrocellulose membrane, blots were blocked for 1 h in Tris-buffered saline containing 0.5% casein and 0.1% Tween 20, and incubated overnight at 4 °C in the presence of anti-phospho-PKC-α, anti-phospho-PKC-δ, anti-phospho-PKC-ε antibodies, or anti-PKC-α antibody diluted in the blocking buffer. Following washing, the membranes were incubated for 1 h with anti-rabbit or anti-mouse IgG coupled to horseradish peroxidase and washed again. The supersignal chemiluminescent system was used for protein detection and scanning densitometry for quantification of results. A–F, protein levels of phospho-PKC-α, phospho-PKC-δ, and phospho-PKC-ε in RPTC homogenates. G–J, protein levels of phospho-PKC-α in RPTC mitochondria. Go6976 (10 nm) was added 1 h prior to cisplatin exposure. Presented data are representative of three independent experiments (cell isolations).
Treatment of RPTC with cisplatin also resulted in the activation of ERK1/2 (Fig. 9A). Phosphorylation of ERK1/2 in the cell homogenate was increased by 50% at 0.5 h and 4-fold at 1 h of cisplatin exposure (Fig. 9, A and I). At 24 h of cisplatin treatment, the phosphorylation of ERK1/2 was increased 17-fold in comparison with controls (Fig. 9, A and I). Cisplatin exposure also induced ERK1/2 activation in RPTC mitochondria (Fig. 9E). Protein levels of active ERK1/2 were very low in the mitochondria of control RPTC but increased 4-,and 40-fold in mitochondria of cisplatin-treated RPTC at 2 and 24 h of the exposure (Fig. 9E). Total ERK1/2 protein was abundant in the mitochondria of control RPTC and was not altered by cisplatin exposure (Fig. 9G), which suggested that the increase in phosphorylated ERK1/2 levels in the mitochondria of cisplatin treated RPTC was not a result of ERK1/2 translocation to mitochondria. Pretreatment of RPTC with 50 μm PD98059 prevented the phosphorylation of ERK1/2 in cell homogenates and mitochondria isolated from cisplatin-treated RPTC (Fig. 9, B and F).
Fig. 9. Activation of ERK1/2 during cisplatin exposure in RPTC.
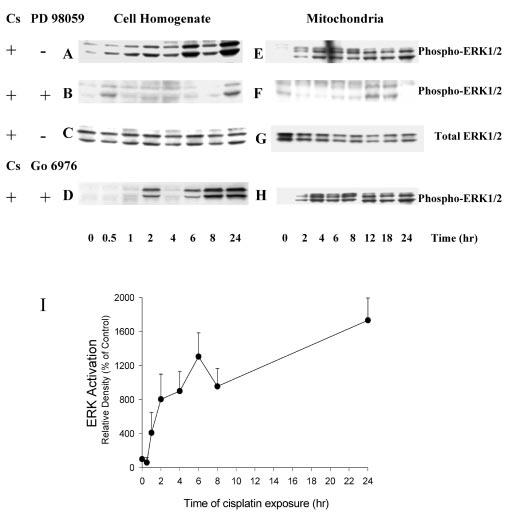
RPTC were treated with 50 μm cisplatin, and samples were taken at 0, 0.5, 1, 2, 4, 6, 8, 12, 18, and 24 h for measurements of protein levels of phosphorylated and total ERK1/2 using immunoblotting. Immunoblotting was performed as described in the legend to Fig. 8. A–D, protein levels of phospho- and total ERK1/2 in RPTC homogenates. E–H, protein levels of phospho- and total ERK1/2 in RPTC mitochondria. PD98059 (50 μm) and Go6976 (10 nm) were added 1 h prior to cisplatin treatment. Presented data are representative of three independent experiments (cell isolations). I, cisplatin-induced ERK1/2 activation quantified by densitometry. Results are the average ± S.E. of three independent experiments (RPTC isolations).
These data show that cisplatin activates PKC-α and ERK1/2 in RPTC but has no effect on PKC-δ or PKC-ε. Our results also demonstrate that cisplatin exposure results in ERK1/2 activation in RPTC mitochondria.
Effect of Inhibition of PKC-α Activation on Cisplatin-induced Changes in Mitochondrial Function and Active Na+ Transport
We have examined whether PKC-α activation is involved in mediating cisplatin-induced decreases in mitochondrial function and active Na+ transport. Treatment of RPTC with Go6976 alone for 24 h had no effect on oligomycin-sensitive QO2 (12.0 ± 0.9 versus 12.7 ± 1.4 nmol of O2/min/mg of protein in control and Go6976-treated cells, respectively), Δψm (aggregate/monomer fluorescence ratio: 1.6 ± 0.5 versus 1.5 ± 0.1 in control and Go6976-treated cells, respectively), ouabain-sensitive QO2 (8.5 ± 0.8 versus 9.1 ± 0.8 nmol of O2/min/mg of protein in control and Go6976-treated cells, respectively), and Na+/K+-ATPase activity (290 ± 6 versus 254 ± 64 milliunits/mg of protein in control and Go6976-treated cells, respectively).
Pretreatment of RPTC with Go6978 prior to cisplatin exposure had no effect on transient decreases in oligomycin-sensitive QO2 at 2 h but prevented sustained decreases in this function at 24 h of treatment (Fig. 10A). Likewise, inhibition of PKC-α activation by cisplatin had no effect on the early hyperpolarization of the mitochondrial membrane but prevented the sustained increase in Δψm at 24 h of the exposure (Figs. 4C and 10C). Consistent with the lack of effect on the early and transient mitochondrial dysfunction, inhibition of PKC-α activation did not prevent translocation of cytochrome c from mitochondria to the cytosol (data not shown). Furthermore, pretreatment of RPTC with Go6976 prevented reduction in Na+/K+-ATPase activity and ouabain-sensitive QO2 in cells treated with cisplatin for 24 h (Fig. 11, A and B). However, the initial transient decreases in Na+/K+-ATPase activity and ouabain-sensitive QO2 were independent of PKC-α activation (Fig. 11, A and B). In addition, PKC-α inhibitor did not prevent cisplatin-induced decreases in uncoupled QO2 (Fig. 10C).
Fig. 10. The effect of inhibition of PKC-α and ERK1/2 activation on transient (2 h) and sustained (24 h) changes in oxidative phosphorylation (A), electron transport rate (B), and the mitochondrial membrane potential (C) induced by cisplatin (50 μm) in RPTC.

The monolayers were treated and RPTC functions analyzed as described under “Experimental Procedures.” White columns, controls; black columns, 50 μm cisplatin; light gray columns, 50 μm PD98059 + 50 μm cisplatin; dark gray columns, 10 nm Go6976 + 50 μm cisplatin; hatched columns, 3 μm UO126 + 50 μm cisplatin; striped columns, 50 μm zVAD-fmk + 50 μm cisplatin. Results are the average ± S.E. of three to five independent experiments (RPTC isolations).
Fig. 11. The effect of inhibition of PKC-α and ERK1/2 activation on transient (2 h) and sustained (24 h) changes in ouabain-sensitive oxygen consumption (A) and Na+/K+-ATPase activity (B) induced by cisplatin (50 μm) in RPTC.

The monolayers were treated and ouabain-sensitive oxygen consumption and Na+/K+-ATPase activity analyzed as described under “Experimental Procedures.” White columns, controls; black columns, 50 μm cisplatin; light gray columns, 50 μm PD98059 + 50 μm cisplatin; dark gray columns, 10 nm Go6976 + 50 μm cisplatin. Results are the average ± S.E. of three independent experiments (RPTC isolations).
These data show that the inhibition of cisplatin-induced activation of PKC-α: 1) prevents late and sustained (24 h) but not transient (2 h) decreases in oxidative phosphorylation and active Na+ transport, 2) prevents sustained (24 h) but not transient (2 h) increases in Δψm, 3) has no effects on cisplatin-induced alterations in electron transport chain, and 4) does not block the release of cytochrome c from mitochondria. Therefore, our results show that PKC-α mediates sustained decreases in hyperpolarization of the mitochondrial membrane and oxidative phosphorylation but not the decreases in electron transfer rate. Moreover, the sustained decrease in active Na+ transport in cisplatin-treated RPTC is also mediated by PKC-α. Our data also suggest that PKC-α mediates events that occur after the release of cytochrome c from mitochondria.
Effect of Inhibition of ERK Activation on Cisplatin-induced Changes in Mitochondrial Function and Active Na+ Transport
We next addressed whether activation of ERK1/2 plays a role in the cisplatin-induced changes in mitochondrial function and active Na+ transport. RPTC were pretreated with 50 μm PD98059, a specific MEK1 inhibitor, to inhibit cisplatin-induced ERK activation. Oxidative phosphorylation, electron transport rate, Δψm, and active Na+ transport were assessed at 2 and 24 h of cisplatin exposure in PD98059-pretreated RPTC. Treatment of RPTC for 24 h with PD98059 alone had no effect on oligomycin-sensitive QO2 (12.0 ± 0.9 versus 11.5 ± 1.5 nmol of O2/min/mg of protein in control and PD98059-treated cells, respectively), Δψm (aggregate/monomer fluorescence ratio: 1.7 ± 0.4 versus 2.1 ± 0.4 in control and PD98059-treated cells, respectively), ouabain-sensitive QO2 (8.5 ± 0.8 versus 8.7 ± 1.1 nmol of O2/min/mg of protein in control and PD98059-treated cells, respectively), and Na+/K+-ATPase activity (290 ± 6 versus 291 ± 22 milliunits/mg of protein in control and PD98059-treated cells, respectively).
Treatment of RPTC with PD98059 prior to cisplatin exposure had no effect on the transient decrease in oligomycin-sensitive QO2 at 2 h but reduced sustained decreases in oligomycin-sensitive QO2 at 24 h of the exposure (Fig. 10A). Likewise, pretreatment of RPTC with ERK1/2 inhibitor prior to cisplatin exposure did not abolish the transient hyperpolarization of the mitochondrial membrane at 2 h but prevented the sustained increases in Δψm (Figs. 4B and 10C). Another MEK1 inhibitor, UO126 (3 μm), also abolished the sustained increases in Δψm in cisplatin-treated RPTC (Fig. 10C). Consistent with the lack of effect on transient mitochondrial dysfunction, inhibition of ERK1/2 activation did not prevent translocation of cytochrome c from mitochondria to the cytosol (data not shown). In contrast, inhibition of the ERK1/2 activation had no effect on cisplatin-induced decreases in the electron transport rate (Fig. 10B).
Inhibition of the ERK activation did not affect the transient decrease in ouabain-sensitive QO2 and Na+/K+-ATPase activity in cisplatin-treated RPTC but fully protected against sustained decreases in these functions (Fig. 11, A and B).
Interestingly, inhibition of PKC-α activation in cisplatin-treated RPTC did not abolish ERK1/2 phosphorylation (Fig. 9, D and H), which suggests that ERK1/2 activation by cisplatin does not occur through a PKC-α-mediated pathway.
These data demonstrate that inhibition of cisplatin-induced ERK1/2 activation: 1) reduces, in part, sustained but not transient decreases in oxidative phosphorylation; 2) prevents sustained increases in Δψm in cisplatin-treated RPTC; and 3) prevents sustained decreases in active Na+ transport. Thus, our results show that ERK1/2 mediates cisplatin effects on sustained changes in mitochondrial functions of RPTC such as hyperpolarization of the mitochondrial membrane and decreases in oxidative phosphorylation but not on the decreases in the electron transport rate. Furthermore, the sustained decrease in the active Na+ transport during cisplatin exposure is also mediated by ERK1/2. Finally, our data suggest that ERK1/2 and PKC-α mediate cisplatin-induced mitochondrial dysfunction and decreases in active Na+ transport through independent signaling pathways.
Caspase Activation
Caspase-3 cleavage and activity were evaluated to determine whether the alterations in mitochondrial function during cisplatin exposure are associated with caspase activation. No cleavage of caspase-3 was observed during the first 6 h of cisplatin exposure. The first evidence of the cleaved form of caspase-3 was found at 12 h, and the protein levels of the cleaved caspase-3 further increased at 18 and 24 h of cisplatin exposure (Fig. 6B). At 12 and 24 h of cisplatin exposure, caspase-3 activity was increased 3.9-fold (2.49 ± 0.14 nmol/h/mg of protein) and 14.3-fold (9.12 ± 1.93 nmol/h/mg of protein), respectively, in comparison with controls (0.64 ± 0.27 nmol/h/mg of protein). Pretreatment of RPTC with 50 μm PD98059 prior to cisplatin exposure abolished caspase-3 cleavage and decreased caspase-3 activity by 44% at 24 h of cisplatin treatment (Figs. 6C and 12A). Similarly, pretreatment with another specific MEK inhibitor, UO126, decreased cisplatin-induced caspase-3 activity by 36% at 24 h of the exposure (Fig. 12A). Likewise, the pretreatment of cells with Go6978 (PKC-α inhibitor) abolished cisplatin-induced caspase-3 cleavage and decreased caspase-3 activity by 38% (Figs. 6D and 12B). We also addressed whether caspase activation plays a role in cisplatin-induced hyperpolarization of the mitochondrial membrane. Pretreatment of RPTC with caspase inhibitor, 50 μm zVAD-fmk, prior to cisplatin treatment inhibited caspase-3 activation (Fig. 12B) but did not prevent increases in Δψm (Fig. 10C).
These data show that: 1) cisplatin exposure activates caspase-3, 2) inhibition of ERK1/2 and PKC-α activation decreases cisplatin-induced caspase-3 activation, and 3) inhibition of caspase activation does not block mitochondrial membrane hyperpolarization.
Assessment of Cell Death
Cisplatin exposure induced changes in the RPTC nuclear morphology consistent with apoptosis. Treatment of RPTC with cisplatin for 24 h resulted in chromatin condensation and nuclear fragmentation in 44.7 ± 3.6% cells present in the monolayers (versus 3.0 ± 0.6% in Me2SO-treated controls) (Fig. 13, A and B; Table I). These changes were preceded by caspase-3 activation (12 h) and sustained increases Δψm (starting at 12 h). The inhibition of ERK activation (using PD98059) prior to cisplatin exposure decreased the number of apoptotic cells to 12.0 ± 0.6% (Fig. 13D; Table I). The inhibition of PKC-α activation (using Go6976) prior to cisplatin treatment resulted in a decrease in RPTC apoptosis to 18.0 ± 4.6% (Fig. 13F; Table I). The exposure of RPTC to PD98059 or Go6976 alone for 24 h had no effects on nuclear morphology and cell viability (Fig. 13, C and E; Table I). Pretreatment with a general caspase inhibitor, 50 μm zVADFMK, did not protect against cisplatin-induced apoptosis in RPTC (data not shown).
Fig. 13. Cisplatin-induced alterations in nuclear morphology in RPTC.

At 24 h of cisplatin exposure, RPTC monolayers were fixed in 3.7% formaldehyde, incubated in the presence of 8 μm DAPI for 2 h at room temperature, and evaluated under Zeiss fluorescent microscope (Axioskop). Pictures were taken using Hamamatsu color chilled 3CCD digital camera. A, control; B, 50 μm cisplatin; C, 50 μm PD98059; D, 50 μm PD98059 + 50 μm cisplatin; E, 10 nM Go6976; F, 10 nm Go6976 + 50 μm cisplatin. Presented data are representative of three independent experiments (cell isolations). Original magnification, ×400.
Table I.
Percentage of nuclear condensation and fragmentation at 24 h of cisplatin exposure in RPTC
Values with different letters (a, b, c) are significantly different (P <0.05) from each other.
| Treatment | % |
|---|---|
| Control | 3.0 ± 0.6a |
| 50 μm cisplatin | 44.7 ± 3.6b |
| 50 μm PD98059 | 7.0 ± 2.9a |
| 50 μm PD98059 + 50 μm cisplatin | 12.0 ± 0.6c |
| 10 nm Go6976 | 3.8 ± 1.6a |
| 10 nm Go6976 + 50 μm cisplatin | 18.0 ± 4.6c |
DISCUSSION
The mechanisms and pathway(s) leading to cisplatin-induced RPTC apoptosis, including the effects of cisplatin on RPTC mitochondria and the role of mitochondrial dysfunction in cisplatin nephrotoxicity, have not been elucidated. Therefore, we examined whether cisplatin, used at pharmacological concentrations, induces mitochondrial dysfunction and activates the mitochondrial stress pathway that leads to apoptosis. Our results demonstrated that oxidative phosphorylation and the electron transport chain were the mitochondrial targets of cisplatin and suggested that the decrease in oxidative phosphorylation was a result of the inhibition of mitochondrial F0F1-ATPase activity. The decreases in RPTC oxidative phosphorylation and electron transport rate were accompanied by hyperpolarization of the mitochondrial membrane. Our observation is in contrast with reports showing that apoptosis is associated with a decrease in Δψm caused by unrestrained opening of the mitochondrial permeability transition pore (MPTP), which results in the release of proapoptotic proteins from the mitochondrial intermembrane space to the cytoplasm and activation of caspases (42-44). It has also been suggested that cisplatin causes a decline in Δψm and opening of MPTP in RPTC as assessed by rhodamine 123 uptake (33, 45). However, these studies used a high concentration of cisplatin (2 mm) that causes oncosis and mitochondrial depolarization rather than apoptosis. The concentration of cisplatin used in our experiments (50 μm) resulted in RPTC apoptosis, and this event was preceded by sustained hyperpolarization of the mitochondrial membrane as demonstrated by both flow cytometry and fluorescent microscopy.
Recent studies suggest that the initiation of apoptotic events is not always associated with MPTP but, in some cases, with mitochondrial membrane hyperpolarization and mitochondrial shrinkage (46, 47). Apoptosis caused by the withdrawal of growth factors or interlukin-3 from cultured cells is associated with cytosolic acidification and hyperpolarization of the inner mitochondrial membrane, which are dependent on ATP synthase activity (48, 49). Furthermore, staurosporine-induced apoptosis in neuronal cells is associated with hyperpolarization of the mitochondrial inner membrane, which precedes the release of cytochrome c (46, 50). Dissipation of mitochondrial K+ and H+ gradients inhibits staurosporine-induced cytochrome c release and attenuates apoptosis (46). In most eukaryotic cells, Δψm is generated by the respiratory chain or through ATP-dependent reversal of mitochondrial ATP synthase. The energy released by the electron transport pumps protons across the mitochondrial inner membrane, generating an electrochemical and pH gradient. Our results suggest that the increase in proton gradient was not generated by an accelerated rate of electron transport but was caused by decreased activity of H+ pump of F0F1-ATPase. This decrease preceded the increase in Δψm and the decrease in electron flow rate through the respiratory chain. Hyperpolarization of the inner mitochondrial membrane could be explained by the inability of F0F1-ATPase to efficiently pump protons back into the mitochondrial matrix through the proton channel of ATP synthase. This would result in the accumulation of protons in the cytoplasm and an increase in the proton gradient between the mitochondrial matrix and the intermembrane space.
An alternative mitochondrial mechanism that leads to an increase in Δψm is the closure of the voltage-dependent anion channel (VDAC) localized on the outer mitochondrial membrane (51). The closure of VDAC results in a loss of permeability of the outer mitochondrial membrane to various ions, limits metabolite flux across the outer membrane, inhibits mitochondrial respiration and oxidative phosphorylation, and causes mitochondrial hyperpolarization (52, 53). Persistent loss of the outer membrane permeability leads to a disruption of the mitochondrial membrane ion homeostasis, loss of the membrane integrity, cytochrome c redistribution to the cytosol, and apoptosis (52). VDAC closure causes hyperpolarization of the mitochondrial membrane, release of cytochrome c, and apoptosis in fibroblasts following growth factor withdrawal (48). Bcl-xL prevents apoptosis through promoting the open configuration of VDAC, which suggests that maintenance of the outer mitochondrial membrane permeability is necessary for cell survival (53). An inhibitory effect of cisplatin on VDAC could explain both the decreased oxidative phosphorylation and the elevated Δψm in cisplatin-treated RPTC.
Another possible explanation for the increase in Δψm is the disruption of RPTC mitochondrial ion and volume homeostasis by cisplatin. It is possible that alterations in cytosolic K+, Na+, and/or H+ concentrations contributed to the hyperpolarization of the mitochondrial membrane. Our results demonstrate that a marked decrease in active Na+ transport (and Na+/K+-ATPase activity) paralleled the decrease in F0F1-ATPase activity and preceded increases in Δψm in cisplatin-treated RPTC. Such a large decrease in Na+/K+-ATPase activity would cause a rapid decrease in cytosolic K+ and an increase in cytosolic Na+ concentrations, and lead to increases in cytosolic H+ concentration. Because ouabain-sensitive QO2 in cisplatin-treated RPTC was decreased prior to mitochondrial dysfunction and the increase in Δψm, it is likely that the changes in cytosolic ion levels preceded and drove the subsequent changes in the mitochondrial membrane potential. However, it is unlikely that these changes were the sole mechanism of increased Δψm because Δψm recovered at 4 h, whereas active Na+ transport remained decreased at this time point of cisplatin exposure.
Cytochrome c release from the mitochondria followed the early and transient increase in Δψm but preceded sustained hyperpolarization of the mitochondrial membrane. This suggests that the release of cytochrome c does not affect integrity of the inner mitochondrial membrane. However, oxidative phosphorylation and electron transport rate persistently decreased following cytochrome c redistribution, most likely because of insufficient amounts of cytochrome c to maintain respiration. The release of cytochrome c following mitochondrial hyperpolarization has also been shown in other cell types (46, 48). The exposure of neuronal cells to staurosporine induces hyperpolarization of the mitochondrial membrane, which is followed by the release of cytochrome c and caspase-3 activation without any effect on cellular ATP levels (46). Mitochondrial depolarization inhibits staurosporine-induced cytochrome c release (46). Thus, the data suggest that the hyperpolarization of the mitochondrial membrane may be a general phenomenon that precedes the activation of the caspase cascade and chemical-induced apoptosis in certain cell types.
Recent literature suggests that intracellular signaling pathways directly and indirectly regulate mitochondrial membrane stability and functions, and the apoptotic fate of a cell. Activation of PKC-δ in some cell types initiates an apoptotic pathway that involves PKC-δ translocation, direct interaction with mitochondria, and alteration of Δψm (54). The roles of PKC-α and ERK1/2 signaling in regulating cell death and survival during exposure to various stresses and drugs have been under intensive investigation. Activation of ERK pathway has been associated with protection against oxidant-induced death in proximal tubules by providing survival signals (55). Our study shows that cisplatin activates ERK1/2 and PKC-α but not PKC-δ or PKC-ε in RPTC and that PKC-α and ERK1/2 activation is involved in the mechanism regulating the late and sustained decrease in oxidative phosphorylation and the mitochondrial membrane hyperpolarization. Cisplatin exposure also activates ERK1/2 in RPTC mitochondria. Because ERK1/2 inhibition only partially restores oxidative phosphorylation, we conclude that ERK1/2 signaling pathway is not the sole mechanism involved in cisplatin-induced mitochondrial dysfunction. The fact that inhibition of PKC-α and ERK1/2 prevents cisplatin-induced sustained decreases in oxidative phosphorylation and the mitochondrial membrane hyperpolarization but does not block decreases in electron transport rate suggests that PKC-α and/or ERK1/2 activation is involved in decreasing activity of ATP synthase rather than affecting the complexes of the respiratory chain. Likewise, ERK1/2 and PKC activation prior to cisplatin treatment accelerates the mitochondrial membrane hyperpolarization and mitochondrial dysfunction during the exposure to this antineoplastic agent (data not shown).
Our understanding of the mechanisms that regulate F0F1-ATPase activity is still very limited. However, it is known that the 14-3-3 proteins regulate F0F1-ATPase activity through a direct interaction with its F1 β-subunit, which is dependent on phosphorylation of the 14-3-3 binding domain at the serine/threonine residues (56). The interaction of 14-3-3 protein with F0F1-ATPase results in a decrease in F0F1-ATPase activity (56). 14-3-3 proteins are transient mediators of phosphorylation and regulation of other proteins and are activated through phosphorylation by PKC-α, -β, -γ, -δ, and -ζ (57, 58). Although not tested in our study, it is likely that PKC-α and/or ERK1/2 also phosphorylate 14-3-3 proteins in RPTC, which bind and inhibit F0F1-ATPase and increase the Δψm during cisplatin exposure. Furthermore, it has been shown that β-subunit of F0F1-ATPase is phosphorylated by some protein kinases (59). Thus, it is possible that PKC-α and/or ERK1/2 phosphorylate one of the subunits of F0F1-ATPase and regulate its activity.
It is also possible that PKC-α and/or ERK1/2 regulate Δψm in RPTC through other mechanisms such as disruption of ion homeostasis. Cell shrinkage and the loss of intracellular K+ are early necessary features of apoptosis. Cisplatin induces decreases in RPTC active Na+ transport as a result of the inhibition of Na+/K+-ATPase activity. Such a pronounced decrease in Na+/K+-ATPase is associated with decrease in intracellular K+ concentration. These events are mediated through a PKC-α- and ERK1/2-dependent mechanism because the inhibition of PKC-α and ERK1/2 activation restores active Na+ transport in cisplatin-treated RPTC. This is a result, at least in part, of restoration of Na+/K+-ATPase activity in RPTC treated with PKC-α and ERK1/2 inhibitors prior to cisplatin exposure. Thus, our results suggest that PKC-α and ERK1/2 regulate Na+/K+-ATPase activity in RPTC, which is consistent with a previous report showing that Ca2+-dependent isozymes of PKC phosphorylate catalytic α1 subunit of renal Na+/K+-ATPase and that this phosphorylation inhibits Na+/K+-ATPase activity (60).
Similar effects of the inhibition of PKC-α and ERK1/2 on cisplatin-induced mitochondrial dysfunction, decreases in active Na+ transport, and RPTC apoptosis suggested that PKC-α may act upstream of ERK1/2. However, inhibition of PKC-α activation did not block the increase in ERK1/2 phosphorylation by cisplatin, which demonstrated that PKC-α did not mediate its effects through ERK1/2 activation. Thus, our study suggests that PKC-α and ERK1/2 mediate cisplatin-induced mitochondrial dysfunction, decreases in active Na+ transport, caspase-3 activation, and RPTC apoptosis through independent pathways. It is yet unknown whether ERK1/2 mediates cisplatin-induced changes in mitochondrial function directly or through activation of downstream effectors. However, the fact that ERK1/2 activation can provide death or survival signals depending on the mechanism of cell death (oncosis versus apoptosis) suggests that ERK1/2 can activate different intra-cellular pathways that regulate cell fate. Our results also suggest that the early and transient alterations in mitochondrial functions and active Na+ transport are mediated through a different, PKC-α- and ERK1/2-independent mechanism.
Because the inhibition of PKC-α and ERK1/2 activation does not block the release of cytochrome c from mitochondria but decreases caspase-3 activation, we conclude that PKC-α and ERK1/2 are involved in the regulation of cisplatin-induced caspase-3 activation downstream of cytochrome c. Earlier reports have shown the existence of post-cytochrome c regulation of apoptosis that is associated with the lack of caspase activation in the presence of cytochrome c in the cytoplasm (61, 62). Furthermore, these studies showed involvement of ERK1/2 in this regulation and suggested that ERK1/2 may modulate the formation or function of the apoptosome (61, 62). Our data are consistent with these reports and show that PKC-α and ERK1/2 inhibition decreases caspase-3 activation without blocking cytochrome c release into the cytoplasm. However, our results suggest that PKC-α and ERK1/2 do not mediate cisplatin-induced apoptosis through caspase-3 activation. Caspases do not appear to play a major role in the cisplatin-induced apoptosis of RPTC, as the general caspase inhibitor, zVADfmk, does not block cisplatin toxicity despite inhibition of caspase activity. These data suggest that cisplatin-induced apoptosis in RPTC is caspase-independent and that other factors of mitochondrial origin are involved in this process. Our data suggest that the protective effects of PKC-α and ERK1/2 inhibition on maintaining mitochondrial function and decreasing RPTC apoptosis were rather associated with attenuation of sustained decreases in Na+/K+-ATPase activity and active Na+ transport, thus preventing loss of intracellular K+.
In conclusion, this study shows that a transient and sustained hyperpolarization of the mitochondrial membrane and decreases in mitochondrial respiration and active Na+ transport precede cisplatin-induced apoptosis in renal proximal tubular cells. The transient mitochondrial changes lead to cytochrome c release from mitochondria and are not mediated by PKC-α or ERK1/2-dependent mechanisms. In contrast, the sustained decreases in mitochondrial function and active Na+ transport that lead to apoptosis are mediated by ERK1/2 and PKC-α but through different signaling pathways. We also conclude that caspase activation is not the primary mechanism by which cisplatin induces apoptosis in RPTC. This study shows that maintaining mitochondrial function and integrity in RPTC is important for protection from cisplatin-induced apoptosis.
Acknowledgments
I thank Diana Bakajsova and Malinda L. Godwin for excellent technical assistance and Ashley B. Whitlow for assistance with flow cytometry.
* This work was supported by American Cancer Society Institutional Research Grant IRG-91-021-08 and National Institutes of Health NIDDK Grant R01DK59558. The costs of publication of this article were defrayed in part by the payment of page charges. This article must therefore be hereby marked “advertisement” in accordance with 18 U.S.C. Section 1734 solely to indicate this fact.
Footnotes
The abbreviations used are: RPTC, renal proximal tubular cells; PARP, poly(ADP-ribose) polymerase; MEK, mitogen-activated kinase kinase; ERK, extracellular signal-regulated kinase; PKC, protein kinase C; JC-1, 5,5′,6,6′-tetrachloro-1,1′,3,3′-tetraethylbenzimidazolylcarbocyanine iodide; DAPI, 4′,6-diamidino-2-phenylindole dihydrochloride; AFC, 7-amino-4-trifluoromethylcoumarin; QO2, oxygen consumption; FCCP, carbonyl cyanide p-(trifluoromethoxy)phenylhydrazone; PBS, phosphate-buffered saline; ΔΨm, mitochondrial membrane potential; MPTP, mitochondrial permeability transition pore; VDAC, voltage-dependent anion channel; zVAD-fmk, benzyloxycarbonyl-Val-Ala-Asp-fluoromethylketone.
REFERENCES
- 1.Goldstein RS, Mayor GH. Life Sci. 1983;32:685–690. doi: 10.1016/0024-3205(83)90299-0. [DOI] [PubMed] [Google Scholar]
- 2.Safirstein RL, Winston J, Moel D, Dikman S, Guttenplan J. Int. J. Androl. 1987;10:325–346. doi: 10.1111/j.1365-2605.1987.tb00200.x. [DOI] [PubMed] [Google Scholar]
- 3.Miura K, Goldstein RS, Pasino DA, Hook JB. Toxicology. 1987;44:147–158. doi: 10.1016/0300-483x(87)90145-4. [DOI] [PubMed] [Google Scholar]
- 4.Ikeda S, Fukuzaki A, Kaneto H, Ishidoya S, Orikasa S. Int. J. Urol. 1999;6:245–250. doi: 10.1046/j.1442-2042.1999.00058.x. [DOI] [PubMed] [Google Scholar]
- 5.Osman AM, El-Sayed EM, El-Demerdash E, Al-Hyder A, El-Didi M, Attia AS, Hamada FM. Pharm. Res. 2000;41:115–121. doi: 10.1006/phrs.1999.0569. [DOI] [PubMed] [Google Scholar]
- 6.Chopra S, Kauffman JS, Jones TW, Hong WK, Gehr MK, Hamburger RJ, Flamenbaum W, Trump GF. Kidney Int. 1982;21:54–64. doi: 10.1038/ki.1982.8. [DOI] [PubMed] [Google Scholar]
- 7.Levi J, Jacobs C, Kalman SB, Mctigue M, Weiner MW. J. Pharmacol. Exp. Ther. 1980;213:545–550. [PubMed] [Google Scholar]
- 8.Leibrandt MEI, Wolfgang GHI, Metz AL, Ozobia AA, Haskins JR. Kidney Int. 1995;48:761–770. doi: 10.1038/ki.1995.348. [DOI] [PubMed] [Google Scholar]
- 9.Brady HR, Kone BC, Stromski ME, Zeidel ML, Giebisch G, Gullans SR. Am. J. Physiol. 1990;258:F1181–F1187. doi: 10.1152/ajprenal.1990.258.5.F1181. [DOI] [PubMed] [Google Scholar]
- 10.Hanigan HH, Gallagher BC, Taylor PT, Jr., Large MK. Cancer Res. 1994;54:5925–2929. [PubMed] [Google Scholar]
- 11.Van de Water B, Tijdens IB, Verbrugge A, Huisloot M, Dihal AA, Stevens JL, Jaken S, Mulder GJ. J. Biol. Chem. 2000;275:25805–25813. doi: 10.1074/jbc.M001680200. [DOI] [PubMed] [Google Scholar]
- 12.Shiraishi Y, Nagai J, Murakami T, Takano M. Life Sci. 2000;67:1047–1058. doi: 10.1016/s0024-3205(00)00704-9. [DOI] [PubMed] [Google Scholar]
- 13.Lau AH. Kidney Int. 1999;56:1295–1298. doi: 10.1046/j.1523-1755.1999.00687.x. [DOI] [PubMed] [Google Scholar]
- 14.Okuda M, Masaki K, Fukatsu S, Hashimoto Y, Inui K. Biochem. Pharmacol. 2000;59:195–201. doi: 10.1016/s0006-2952(99)00303-2. [DOI] [PubMed] [Google Scholar]
- 15.Eastman A. Cancer Cells. 1990;2:275–280. [PubMed] [Google Scholar]
- 16.Zhan Y, van der Water B, Wang Y, Stevens JL. Oncogene. 1999;18:6505–6512. doi: 10.1038/sj.onc.1203060. [DOI] [PubMed] [Google Scholar]
- 17.Kruidering M, van de Water B, Zhan Y, Baelde JJ, de Heer E, Mulder GJ, Stevens JL, Nagelkerke JF. Cell Death Diff. 1998;5:601–614. doi: 10.1038/sj.cdd.4400392. [DOI] [PubMed] [Google Scholar]
- 18.Sener G, Satiroglu H, Kabasakal L, Arbak S, Oner S, Ercan F, Keyer-Uysa M. Fund. Clin. Pharmacol. 2000;14:553–560. doi: 10.1111/j.1472-8206.2000.tb00440.x. [DOI] [PubMed] [Google Scholar]
- 19.Somani SM, Husain K, Whitworth C, Trammell GL, Malafa M, Rybak LP. Pharmacol. Toxicol. 2000;86:234–241. doi: 10.1034/j.1600-0773.2000.d01-41.x. [DOI] [PubMed] [Google Scholar]
- 20.Henkels KM, Turchi JJ. Cancer Res. 1999;59:3077–3083. [PubMed] [Google Scholar]
- 21.Melendez-Zajgla J, Cruz E, Maldonado V, Espinoza AM. Biochem. Mol. Biol. Int. 1999;47:765–771. doi: 10.1080/15216549900201853. [DOI] [PubMed] [Google Scholar]
- 22.Evans RM, Simpkins H. Exp. Cell Res. 1998;245:69–78. doi: 10.1006/excr.1998.4250. [DOI] [PubMed] [Google Scholar]
- 23.Dong Y, Berners-Price SJ, Thornburn DR, Antalis T, Dickinson J, Hurst T, Qiu L, Khoo SK, Parsons PG. Biochem. Pharmacol. 1997;53:1673–1682. doi: 10.1016/s0006-2952(97)00015-4. [DOI] [PubMed] [Google Scholar]
- 24.Kojima H, Endo K, Moriyama H, Tanaka Y, Alnemri ES, Slapak CA, Teicher B, Kufe D, Datta R. J. Biol. Chem. 1998;273:16647–16650. doi: 10.1074/jbc.273.27.16647. [DOI] [PubMed] [Google Scholar]
- 25.Zhang JG, Lindup WE. Biochem. Pharmacol. 1993;45:2215–2222. [PubMed] [Google Scholar]
- 26.Tkacova E, Kuzela S. Neoplasma. 1985;32:679–683. [PubMed] [Google Scholar]
- 27.Persons DL, Yazlovitskaya EM, Cui W, Pelling JC. Clin. Cancer Res. 1999;5:1007–1014. [PubMed] [Google Scholar]
- 28.Sanchez-Perez I, Perona R. FEBS Lett. 1999;453:151–158. doi: 10.1016/s0014-5793(99)00690-0. [DOI] [PubMed] [Google Scholar]
- 29.Wang X, Martindale JH, Holbrook NJ. J. Biol. Chem. 2000;275:39435–39443. doi: 10.1074/jbc.M004583200. [DOI] [PubMed] [Google Scholar]
- 30.Fuchs SY, Adler V, Buschmann T, Yin Z, Wu X, Jones SN, Roni Z. Genes Dev. 1998;12:2658–2663. doi: 10.1101/gad.12.17.2658. [DOI] [PMC free article] [PubMed] [Google Scholar]
- 31.Persons DL, Yazlovitskaya EM, Pelling JC. J. Biol. Chem. 2000;275:35778–35785. doi: 10.1074/jbc.M004267200. [DOI] [PubMed] [Google Scholar]
- 32.Basu A, Akkaraju GR. Biochemistry. 1999;38:4245–4250. doi: 10.1021/bi982854q. [DOI] [PubMed] [Google Scholar]
- 33.Zhang JG, Lindup WE. Toxicol. Lett. 1996;89:11–17. doi: 10.1016/s0378-4274(96)03776-9. [DOI] [PubMed] [Google Scholar]
- 34.Nowak G, Schnellmann RG. Am. J. Physiol. 1996;271:C2072–C2080. doi: 10.1152/ajpcell.1996.271.6.C2072. [DOI] [PubMed] [Google Scholar]
- 35.Lash LH, Sall JM. Methods in Toxicology. Vol. 2. Academic Press; Orlando: 1993. pp. 8–28. [Google Scholar]
- 36.Law RHP, Manon S, Devenish RJ, Nagley P. Methods Enzymol. 1995;260:133–190. doi: 10.1016/0076-6879(95)60135-x. [DOI] [PubMed] [Google Scholar]
- 37.Nowak G, Carter CA, Schnellmann RG. Toxicol. Appl. Pharmacol. 2000;167:37–45. doi: 10.1006/taap.2000.8986. [DOI] [PubMed] [Google Scholar]
- 38.Laemmli UK. Nature. 1970;227:680–685. doi: 10.1038/227680a0. [DOI] [PubMed] [Google Scholar]
- 39.Nieminen AL, Petrie TG, Lemasters JJ, Selman WR. Neuroscience. 1996;75:993–997. doi: 10.1016/0306-4522(96)00378-8. [DOI] [PubMed] [Google Scholar]
- 40.Di Lisa F, Blank PS, Colonna R, Gambassi G, Silverman HS, Stern MD, Hansford RG. J. Physiol. 1995;486:1–13. doi: 10.1113/jphysiol.1995.sp020786. [DOI] [PMC free article] [PubMed] [Google Scholar]
- 41.Duchen MR, McGuinness O, Brown LA, Crompton M. Cardiovasc. Res. 1993;27:1790–1794. doi: 10.1093/cvr/27.10.1790. [DOI] [PubMed] [Google Scholar]
- 42.Chanda B, Mathew MK. Biochim. Biophys. Acta. 1999;1416:92–100. doi: 10.1016/s0005-2736(98)00217-x. [DOI] [PubMed] [Google Scholar]
- 43.White RJ, Reynolds IJ. J. Neurosci. 1996;16:5688–5697. doi: 10.1523/JNEUROSCI.16-18-05688.1996. [DOI] [PMC free article] [PubMed] [Google Scholar]
- 44.Dzeja PP, Holmuhamedov EL, Ozcan C, Pucar D, Jahangir A, Terzic A. Circ. Res. 2001;89:744–746. [PubMed] [Google Scholar]
- 45.Kruidering M, Maasdam DH, Prins FA, de Heer E, Mulder GJ, Nagelkerke JF. Exp. Nephrol. 1994;2:324–344. [PubMed] [Google Scholar]
- 46.Poppe M, Reimertz C, Dußmann H, Krohn AJ, Leutjens CM, Bockelmann D, Nieminen AL, Kogel D, Prehn JHM. J. Neurosci. 2001;21:4551–4563. doi: 10.1523/JNEUROSCI.21-13-04551.2001. [DOI] [PMC free article] [PubMed] [Google Scholar]
- 47.Khaled AR, Reynolds DA, Young HA, Thompson CB, Muegge K, Durum SK. J. Biol. Chem. 2001;276:6453–6462. doi: 10.1074/jbc.M006391200. [DOI] [PubMed] [Google Scholar]
- 48.Gottlob K, Majewski N, Kennedy S, Kandel E, Robey RB, Hay N. Genes Dev. 2001;15:1406–1418. doi: 10.1101/gad.889901. [DOI] [PMC free article] [PubMed] [Google Scholar]
- 49.Matsuyama S, Llopis J, Deveraux QL, Tsien RY, Reed JC. Nat. Cell Biol. 2000;2:318–325. doi: 10.1038/35014006. [DOI] [PubMed] [Google Scholar]
- 50.Scarlett JL, Sheard PW, Hughes G, Ledgerwood EC, Ku HH, Murphy MP. FEBS Lett. 2000;475:267–272. doi: 10.1016/s0014-5793(00)01681-1. [DOI] [PubMed] [Google Scholar]
- 51.Vander Heiden MG, Thomson CB. Nat. Cell Biol. 1999;1:E209–E216. doi: 10.1038/70237. [DOI] [PubMed] [Google Scholar]
- 52.Vander Heiden MG, Chandel NS, Li XX, Schumacker PT, Colombini M, Thompson CB. Proc. Natl. Acad. Sci. U. S. A. 2000;97:4666–4671. doi: 10.1073/pnas.090082297. [DOI] [PMC free article] [PubMed] [Google Scholar]
- 53.Vander Heiden MG, Li XX, Gottleib E, Hill RB, Thompson CB, Colombini M. J. Biol. Chem. 2001;276:19414–19419. doi: 10.1074/jbc.M101590200. [DOI] [PubMed] [Google Scholar]
- 54.Li L, Lorenzo PS, Bogi K, Blumberg PM, Yuspa SH. Mol. Cell. Biol. 1999;19:8547–8558. doi: 10.1128/mcb.19.12.8547. [DOI] [PMC free article] [PubMed] [Google Scholar]
- 55.di Mari JF, Davis R, Safirstein RL. Am. J. Physiol. 1999;277:F195–F203. doi: 10.1152/ajprenal.1999.277.2.F195. [DOI] [PubMed] [Google Scholar]
- 56.Bunney TD, van Walraven HS, de Boer AH. Proc. Natl. Acad. Sci. U. S. A. 2001;98:4249–4254. doi: 10.1073/pnas.061437498. [DOI] [PMC free article] [PubMed] [Google Scholar]
- 57.Autieri MV, Carbone CJ. DNA Cell Biol. 1999;18:555–564. doi: 10.1089/104454999315105. [DOI] [PubMed] [Google Scholar]
- 58.Van der Hoeven PCJ, van der Wal JCM, Ruurs P, van Dijk MCM, van Blitterswijk WJ. Biochem. J. 2000;345:297–306. doi: 10.1042/0264-6021:3450297. [DOI] [PMC free article] [PubMed] [Google Scholar]
- 59.Kanekatsu M, Saito H, Motohashi K, Hisabori T. Biochem. Mol. Biol. Int. 1998;46:99–105. doi: 10.1080/15216549800203602. [DOI] [PubMed] [Google Scholar]
- 60.Kazanietz MG, Caloca MJ, Aizman O, Nowicki S. Arch. Biochem. Biophys. 2001;388:74–80. doi: 10.1006/abbi.2000.2264. [DOI] [PubMed] [Google Scholar]
- 61.Erhardt P, Schremser EJ, Cooper GM. Mol. Cell. Biol. 1999;19:5308–5315. doi: 10.1128/mcb.19.8.5308. [DOI] [PMC free article] [PubMed] [Google Scholar]
- 62.Tashker JS, Olson M, Kornbluth S. Mol. Biol. 2002;13:393–401. doi: 10.1091/mbc.01-06-0291. [DOI] [PMC free article] [PubMed] [Google Scholar]