Abstract
The interaction of a lithotripter shock wave (LSW) with laser-generated single vapor bubbles in water is investigated using high-speed photography and pressure measurement via a fiber-optic probe hydrophone. The interaction leads to nonspherical collapse of the bubble with secondary shock wave emission and microjet formation along the LSW propagation direction. The maximum pressure amplification is produced during the collapse phase of the bubble oscillation when the compressive pulse duration of the LSW matches with the forced collapse time of the bubble.
Introduction
When a shock wave impinges on a cavitation bubble, the interaction may lead to pressure amplification due to forced collapse and results in directional jet formation as a consequence of the asymmetric deformation of the bubble [1,2]. Both consequences are of great importance for a diverse range of applications, from the longstanding investigation of cavitation erosion on ship propellers and hydraulic pipelines [2–4] to modern applications of ultrasound in therapeutic medicine, such as shock wave lithotripsy and macromolecule delivery [2,5,6]. To gain a mechanistic insight of the interaction, experiments utilizing single air bubbles stabilized on a boundary or pulsed electrolysis-generated stream of bubbles have been carried out [1,2,7]. In addition, microsecond tandem shock waves have been used to generate in situ shock wave-inertial bubble interaction in a well-controlled volume. With appropriate combinations of pressure amplitude and interpulse delay, this technique has been shown to significantly improve stone comminution and macromolecular delivery [5,6]. Further, the collapse of a vapor-filled inertial bubble by a shock wave may generate higher energy concentrations than its gas-filled counterpart [8,9]. Despite this, the optimal shock wave profile and pulse combination for in situ shock wave-inertial bubble interaction have not been established. This is in part due to the random variation of cavitation inception in water by acoustic pulses and the inherent complexity of the multibubble systems used in previous studies.
In this work, the interaction of lithotripter shock wave (LSW) with laser-generated single vapor bubbles in water is investigated. Because of the consistency in single bubble generation, the dynamics of shock wave-inertial bubble interaction at different phases of the bubble oscillation can be investigated, and the optimal interpulse delay for producing the strongest collapse of the bubble by a LSW can be determined.
Experimental apparatus and methods
A schematic diagram of the experimental setup is shown in Fig. 1. A Q-switched Nd:YAG laser with λ = 1064 nm and pulse duration = 5 ns (Tempest 10, New Wave Research) was focused into a water tank (30 × 40 × 15 cm) to generate a single cavitation bubble via optical breakdown [10,11]. The laser was aligned horizontally with its beam focus coinciding with the focal point of a piezoelectric shock wave generator (FB12, Richard Wolf), operated at 75% of its maximum output setting. The typical pressure waveform of the LSW generated by the FB12 in water (20°C) is comprised of a leading compressive wave with a peak pressure of 39 MPa and a pulse duration of 1 µs, followed by a trailing tensile wave of −8 MPa in peak pressure with a pulse duration of ∼2 µs.
FIG. 1.
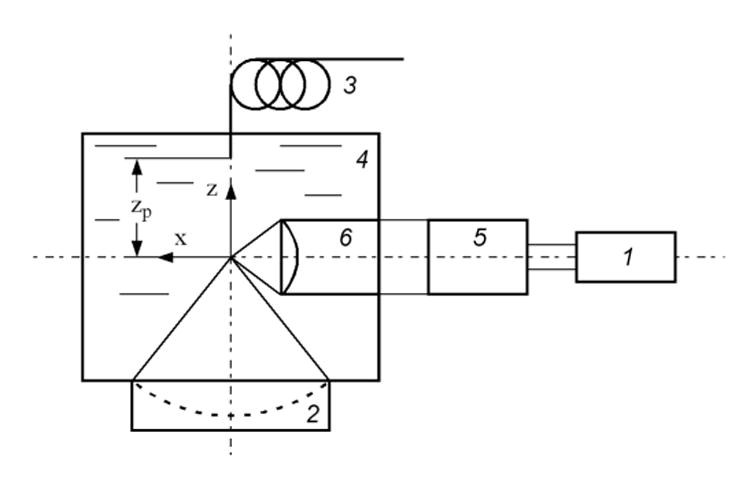
A schematic diagram of the experimental setup. 1. Q-switched Nd-YAG laser, 2. piezoelectric shock wave generator, 3. optic fiber of the FOPH 500 mounted on a 3D translation stage, 4. water tank, 5. beam expander, 6. focusing lens.
The dynamics of laser-induced single bubble and LSW-bubble interaction were captured using an ultra-high-speed imaging system (Imacon 200, DRS Hadland), combined with a long-distance microscope (K2, Infinity) and a 5x objective lens. In this study, the Imacon 200 was running at a framing rate of 2 million frames/s with up to 12 frames in each sequence. A fiber-optic coupled Xenon flashlamp (ML-1000, Dyna-Lite) was used for illumination and shadowgraph imaging. The shock waves generated by the inertial collapse of laser-induced bubble and LSW-bubble interaction were measured by using a fiber-optic probe hydrophone (FOPH-500, RP acoustics) connected to a 100 MHz digital oscilloscope (TDS 2014, Tektronix). The 100 µm probe tip of the FOPH-500 was placed along the central axis of the shock wave source at a distance zp above the focus (Fig. 1). Two digital delay generators (DG 535, Stanford Research Systems) were used to trigger the shock wave source, the laser, and the high-speed camera, respectively.
To ensure consistency in single spherical bubble generation, the lowest possible laser energy that can produce an optical breakdown in water was used. Based on ten measurements, the shock wave emitted by the collapse of the bubble measured at a distance of zp = 1.1 mm has a peak pressure Pc = 4.8 ± 0.3 MPa with a full width at half maximum (FWHM) τc = 28 ± 8 ns (collapse time of the bubble is Tc = 57.2 ± 0.8 µs). The measurement data was fitted into a Raleigh-Plesset model for a laser-induced spherical bubble [8], from which the temporal variations in bubble diameter and wall velocity were calculated [ Figs. 2(a) and 2(b)]. Using this theoretical prediction, a pair of delay times could be determined prior to the experiment for each given bubble size, but with opposite wall velocity [Fig. 2(a) ]. In general, the bubbles are classified into one of the three categories E (expanding bubble), S (standing bubble near the maximum diameter), and C (collapsing bubble).
FIG. 2.
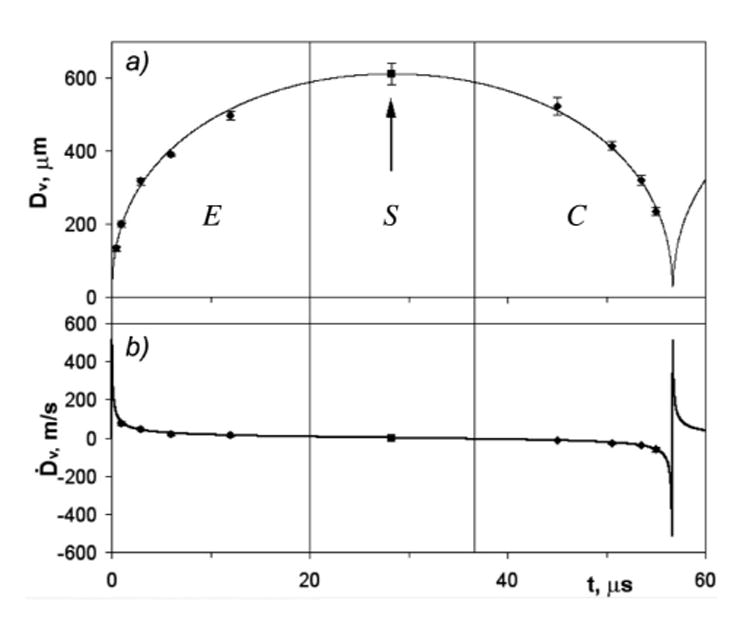
Time variation of (a) bubble diameter and (b) bubble wall velocity. Solid lines are theoretical predictions based on the Raleigh-Plesset model and dots are experimental measurement results from high-speed photography. D: diameter of the bubble; Ḋ: wall velocity. E expanding, S standing, C collapsing bubbles.
Results
The dynamics and consequences of LSW-inertial bubble interaction change significantly depending on the size and phase of the oscillating bubble, which can be controlled by adjusting the interpulse delay, i.e., the time between laser-induced plasma and the arrival of the LSW at the focus. Figure 3 shows representative high-speed images of LSW-inertial bubble interaction, in which the interpulse delay was varied from 3 to 6, 29, 50.5, and 53.5 µs, respectively, to produce pairs of bubbles matched in size yet with opposite oscillation phases at the moment of LSW impact. In general, the larger the bubble was at the moment of LSW impact, the longer it would take to produce the forced collapse. At the maximum bubble size, the forced collapse time (Tc′) was approximately 4 µs. As shown clearly in Fig. 3, the originally spherical bubble was collapsed into a disk-shaped minimum volume perpendicular to the LSW propagation direction. Previous studies have suggested that multiple and nonuniform shock waves might be generated at the minimum bubble volume due to compression of the bubble interior and the impact of a liquid jet penetrating through the interior of the bubble and colliding onto the distal bubble wall [11]. However, at a short distance from the collapse center, the shock waves appear to have merged into a single wave front. Most importantly, it is observed that the forced collapse of type C bubbles is faster with resultant larger asymmetric deformation and jetting during rebound than type E bubbles of the same size [see, for example, bubbles in Figs. 3(b) and 3(d)].
FIG. 3.
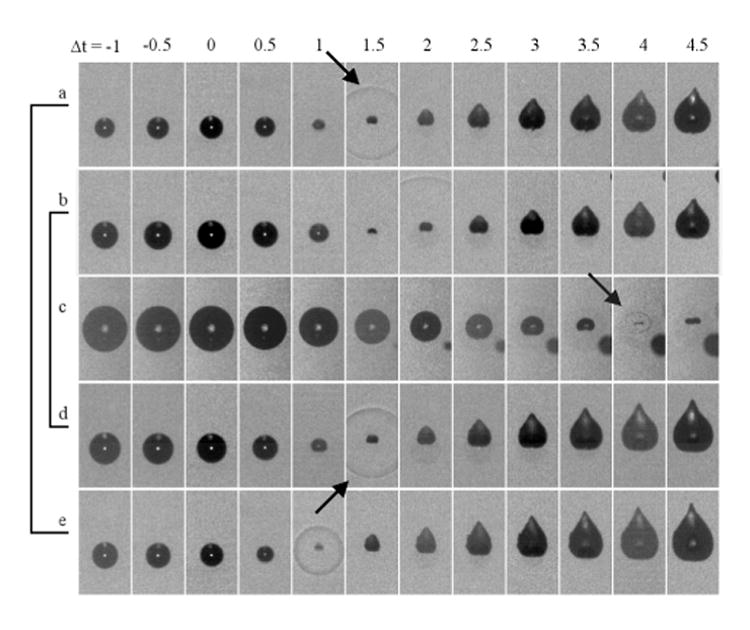
High-speed images of the interaction between lithotripter shock wave (LSW) and laser-generated single bubbles at different phases of the bubble oscillation. Interframe time is 0.5 µs, exposure time for each image frame is 10 ns, frame width is 0.7 mm. Laser light comes from the right. The LSW (not visible at this output level) propagates from the bottom to the top of the image frame and impinges on the bubble in the third frame. The interpulse delay is (a) 3, (b) 6, (c) 29, (d) 50.5, and (e) 53.5 µs, respectively. The corresponding bubble diameter at the moment of LSW impact is (a) 0.32, (b) 0.39, (c) 0.64, (d) 0.40, and (e) 0.31 mm, respectively. Arrows point to secondary shock wave emission.
The asymmetric deformation of the type E bubble in Fig. 3(b) and the type C bubble in Fig. 3(d) was quantified by the ratio of Dv/Dh, where Dv and Dh are the time-varying bubble diameters along the vertical and horizontal directions, respectively. Although the bubbles were nearly spherical before interacting with the LSW, the asymmetric extension of the type C bubbles (with a tip velocity up to 260 m/s) along the LSW propagation direction was significantly higher than that of the type E bubbles [Fig. 4(a)]. The corresponding pressure waveforms, measured simultaneously with the high-speed imaging sequences, are shown in Figs. 4(b) and 4(c). It can be seen that the second pressure spike, corresponding to the shock wave emitted by the forced collapse of the bubble, occurs sooner and with higher pulse amplitude for the type C than for type E bubbles. Because of the presence of the bubble, the amplitude of the LSW measured behind the bubble also dropped from 39 MPa (in free field without a bubble) to 28 MPa.
FIG. 4.
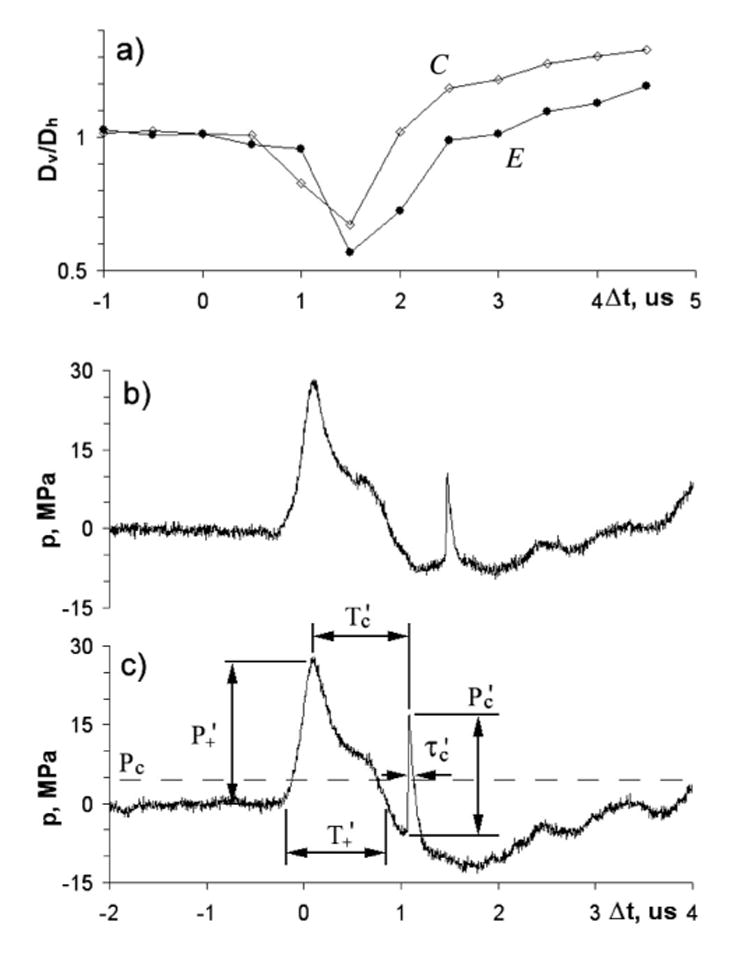
(a) The ratio of vertical over horizontal diameters for the type E bubble [Fig. 3(b)] and the type C bubble [Fig. 3(d)]. Pressure waveforms measured at zp = 1.1 mm following lithotripter shock wave-bubble interaction for (b) the type E bubble and (c) the type C bubble of the same size. P+′ and T+′ are peak pressure and zero-crossing duration of LSW with bubble, Pc′ and τc ′ are peak pressure and FWHM of the second shock wave from the forced collapse of laser-generated bubble by the LSW, and Tc′ is the forced collapse time.
Based on the pressure profile, several important parameters can be extracted. These include forced collapse time Tc′, pulse amplitude Pc′, and FWHM τc′ of the second shock wave [Fig. 4(c)]. Figure 5 shows the results obtained from various phases of the bubble oscillation. Overall, the data fits into two distinctive curves separating the type E from type C bubbles. For peak pressure and collapse time the two curves appear to merge to the zero-velocity point (or type S bubble) at maximum expansion. Compared to its inertial collapse, the forced collapse of the laser-generated bubble by a LSW produces higher pressure with longer pulse duration for the resultant second shock wave emission, indicating an energy transfer from the LSW to the collapsing bubble. The maximum pressure amplification was found to be 4.8 times the pressure produced by the inertial collapse of the bubble and is equivalent to the pressure produced by the inertial collapse of a much larger bubble of 2.2 mm in diameter [12]. The maximum pressure amplification for both type E and type C bubbles was produced at Dv/Dmax = 0.7, where Dmax (=0.61 mm) is the average maximum diameter of the laser-generated bubble in water. However, the maximum pressure produced by the type C bubble is 1.5 times the value for the type E bubble, indicating a strong influence of the oscillation phase of the bubble on pressure amplification. Further, the maximum pressure amplification was produced at T′c/T+ = 1 for type C bubbles, compared to T′c/T+ = 1.3 for type E bubbles [see Figs. 5(a) and 5(c)] where T+ is the zero-crossing compressive duration of the LSW.
FIG. 5.
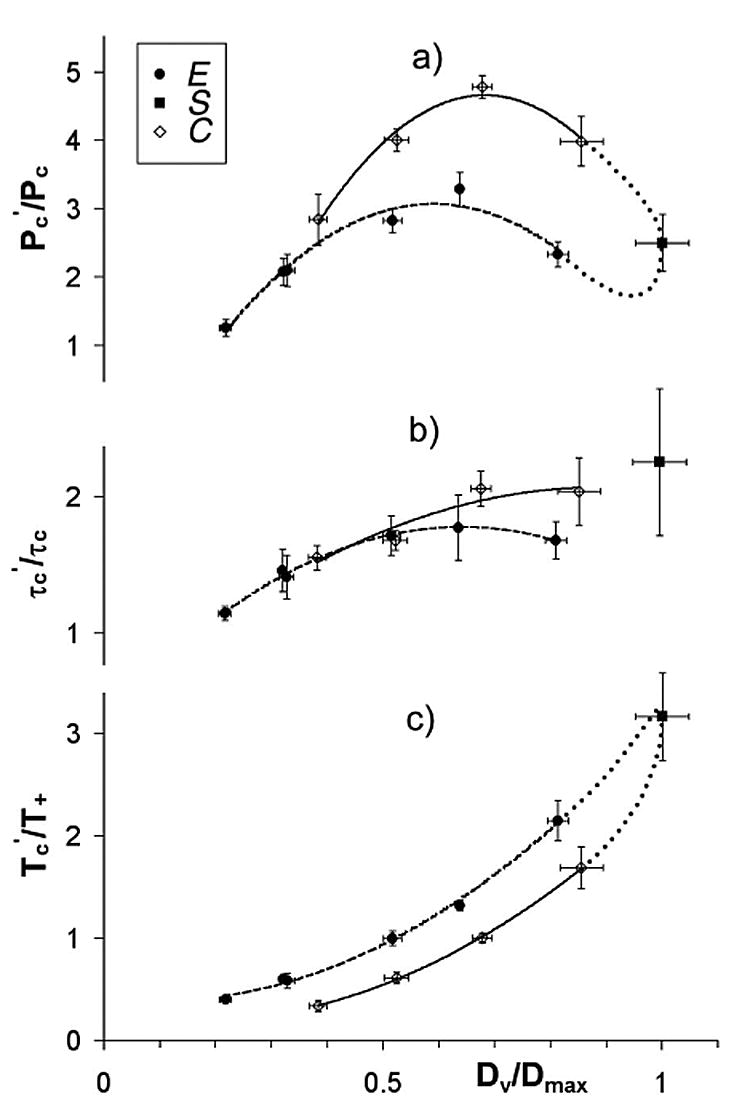
Normalized (a) peak pressure, (b) FWHM, and (c) collapse time versus normalized bubble diameter when lithotripter shock wave-bubble interaction occurs at the expanding (E), standing (S), and collapsing (C) phase of the bubble oscillation. Error bars show the standard deviation of the measurement data. Quadratic fits of the experimental data are shown in dashed lines (type E bubbles) and solid lines (type C bubbles). Dotted lines are hypothetical curves.
Discussion
The interaction of the LSW with laser-generated single bubbles is investigated with emphasis on the effect of the phase of bubble oscillation on resultant pressure amplification and microjet formation. The results suggest that maximum pressure amplification can be produced if the interaction occurs during the collapse phase of the bubble oscillation (i.e., type C bubbles) and when the forced collapse time matches with the compressive duration of the LSW (see Fig. 5). Under this condition, the energy transfer from the LSW to the bubble (∫ pdV, where p is the pressure amplitude of the LSW and V is the volume of the bubble) reaches a maximum. Hence, there is an optimal interpulse delay between the creation of the bubble and the arrival of the LSW so that the interaction occurs at an optimal bubble size during the collapse phase, leading to the production of the strongest secondary shock wave emission. When the interaction occurs above the optimal bubble size, the forced collapse will be slowed down by the trailing tensile component of the LSW. Whereas below the optimal size, the momentum transfer and duration of the interaction will decrease, leading to lower pressure amplification. This finding is similar to the effect of bubble size on jet formation produced by the interaction of LSW with air bubbles stabilized underneath a plastic membrane [2]. Moreover, besides type C bubbles, a similar optimal size is observed for type E bubbles. Here, however, the forced collapse of type E bubbles is prolonged into the tensile phase of the LSW, presumably due to the time delay it takes for the LSW to first slow down and stop the ongoing expansion of the bubble before initiating the collapse. As a result, the pressure amplification is about half of that produced by the interaction when the LSW and bubble oscillation are in phase.
During the LSW-bubble interaction, the maximum jet velocity is likely to be achieved in the period from the final collapse to the first rebound of the bubble [2,11]. Because of the limited temporal and spatial resolution of the high-speed images acquired in this study, the maximum jet velocity cannot be resolved with certainty. However, tip velocity averaged over a 0.5 µs period was found to be the highest during the first rebound of the bubble (see Fig. 3) and the maximum tip velocity was produced at the optimal bubble size (data not shown). Therefore, there appears to be a direct link between the collapse pressure and maximum tip velocity. Based on the observation from previous studies, the collapse pressure is likely to be generated by the water hammer pressure due to the impact of an involuted jet on the distal wall of the bubble [11,13]. Assume that at a sufficiently large distance the collapse pressure due to jet impact, Pjet, can be estimated by the 1/z law from the measured pressure (Pc′ = 25 MPa at zp = 1.1 mm) by Pjet ∼ Pc′zp/rjet, where rjet is the radius of the jet head. Further, Pjet = ρcvjet/2 where ρ and c are the density and wave speed of water, and vjet is the jet velocity (vjet ∼ vtip). Hence, rjet can be determined by ∼Pc′zp/ρcvtip = 0.07 mm, which is within the measured minimum horizontal length of 0.16 mm [see Fig. 3(d)]. The FWHM of the pressure pulse can be estimated by τc′ ∼ rjet/2c = 24 ns, which is on the same order of magnitude with the measured values.
In the future, the experimental system described in this Letter can be used to investigate LSW-bubble interaction near a boundary to provide mechanistic insights on the improved bioeffects produced by µs-tandem shock waves [5,6]. With a lens-grating combination [14], this system may also be used to study shock wave interaction with multiple bubbles, which are more relevant to practical applications in therapeutic ultrasound.
Acknowledgments
This work was supported in part by NIH Grant Nos. RO1-DK52985, RO1-EB002682, and S10-RR16802 and NSF Grant No. BES-0201921. Technical support from Richard Wolf GmbH, Germany on the use of the FB12 generator is also acknowledged.
References
- 1.Tomita Y, Shima A. J Fluid Mech. 1986;169:535. [Google Scholar]
- 2.Philipp A, Delius M, Scheffczyk C, Vogel A, Lauterborn W. J Acoust Soc Am. 1993;93:2496. [Google Scholar]
- 3.Young FR. Cavitation. McGraw-Hill; London: 1989. [Google Scholar]
- 4.Benjamin TB, Ellis AT. Phil Trans R Soc A. 1966;260:221. [Google Scholar]
- 5.Xi XF, Zhong P. Ultrasound Med Biol. 2000;26:457. doi: 10.1016/s0301-5629(99)00124-6. [DOI] [PubMed] [Google Scholar]
- 6.Zhong P, Lin H, Xi XF, Zhu SL, Bhogte ES. J Acoust Soc Am. 1999;105:1997. doi: 10.1121/1.426733. [DOI] [PubMed] [Google Scholar]
- 7.Ohl CD, Ikink R. Phys Rev Lett. 2003;90:214502. doi: 10.1103/PhysRevLett.90.214502. [DOI] [PubMed] [Google Scholar]
- 8.Akhatov I, Lindau O, Topolnikov A, Mettin R, Vakhitova N, Lauterborn W. Phys Fluids. 2001;13:2805. [Google Scholar]
- 9.Zhu S, Zhong P. J Acoust Soc Am. 1999;106:3024. doi: 10.1121/1.428122. [DOI] [PubMed] [Google Scholar]
- 10.Buzukov AA, Popov YuA, Teslenko VS. J Appl Mech Tech Phys. 1972;10:701. [Google Scholar]
- 11.Lindau O, Lauterborn W. J Fluid Mech. 2003;479:327. [Google Scholar]
- 12.Lindau O. Ph D thesis. Georg-August-Universität; Göttingen: 2001. [Google Scholar]
- 13.Dear JP, Field JE, Walton AJ. Nature. Vol. 332. London: 1988. p. 505. [Google Scholar]
- 14.Lauterborn W, Kurz T, Mettin R, Ohl CD. Experimental and Theoretical Bubble Dynamics. In: Prigogine I, Rice SA, editors. Advances in Chemical Physics. Vol. 110. John Wiley & Sons; New York: 1999. p. 295. [Google Scholar]


