Abstract
Programmed cell death, or apoptosis, is an essential event in animal development. Spatiotemporal analysis of caspase activation in vivo could provide new insights into programmed cell death occurring during development. Here, using the FRET-based caspase-3 indicator, SCAT3, we report the results of live-imaging analysis of caspase activation in developing Drosophila in vivo. In Drosophila, the salivary gland is sculpted by caspase-mediated programmed cell death initiated by the steroid hormone 20-hydroxyecdysone (ecdysone). Using a SCAT3 probe, we observed that caspase activation in the salivary glands begins in the anterior cells and is then propagated to the posterior cells in vivo. In vitro salivary gland culture experiments indicated that local exposure of ecdysone to the anterior salivary gland reproduces the caspase activation gradient as observed in vivo. In βFTZ-F1 mutants, caspase activation was delayed and occurred in a random pattern in vivo. In contrast to the in vivo response, the salivary glands from βFTZ-F1 mutants showed a normal in vitro response to ecdysone, suggesting that βFTZ-F1 may be involved in ecdysteroid biosynthesis and secretion of ecdysone from the ring gland for local initiation of programmed cell death. These results imply a role of βFTZ-F1 in coordinating the initiation of salivary gland apoptosis in development.
Keywords: apoptosis, imaging, metamorphosis, FRET, ecdysone
Developmental processes are regulated by many events, including cell proliferation, differentiation, migration, and cell death. Programmed cell death is an essential event in animal development and is important for maintaining animal homeostasis by controlling cell numbers, removing abnormal cells, and sculpting developmental structures in normal morphogenesis.
Steroid hormones regulate many types of biological responses, including programmed cell death during animal development (1). During Drosophila metamorphosis, successive pulses of 20-hydroxyecdysone (ecdysone) trigger the differentiation and morphogenesis of the imaginal discs, to give rise to adult tissues, and the programmed cell death of larval cells, to eliminate obsolete tissues (2). An increased ecdysone titer at the end of the third-instar larval phase induces puparium formation and marks the onset of metamorphosis. This ecdysone pulse triggers the programmed cell death of larval mid-gut and anterior muscles. About 12 h after puparium formation (APF), a subsequent ecdysone pulse induces the prepupal–pupal transition. In response to this signal, the head assumes the appropriate position by everting from inside the thorax, and the leg imaginal discs complete their elongation. This increased ecdysone titer also triggers the larval salivary gland to undergo programmed cell death, and the gland regresses completely within 4–6 h after the hormone titer peak (3–5). In this programmed cell death of the salivary gland, ecdysone induces expression of the early genes, E93, E74, and BR-C, which in turn induce the caspase family cell death executors (6, 7). However, the mechanisms involved in regulation of the spatiotemporal specification of metamorphosis-related events, including programmed cell death and caspase activation, are not well understood. The primary goal of the present work was to determine how the spatiotemporal pattern of programmed cell death is coordinated to initiate tissue regression during metamorphosis.
In recent years, many molecules involved in “cell killing” have been identified. Caspases are cysteine proteases that execute cell-killing programs, in which they cleave specific target proteins, resulting in cell degradation. In Drosophila, seven caspases (DCP-1, drICE, Dredd, DRONC, Decay, DAMM, and STRICA/Dream) have been identified and shown to be required for the cell death induced by various stimuli (8). These caspases are regulated, in part, by an Apaf-1 homolog, Dark (Dapaf-1/HAC-1). Loss of Dark function leads to reduced apoptosis in the embryo and larval brain (9–11). DRONC and its activator, Dark, are also involved in developmental cell death in various tissues and are required for programmed cell death in the larval salivary gland (12–14). These findings suggest that caspase-mediated pathways are important for programmed cell death in vivo. To investigate the spatiotemporal pattern of programmed cell death in developmental tissue regression in vivo, we focused on caspase activation in the salivary gland during metamorphosis. Recently, FRET technology has been used to develop genetically encoded fluorescent indicators for various cellular functions, including enzymatic activities and calcium concentrations. We have reported a FRET-based caspase indicator, SCAT3, that reliably provides signals from caspase activity in living cells (15).
Here, using SCAT3, we report direct observations of caspase activation in living Drosophila. Using live-imaging analysis during salivary gland programmed cell death, we found that the caspase activation was locally and symmetrically initiated in the anterior cells. The caspase activation then propagated to the posterior cells. The reactivity to ecdysone is similar between salivary cells in vitro, but the anterior–posterior pattern of caspase activation in the salivary gland requires local exposure to ecdysone. We also demonstrated that βFTZ-F1 is required for the spatial pattern of caspase activation in the salivary glands, probably through the regulation of ecdysone biosynthesis and its secretion into the anterior part of the salivary gland.
Results
Local Activation and Propagation of Caspase During Salivary Gland Cell Death.
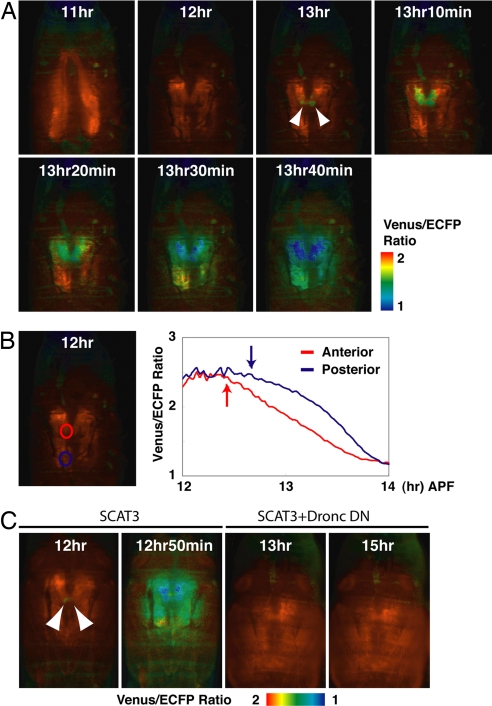
To analyze the spatiotemporal pattern of caspase activation in the pupal salivary gland in vivo, a FRET-based caspase indicator, SCAT3, was expressed in the salivary glands with an N393 driver. Using this driver, SCAT3 expression was obtained from the embryonic stage (16). In this system, caspase activation causes a decrease in the FRET signal, resulting in a decrease in the Venus enhanced cyan fluorescent protein (ECFP) emission ratio. We performed this analysis by placing individual living pupae into a glass-bottomed dish and visualizing the caspase activation in vivo by time-lapse FRET analysis with wide-field microscopy. In the SCAT3-expressing pupae, adult head eversion occurred at the normal time, 11–12 h APF (11 h 34 min ± 21 min; n = 10). At the same time, the large lobes of the salivary glands were rapidly stretched (17). Caspase activation was first detected after head eversion, at 12 h 17 min ± 24 min APF (n = 10). We observed that caspase activation was initiated in a restricted region in the anterior of the gland and that this signal then propagated to the posterior salivary cells in the pupae analyzed [Fig. 1 A and B and supporting information (SI) Movie 1]. The patterns were simultaneous and symmetrical in the right and left salivary glands, along the median line. The maximum caspase activation in the posterior cells was observed 86.4 ± 16.9 min (n = 10) after caspase activation began in the anterior cells. The caspase activity-induced reduction in FRET signals was clearly suppressed by expression of a dominant-negative DRONC (Fig. 1C), indicating that a DRONC-dependent pathway was involved in generating this pattern. This work represents a direct observation of caspase activation and programmed cell death in living animals in vivo.
Fig. 1.
Local activation and propagation of the caspase activities during programmed cell death in the salivary gland in vivo. (A) Ratio images of SCAT3-expressing salivary glands. In vivo live-imaging analysis of SCAT3 was begun 10–11 h APF. Arrowheads indicate the symmetrical initiation of caspase activation. Time indicates APF. The genotype was N393/+; UAS-SCAT3/+. (B) FRET ratio reduction was initially observed in the anterior (red line) and then in the posterior region (blue line) in the salivary glands examined in A. (Left) The region of interest is denoted by a red circle (anterior part) and blue circle (posterior part). (Right) Arrows indicate the time at which caspase activation was started. Initiation of caspase activation was determined as the time the ratio was continuously lower than the baseline ratio for 5 min. (C) Dronc was involved in the spatiotemporal pattern of caspase activation. Time indicates APF. Each arrowhead indicates symmetrical initiation of caspase activation. The indicated genotypes were as follows: SCAT3 (sca-Gal4/UAS-SCAT3), and SCAT3+Dronc DN (sca-Gal4/UAS-SCAT3; UAS-Dronc DN/+). DN, dominant-negative.
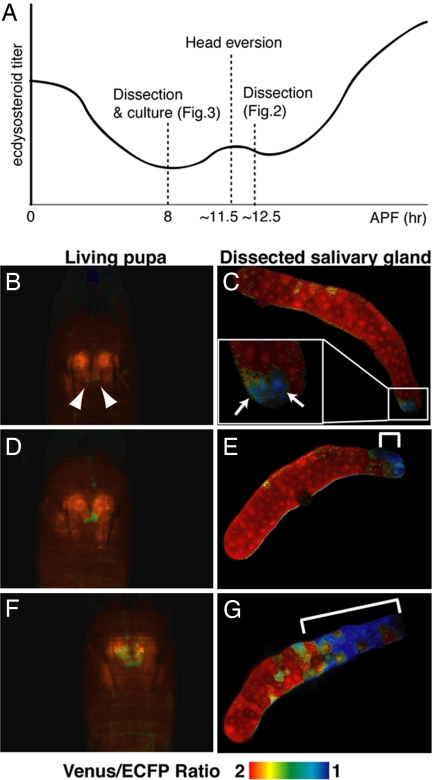
To determine where caspase activation was initiated at the single-cell level, we isolated salivary glands from pupae at different time points during development and examined caspase activation in vitro by confocal microscopy (Fig. 2C, E, and G). Caspase activities were initiated in only a few cells of the anteriormost part of the salivary glands (two cells in Fig. 2C; arrows). When propagation to the posterior region was observed in vivo (Fig. 2 D and F), the progression of caspase activation was clearly observed by in vitro confocal microscopy analysis (Fig. 2 E and G compared with Fig. 2C). These results suggested that caspase activation was initiated locally in the anterior region and propagated to the posterior region of the salivary gland.
Fig. 2.
Local caspase activation starts in anterior cells in the salivary gland. (A) Schematic representation of experiments shown in Figs. 2 and 3. The profile of the ecdysone titer is illustrated according to Thummel (29). (B–G) The initiation of caspase activation was observed in anterior gland cells. The initiation and propagation of caspase activation were observed in living pupae in vivo (B, D, and F). Each salivary gland was dissected from the observed pupa and fixed. Fixed salivary glands were subjected to monitoring for caspase activation in vitro (C, E, and G, respectively). The arrows, arrowheads, and white line indicate cells with high caspase activities. The genotype was N393/+; UAS-SCAT3/+.
In Vitro Response to Ecdysone in Salivary Gland Cells.
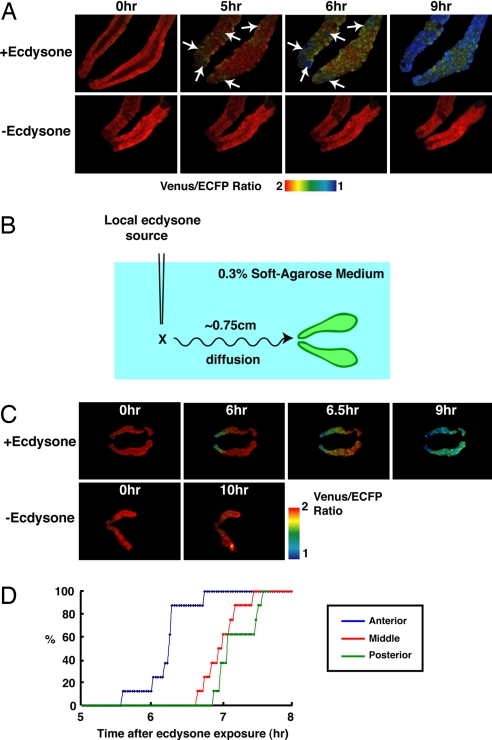
Next, we examined whether this pattern of caspase activation occurred specifically in vivo. The salivary glands from pupae were isolated at 8 h APF and cultured in vitro in culture medium. The salivary glands could be maintained for at least 17 h under these culture conditions (data not shown). Strong caspase activation was observed 6 h after the addition of ecdysone to the salivary glands (Fig. 3A Upper). However, the caspase activation was initiated in a random pattern in vitro (arrows in Fig. 3A), unlike the in vivo pattern shown in Figs. 1 and 2. These results suggest that the ability to respond to ecdysone is equal among salivary cells.
Fig. 3.
In vitro response of salivary gland to ecdysone. (A) Random initiation of caspase activation induced by ecdysone exposure in vitro. Salivary glands at 8 h APF were carefully dissected and cultured in vitro, and 50 μM ecdysone was added to cultured salivary glands to induce caspase activation. Arrows indicate cells with high caspase activity. The genotype was N393/+; UAS-SCAT3/+. (B–D) Local initiation and propagation of caspase activation by anterior-localized source of ecdysone. Salivary glands at 8 h APF were carefully dissected and cultured in vitro in 0.3% soft agarose-containing medium (2 ml). Then, 1 μl of 50 mM ecdysone or ethanol (control) was added to the anterior part of the salivary gland. The time courses of caspase activation in anterior, middle, and posterior region are plotted in D (n = 8). The percentage of salivary glands that showed caspase activation in the indicated region was plotted. Caspase activation was determined by a 20% decrease from the basal ratio.
We also examined the results of local application of ecdysone in 0.3% soft agarose-containing medium to achieve slow diffusion of ecdysone from anterior to posterior in vitro (Fig. 3B). Caspase activation was shown to be initiated in the anterior cells and propagated to the posterior cells in the salivary gland by diffusion of ecdysone from the anterior part (Fig. 3C Upper). Caspase activation was not observed at least within 10 h in control experiments (Fig. 3C Lower). We also plotted the time course of caspase activation in anterior, middle, and posterior regions (Fig. 3D), and the results indicated that caspase activation was initiated in anterior cells and propagated to middle and posterior cells. These results suggest that the spatiotemporal pattern of caspase activation in the salivary gland in vivo is the result of ecdysone diffusion and transport from the anterior side.
Defective Caspase Activation in E93 Mutants.
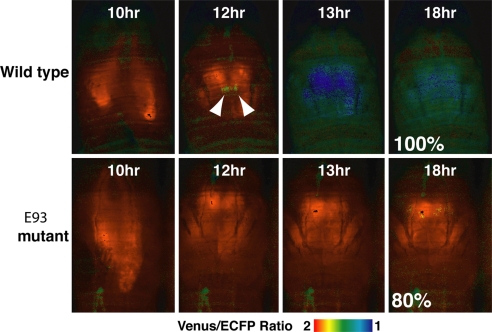
To investigate how the caspase activation pattern was formed and regulated in vivo, we used live-imaging analysis of mutants defective in ecdysone-induced genes. It has been reported that flies with mutations in E93, E74A, βFTZ-F1, or BR-C show inhibited programmed cell death in the salivary glands (6, 7, 17, 18). In E93 mutants, late genes, including the Drosophila caspases dronc and dark, showed reduced expression (19), resulting in inhibition of salivary gland cell death. We first examined the E93 gene mutation with SCAT3 live-imaging analysis (Fig. 4). In all of the E93 mutants examined, head eversion occurred normally, suggesting that the prepupal pulse of ecdysone was normal. However, our live-imaging analysis showed that caspase activation in these mutants was strongly inhibited, at least within the first 18 h APF (80%; n = 10). These results suggested that the E93 gene is an executor for caspase activation in salivary gland in vivo.
Fig. 4.
Defect of caspase activation in E93 mutants in vivo. In vivo live imaging was performed on pupae from 10 h APF. Arrowheads indicate the symmetrical initiation of caspase activation in the wild-type control. Numbers indicate the population of flies that showed these phenotypes. The indicated genotypes were: wild-type (N393/+; UAS-SCAT3/+) and E93 mutant [N393/+; UAS-SCAT3/+; E931/Df(3R)93Fx2].
Defects in Spatial Regulation of Caspase Activation in βFTZ-F1 Mutants.
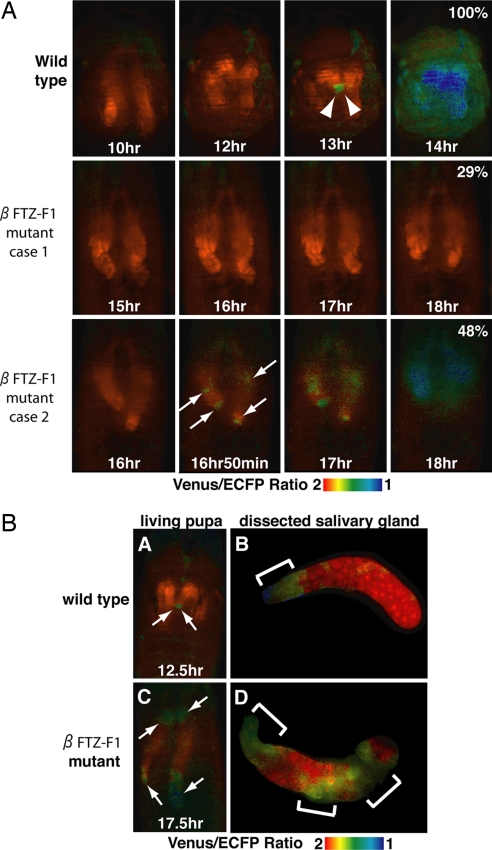
We next examined whether the spatial distribution of the ecdysone pulse in vivo could be involved in determining the spatial pattern of caspase activation in the salivary gland. Previous studies indicated that βFTZ-F1 mutants show defective adult head eversion and leg elongation, suggesting that the prepupal pulse of ecdysone is abnormal in these mutants (18). Therefore, we investigated the spatial pattern of caspase activation in a βFTZ-F1 mutant (Fig. 5). Almost all of the βFTZ-F1 mutant pupae expressing SCAT3 showed defects in adult head eversion (90%; n = 21). The results of live-imaging analysis with SCAT3 in vivo indicated complete inhibition of caspase activation in 29% of the βFTZ-F1 mutants, at least within the first 18 h APF (Fig. 5A case 1; n = 21). In the other mutants, caspase activation was significantly delayed: decreases in the emission ratio were detected from 15 h 32 min ± 1 h 30 min APF. Interestingly, in some of the βFTZ-F1 mutants, caspase activation was significantly delayed and occurred in a random pattern (Fig. 5A case 2, arrows; 48%; n = 21), in contrast to the anterior-to-posterior wave of activation seen in wild-type controls (Fig. 1). Moreover, the symmetry of caspase activation between the left and right salivary glands was almost completely abolished in these mutants. Some βFTZ-F1 mutants (19%; n = 21) showed an anterior-to-posterior spatial pattern of caspase activation similar to that of wild-type controls; however, these mutants also showed defects in adult head eversion and a marked delay in the initiation of caspase activation (16 h 4 min ± 1 h 12 min).
Fig. 5.
Defects in adult head eversion and the spatial pattern of caspase activation in βFTZ-F1 mutants in vivo. (A) In vivo live imaging was performed from 10 h APF in wild-type controls and βFTZ-F1 mutants. Arrowheads indicate the symmetrical initiation of caspase activation in wild-type controls. Arrows indicate the random initiation of caspase activation in βFTZ-F1 mutants. Case 1 refers to pupae showing no caspase activation up to 18 h APF. Case 2 refers to the pupae that showed delayed and randomly initiated caspase activation. In case 2, the propagation of caspase activation characteristic of wild-type controls (Fig. 1A) was not observed. Numbers indicate the percentages of the population. (B) Defect in the spatial pattern of caspase activation in βFTZ-F1 mutants. The spatial pattern of caspase activation was compared between dissected salivary glands from wild-type controls and βFTZ-F1 mutants. Once the caspase activation was started as determined by in vivo imaging (A and C; arrows), the salivary gland from the observed pupa was dissected and fixed. Time indicates APF (in hours). The indicated genotypes in this figure are wild-type (N393/+; UAS-SCAT3/+) and βFTZ-F1 mutant (N393/+; UAS-SCAT3/+; βFTZ-F117/βFTZ-F119).
To examine the caspase activation pattern of the βFTZ-F1 mutants in detail, we examined caspase activities at the single-cell level, as shown in Fig. 2. In contrast to wild-type controls, the initial caspase activation occurred randomly in βFTZ-F1 mutants (Fig. 5BC). This random activation was confirmed in isolated salivary glands (Fig. 5BD). These results strongly suggested that βFTZ-F1 and the normal ecdysone pulse are involved not only in the temporal regulation but also in the spatial regulation of caspase activation in vivo.
Normal Response to Ecdysone of Salivary Glands Isolated from βFTZ-F1 Mutants in Vitro.
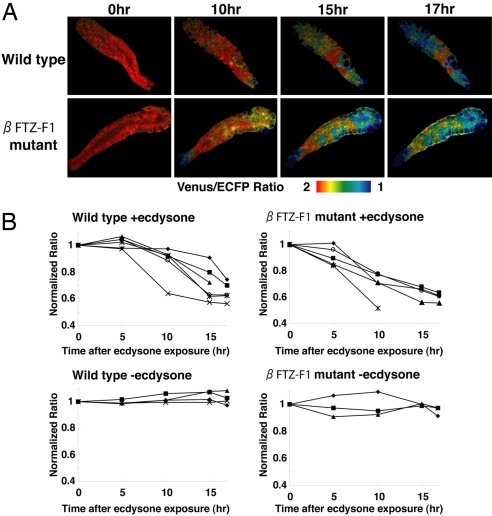
To determine the association between βFTZ-F1 and the ecdysone response, we examined the response to ecdysone of salivary glands isolated from βFTZ-F1 mutants (Fig. 6). Salivary glands from wild-type controls and βFTZ-F1 mutants were maintained in culture for at least 17 h (Fig. 6B Lower; −ecdysone). The salivary glands from βFTZ-F1 mutants showed the same pattern of caspase activation as wild-type controls in live imaging in vitro (Fig. 6A), and the time courses of the in vitro response to ecdysone were similar in both wild-type controls and βFTZ-F1 mutants (Fig. 6B Upper). These results indicated that the βFTZ-F1 mutant salivary glands have the ability to respond normally to ecdysone. The results of our in vivo and in vitro experiments suggest that the defects in spatiotemporal caspase activation in the βFTZ-F1 salivary gland in vivo are likely caused by the abnormal regulation of the ecdysone pulse generated in the ring gland. Thus, regulated synthesis and local exposure to ecdysone from the ring gland to the anteriormost part of the salivary gland are crucial to generate the unique caspase activation pattern in the salivary gland during metamorphosis.
Fig. 6.
Normal response to ecdysone in salivary glands isolated from βFTZ-F1 mutants in vitro. (A) Caspase activation in βFTZ-F1 mutants in response to ecdysone. The salivary glands were carefully dissected from wild-type controls or βFTZ-F1 mutants at 8 h APF. In vitro live imaging was performed in one of the pair by confocal microscopy with 50 μM ecdysone in culture medium. (B) Time course of caspase activation in wild-type and βFTZ-F1 mutant salivary glands with or without ecdysone in vitro. In each experiment, the average ratio between the anterior, middle, and posterior region was calculated. Average ratio in individual salivary gland was plotted in B. To compare wild-type and mutant animals, the emission ratio was normalized by defining the ratio shown in 0 h as 1. Live imaging of at least three salivary glands in each experiment was performed for 17 h or until the cells were completely destroyed. Note that no caspase activation was observed without ecdysone for at least 17 h in wild-type and βFTZ-F1 mutant salivary glands (Lower). The indicated genotypes are: wild-type (N393/+; UAS-SCAT3/+) and βFTZ-F1 mutant (N393/+; UAS-SCAT3/+; βFTZ-F117/βFTZ-F119).
Discussion
Our live-imaging experiments revealed three characteristics of caspase activation during salivary gland programmed cell death in wild-type controls in vivo (Figs. 1 and 2). First, the caspase activation was always initiated in only a few cells located in the anteriormost region of the salivary glands. Second, the caspase activation was propagated from the anterior cells to posterior cells of the salivary glands. Third, these spatial patterns of caspase activation were symmetrical along the median line. This anterior-to-posterior pattern could not be detected in vitro in cultured salivary glands (Fig. 3), suggesting that the sensitivity to ecdysone is equivalent among the gland cells. In contrast, local ecdysone stimulation from the anterior side induced anterior-to-posterior patterns of caspase activation in vitro likely to be observed in vivo. Therefore, we assume that a well organized system for ecdysone diffusion and transport from anterior side should form the spatiotemporal pattern of caspase activation in the salivary gland in vivo.
To determine the molecular mechanisms involved in caspase activation in vivo, we applied our live-imaging technique to mutants deficient in ecdysone-induced genes. E93 is an ecdysone response gene that controls the expression of late genes, including the Drosophila caspase dronc (7, 20). An E93 mutant showed strong inhibition of caspase activation, although the pupal–prepupal ecdysone pulse seemed to be normal (Fig. 4). These observations suggest that E93 is an executor for caspase activation in the salivary gland programmed cell death through induction of late genes in the salivary gland.
Because the ecdysone pulse did not seem to be affected in the E93 mutants, we hypothesized that the spatial pattern of caspase activation could be coordinated by the spatial distribution of the ecdysone pulse. Therefore, we examined caspase activation in βFTZ-F1 mutants, in which a defect in adult head eversion suggests that the prepupal pulse of ecdysone is abnormal. In this mutant, caspase activation was inhibited or delayed, and in some cases it occurred in a random pattern in the salivary gland cells. There was no significant spatial pattern in these mutants, in contrast to the organized pattern seen in wild-type controls. Moreover, in these mutants, the symmetry of the spatial pattern of caspase activation had disappeared almost completely. The partial influence of βFTZ-F1 on ecdysone response is likely because the alleles selected for this experiment were not nulls. However, the salivary glands from the βFTZ-F1 mutant showed normal induction of caspase activity in response to ecdysone in vitro, suggesting that βFTZ-F1 does not make a major contribution to cell death itself in the salivary gland. From these results, obtained by live imaging of βFTZ-F1 mutant salivary glands both in vivo and in vitro, we hypothesized that βFTZ-F1 regulates the ecdysone pulse in the ring gland where ecdysone is synthesized and secreted for salivary gland programmed cell death in vivo. The ring gland is located on the prothorax near the salivary glands, suggesting that the local activation of caspase may depend on the local interaction between the ring gland and salivary glands.
One possible mechanism for βFTZ-F1 to regulate the ecdysone pulse involves its coordination of ecdysteroidgenesis by controlling the expression of downstream genes. E75A is a downstream gene of βFTZ-F1 (21). The expression pattern of E75A is correlated with that of βFTZ-F1 at 10 h APF (22). It has been hypothesized that E75A acts as a feedforward factor in ecdysteroidgenesis by enhancing the expression of steroidogenic enzymes (23, 24). Taken together, these observations suggest that βFTZ-F1 may regulate ecdysteroidgenesis through regulation of E75A expression. Our current hypothesis is that a βFTZ-F1--E75A feedback loop in the ring gland results in the biosynthesis of precise levels of ecdysteroid, creating the spatiotemporal pattern of the ecdysone pulse and consequently of caspase activation in the salivary glands. At least in third-instar larvae, βFTZ-F1 is expressed in the ring gland (24). However, the detailed function of βFTZ-F1 in the ring gland remains to be elucidated. SCAT3-based live-imaging analysis will provide information regarding not only ecdysone-mediated biological events, including cell death, but also insight into the dynamics of ecdysone pulse.
Materials and Methods
Fly Stocks.
The following fly strains were used in this work: UAS-SCAT3 (25), UAS-DRONC DN/TM3 (26), N393/Binsinscy (16), and sca-Gal4/CyO (27). To generate the E93 and βFTZ-F1 mutants expressing SCAT3, E931/TM6b, Df(3R)93Fx2/TM6b, βFTZ-F117/TM6b, and βFTZ-F119/TM6b (27) were used. Drosophila crosses were carried out by standard procedures at 25°C.
Live Imaging of Caspase Activation in the Programmed Cell Death of Salivary Glands in Vivo.
Live-imaging analysis of caspase activation in vivo with wide-field microscopy was performed as described in our previous reports with several modifications (15). Late third-instar larvae were selected from the appropriate crosses and monitored every 10–15 min for pupal formation. Each staged pupa was picked up and placed on a glass coverslip in a humid chamber to maintain viability. Animals were maintained at 23–26°C in a temperature-controlled room. Head eversion occurred ≈11.5 h after puparium formation in wild-type controls (N393/+; UAS-SCAT3/+) in this culture system, consistent with a previous report (17). The optical system for in vivo live imaging was described in our previous report (15).
Detailed Spatiotemporal Pattern Analysis in Dissected Salivary Glands.
After the beginning of caspase activation, as determined by in vivo imaging, the salivary glands from the observed pupa were dissected in ice-cold PBS within 15 min and fixed with 4% paraformaldehyde at 4°C for 5 min. The salivary glands were placed immediately on coverslips. FRET images in fixed salivary glands were collected by confocal microscopy as described in our previous report (25).
Live Imaging of Caspase Activation During Programmed Cell Death in the Salivary Gland in Vitro.
Confocal imaging analysis of caspase activation was performed as described in our previous report with several modifications (25). Salivary glands dissected at 8 h APF were cultured on glass coverslips in Schneider's Drosophila medium (Gibco, Grand Island, NY). Cultured salivary glands were maintained at 23–26°C in a temperature-controlled room. To protect the gland cells from damage, we preserved the interconnections between each salivary gland. After 50 μM ecdysone or ethanol (as a control) was added, confocal FRET images were acquired with the Aquacosmos/Ashura system (Hamamatsu Photonics, Hamamatsu, Japan) with a UPlanApo ×10 0.40 NA objective (Olympus, Tokyo, Japan) as described in our previous report (25).
In the case of local stimulation by ecdysone (Fig. 3B), salivary glands were cultured in 0.3% soft agarose-containing medium to obtain slow diffusion of ecdysone in vitro. The distance between the anteriormost cells of the salivary gland and the point of ecdysone injection was ≈0.75 cm. We measured the diffusion of Alexa Fluor 488-maleimide dye to monitor the time for diffusion from anterior to posterior salivary gland cells. It was estimated to be ≈60 min under these conditions (data not shown). The imaging analysis was performed with a ×4 0.16 N.A. objective (Olympus).
Mutant Imaging Analysis.
The E93 and βFTZ-F1 mutants used in this work and their general defects in salivary gland cell death were described previously (6, 18, 19, 28). Controls (N393/+; UAS-SCAT3/+), E93 [N393/+; UAS-SCAT3/+; E931/Df(3R)93Fx2], and βFTZ-F1 (N393/+; UAS-SCAT3/+; βFTZ-F117/βFTZ-F119) mutants were used for SCAT3 imaging analysis in vivo.
Supplementary Material
Acknowledgments
We are grateful to H. Kanuka (Obihiro University of Agriculture and Veterinary Medicine, Obihiro, Japan), M. Kobayashi (National Institute of Genetics, Mishima, Japan), E. H. Baehrecke (University of Maryland, College Park, MD), and H. Richardson (Peter MacCallum Cancer Institute, Melbourne, Australia) for materials and flies, and the Bloomington Stock Center for fly stocks. We are also grateful to T. Igaki, R. Niwa, and H. Ueda for valuable discussions. This work was supported by grants from the Japanese Ministry of Education, Science, Sports, Culture, and Technology (to M.M. and E.K.), the Cell Science Research Foundation, a RIKEN Bioarchitect Research Grant (to M.M.), and the Takeda Science Foundation (to E.K.). K.T. and A.T. are research fellows of the Japan Society for the Promotion of Science.
Abbreviations
- APF
after puparium formation
- ecdysone
20-hydroxyecdysone
- ECFP
enhanced cyan fluorescent protein.
Footnotes
The authors declare no conflict of interest.
This article is a PNAS Direct Submission. H.S. is a guest editor invited by the Editorial Board.
This article contains supporting information online at www.pnas.org/cgi/content/full/0702733104/DC1.
References
- 1.Baehrecke EH. Cell Death Differ. 2000;7:1057–1062. doi: 10.1038/sj.cdd.4400753. [DOI] [PubMed] [Google Scholar]
- 2.Thummel CS. Trends Genet. 1996;12:306–310. doi: 10.1016/0168-9525(96)10032-9. [DOI] [PubMed] [Google Scholar]
- 3.Jiang C, Baehrecke EH, Thummel CS. Development (Cambridge, UK) 1997;124:4673–4683. doi: 10.1242/dev.124.22.4673. [DOI] [PubMed] [Google Scholar]
- 4.Robertson CW. J Morphol. 1936;59:351–399. [Google Scholar]
- 5.Fristrom D, Fristrom JW. In: The Development of Drosophila melanogaster. Bate A, Arias A, editors. New York: Cold Spring Harbor Laboratory Press; 1993. pp. 843–897. [Google Scholar]
- 6.Lee CY, Baehrecke EH. Development (Cambridge, UK) 2001;128:1443–1455. doi: 10.1242/dev.128.8.1443. [DOI] [PubMed] [Google Scholar]
- 7.Lee CY, Simon CR, Woodard CT, Baehrecke EH. Dev Biol. 2002;252:138–148. doi: 10.1006/dbio.2002.0838. [DOI] [PubMed] [Google Scholar]
- 8.Hay BA, Guo M. Annu Rev Cell Dev Biol. 2006;22:623–650. doi: 10.1146/annurev.cellbio.21.012804.093845. [DOI] [PubMed] [Google Scholar]
- 9.Kanuka H, Sawamoto K, Inohara N, Matsuno K, Okano H, Miura M. Mol Cell. 1999;4:757–769. doi: 10.1016/s1097-2765(00)80386-x. [DOI] [PubMed] [Google Scholar]
- 10.Rodriguez A, Oliver H, Zou H, Chen P, Wang X, Abrams JM. Nat Cell Biol. 1999;1:272–279. doi: 10.1038/12984. [DOI] [PubMed] [Google Scholar]
- 11.Zhou L, Song Z, Tittel J, Steller H. Mol Cell. 1999;4:745–755. doi: 10.1016/s1097-2765(00)80385-8. [DOI] [PubMed] [Google Scholar]
- 12.Daish TJ, Mills K, Kumar S. Dev Cell. 2004;7:909–915. doi: 10.1016/j.devcel.2004.09.018. [DOI] [PubMed] [Google Scholar]
- 13.Mills K, Daish T, Harvey KF, Pfleger CM, Hariharan IK, Kumar S. J Cell Biol. 2006;172:809–815. doi: 10.1083/jcb.200512126. [DOI] [PMC free article] [PubMed] [Google Scholar]
- 14.Leulier F, Ribeiro PS, Palmer E, Tenev T, Takahashi K, Robertson D, Zachariou A, Pichaud F, Ueda R, Meier P. Cell Death Differ. 2006;13:1663–1674. doi: 10.1038/sj.cdd.4401868. [DOI] [PubMed] [Google Scholar]
- 15.Takemoto K, Nagai T, Miyawaki A, Miura M. J Cell Biol. 2003;160:235–243. doi: 10.1083/jcb.200207111. [DOI] [PMC free article] [PubMed] [Google Scholar]
- 16.Brand AH, Perrimon N. Development (Cambridge, UK) 1993;118:401–415. doi: 10.1242/dev.118.2.401. [DOI] [PubMed] [Google Scholar]
- 17.Ward RE, Reid P, Bashirullah A, D'Avino PP, Thummel CS. Dev Biol. 2003;256:389–402. doi: 10.1016/s0012-1606(02)00100-8. [DOI] [PubMed] [Google Scholar]
- 18.Broadus J, McCabe JR, Endrizzi B, Thummel CS, Woodard CT. Mol Cell. 1999;3:143–149. doi: 10.1016/s1097-2765(00)80305-6. [DOI] [PubMed] [Google Scholar]
- 19.Lee CY, Wendel DP, Reid P, Lam G, Thummel CS, Baehrecke EH. Mol Cell. 2000;6:433–443. doi: 10.1016/s1097-2765(00)00042-3. [DOI] [PubMed] [Google Scholar]
- 20.Daish TJ, Cakouros D, Kumar S. Cell Death Differ. 2003;10:1348–1356. doi: 10.1038/sj.cdd.4401312. [DOI] [PubMed] [Google Scholar]
- 21.Woodard CT, Baehrecke EH, Thummel CS. Cell. 1994;79:607–615. doi: 10.1016/0092-8674(94)90546-0. [DOI] [PubMed] [Google Scholar]
- 22.Sullivan AA, Thummel CS. Mol Endocrinol. 2003;17:2125–2137. doi: 10.1210/me.2002-0430. [DOI] [PubMed] [Google Scholar]
- 23.Bialecki M, Shilton A, Fichtenberg C, Segraves WA, Thummel CS. Dev Cell. 2002;3:209–220. doi: 10.1016/s1534-5807(02)00204-6. [DOI] [PubMed] [Google Scholar]
- 24.Parvy JP, Blais C, Bernard F, Warren JT, Petryk A, Gilbert LI, O'Connor MB, Dauphin-Villemant C. Dev Biol. 2005;282:84–94. doi: 10.1016/j.ydbio.2005.02.028. [DOI] [PubMed] [Google Scholar]
- 25.Kanuka H, Kuranaga E, Takemoto K, Hiratou T, Okano H, Miura M. EMBO J. 2005;24:3793–3806. doi: 10.1038/sj.emboj.7600822. [DOI] [PMC free article] [PubMed] [Google Scholar]
- 26.Quinn LM, Dorstyn L, Mills K, Colussi PA, Chen P, Coombe M, Abrams J, Kumar S, Richardson H. J Biol Chem. 2000;275:40416–40424. doi: 10.1074/jbc.M002935200. [DOI] [PubMed] [Google Scholar]
- 27.Reddy GV, Rodrigues V. Development (Cambridge, UK) 1999;126:2083–2092. doi: 10.1242/dev.126.10.2083. [DOI] [PubMed] [Google Scholar]
- 28.Martin DN, Baehrecke EH. Development (Cambridge, UK) 2004;131:275–284. doi: 10.1242/dev.00933. [DOI] [PubMed] [Google Scholar]
- 29.Thummel CS. Dev Cell. 2001;1:453–465. doi: 10.1016/s1534-5807(01)00060-0. [DOI] [PubMed] [Google Scholar]
Associated Data
This section collects any data citations, data availability statements, or supplementary materials included in this article.


