Abstract
Complex I (NADH:ubiquinone oxidoreductase) is responsible for most of the mitochondrial H2O2 release, both during the oxidation of NAD-linked substrates and during succinate oxidation. The much faster succinate-dependent H2O2 production is ascribed to Complex I, being rotenone-sensitive. In the present paper, we report high-affinity succinate-supported H2O2 generation in the absence as well as in the presence of GM (glutamate/malate) (1 or 2 mM of each). In brain mitochondria, their only effect was to increase from 0.35 to 0.5 or to 0.65 mM the succinate concentration evoking the semi-maximal H2O2 release. GM are still oxidized in the presence of succinate, as indicated by the oxygen-consumption rates, which are intermediate between those of GM and of succinate alone when all substrates are present together. This effect is removed by rotenone, showing that it is not due to inhibition of succinate influx. Moreover, α-oxoglutarate production from GM, a measure of the activity of Complex I, is decreased, but not stopped, by succinate. It is concluded that succinate-induced H2O2 production occurs under conditions of regular downward electron flow in Complex I. Succinate concentration appears to modulate the rate of H2O2 release, probably by controlling the hydroquinone/quinone ratio.
Keywords: brain mitochondrion, electron transfer, hydrogen peroxide production, NADH:ubiquinone oxidoreductase (Complex I), reactive oxygen species, succinate
Abbreviations: GM, glutamate/malate; HRP, horseradish peroxidase; α-KG, α-oxoglutarate (α-ketoglutarate); MnSOD, manganese superoxide dismutase; OAA, oxaloacetate; PCA, perchloric acid; Q, quinione, QH2, hydroquinone; ROS, reactive oxygen species; ΔΨ, mitochondrial membrane potential; Δp, mitochondrial protonmotive force; ΔpH, mitochondrial pH gradient
INTRODUCTION
Mitochondria are the major site of ROS (reactive oxygen species) production in mammalian cells, and superoxide (O2−) appears to be the primary ROS produced as the result of single-electron reduction of O2.
Mitochondrial Complex I (NADH:ubiquinone oxidoreductase) is the most complicated and least understood electron carrier in the respiratory chain. Its primary function is to pump protons across the inner membrane. A second property of Complex I is a highly modulated O2− production. O2− from Complex I is generated on the matrix side of the inner membrane [1] and is transformed into H2O2 by mitochondrial MnSOD (manganese superoxide dismutase). The highly permeable H2O2 is the measured species in the extramitochondrial space. The importance of ROS removal from the mitochondrial matrix is demonstrated by the poor survival of MnSOD-null mice [2] and by the increased lifespan of mice expressing mitochondrial catalase [3]. Complex III is also known to produce O2− (mainly on the cytosolic space). However this O2− release is largely dependent on the presence of the electron transfer inhibitor antimycin A [4].
ROS have been considered important in various pathologies [5] and aging [6]. More recently, however, it has been recognized that ROS have important physiological roles as signalling molecules whose functions are just emerging [7]. Complex I is now considered to be the major site of O2−/H2O2 production.
H2O2 is generated during coupled respiration of NAD-linked substrates (the release is increased by the electron transfer inhibitor rotenone); it is also generated, at a much higher rate, during coupled succinate respiration (production is strongly inhibited by rotenone and by decreasing membrane potential). These properties are taken as evidence that succinate-dependent H2O2 generation occurs in Complex I upstream of the rotenone inhibition site (i.e. via energy-dependent reverse electron transfer from Complex II to Complex I [8–13]). We have shown that the Parkinson's disease toxin dopaminochrome (derived from dopamine) promotes a strong increase of H2O2 production both with GM (glutamate/malate) and in the further presence of succinate [14], and that H2O2 is removed by GSH peroxidase [15]. The succinate-dependent H2O2 production is controlled by ΔpH (mitochondrial pH gradient) across the inner membrane and is depressed when such gradient is abolished [16]. The physiological importance of succinate-sustained H2O2 generation, being linked to a situation of reverse electron transfer, has been considered dubious [9–13,16,17].
In the present study, we analysed the production of H2O2 in brain mitochondria in the presence of both the NAD-linked substrates GM (or pyruvate/malate, which gave the same results) and succinate, i.e. close to in vivo conditions. We show that succinate-dependent H2O2 production initiates at low physiological concentrations and is only marginally modified by the presence of GM. Furthermore, GM oxidation is progressively decreased, but not abolished, by succinate and the two substrates appear to compete for electron transfer.
We propose that the sharp dependence of the H2O2-generation rate on succinate concentration is an important modulator in the overall cellular ROS production.
MATERIALS AND METHODS
Reagents
Amplex Red (10-acetyl-3,7-dihydroxyphenoxazine) was from Molecular Probes. HRP (horseradish peroxidase) (grade I; EC 1.11.1.7), catalase from bovine liver (EC 1.11.1.6) and α-KG [α-oxoglutarate (α-ketoglutarate)] dehydrogenase from pig heart (EC 1.2.4.2) were supplied from Sigma. All other reagents were of analytical grade.
Preparation of rat brain mitochondria
Brain mitochondria were isolated from cerebral cortices of 6–7-week-old rats as described in [15].
Standard incubation method
Mitochondria (0.4–0.6 mg/ml) were incubated at 30°C in 125 mM KCl, 1.2 mM KH2PO4, 1.2 mM MgCl2, 500 μg/ml defatted BSA, 20 mM Mops, pH 7.2 (adjusted with KOH), and 100 μM EGTA. Further additions were as specified in the Figure legends.
H2O2 measurements
H2O2 was measured with 7 μM Amplex Red and 15 μg/ml HRP (3.75 units) included in the incubations. H2O2 was detected by the formation of the fluorescent Amplex Red oxidation product resorufin using excitation and emission wavelengths of 563 and 587 nm respectively on a Shimadzu RL-5000 spectrofluorimeter in a stirred cuvette [14]. H2O2 release was linear for at least 6–8 min. The H2O2 calibration scale is linear in the 0–5 μM range, and, at the end of each assay, traces were calibrated by the addition of H2O2 (500 pmol).
Assay of α-KG
The α-KG assay was performed as in [18,19]. Briefly, mitochondria (4 mg/ml) were incubated in the standard incubation medium with agitation for 10 min with the indicated amount of substrates. During incubation, substrate concentrations of glutamate, malate and succinate were kept constant by addition of 0.3 mM GM and 0.5 mM succinate at 5 min. Reactions were stopped by addition of 12% cold PCA (perchloric acid), and samples were left on ice for 20 min before centrifugation at 5000 g for 5 min. Enzymatic fluorimetric titration of NADH formed by α-KG oxidation was carried out in 100 μl aliquots of the supernatant neutralized with KOH in 200 μl (final volume) of medium containing 100 mM sodium phosphate buffer, pH 7.3, 5 mM CaCl2, 1 mM MgCl2, 5 mM EGTA, 1 mM NAD+ and 0.2 mg/ml (160 m-units) of α-KG dehydrogenase in a Fluoroskan plate-reader at 355 nm excitation and 460 nm emission. The reaction was started by addition of 100 μM CoASH. α-KG concentrations were calculated from the titration curve of the rates obtained with known comparable amounts of standard α-KG. Values are reported as nmol/min per mg of protein. Similar results were obtained by spinning-down mitochondria at the end of incubation and measuring α-KG in the PCA-treated supernatant. Also, including catalase (5 μg/ml) in the incubation medium was without any significant effect on α-KG accumulation.
Other assays
ΔΨ (mitochondrial membrane potential) was measured using fluorescence quenching of the cationic dye safranine (3 μM) at 495 nm excitation and 586 nm emission as in [15]. NAD(P) reduction was monitored fluorimetrically at 348 nm excitation and 464 nm emission as in [15]. Mitochondrial respiration was monitored in the presence of HRP and Amplex Red with a Clark-type oxygen electrode in a 1.6 ml closed chamber with continuous stirring.
RESULTS AND DISCUSSION
Complex I-dependent H2O2 release with succinate and GM
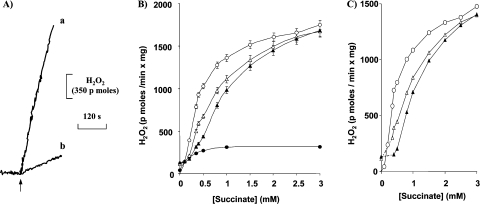
Figure 1(A) shows the high H2O2 production rate in brain mitochondria oxidizing succinate (trace a) and the much slower H2O2 generation with GM as the substrates (trace b). The production of H2O2 as a function of succinate concentration, in the absence and presence of GM, is shown in Figure 1(B). The maximal H2O2 release (with 3 mM succinate) was unaffected by GM. The half-maximal H2O2 production with succinate alone was at approx. 0.35 mM. With GM (1 mM each), a concentration which produced maximal Δp (mitochondrial protonmotive force), the H2O2 release at zero succinate was approx. 0.15 nmol/min per mg of protein, and the further addition of succinate promoted a sharp increase of H2O2 production, with a half-maximal stimulation at approx. 0.5 mM. A similar behaviour was obtained at higher (2 mM) GM. In this situation, the half-maximal stimulation of H2O2 release by succinate was increased to 0.6–0.65 mM. The rotenone-inhibited H2O2-production rates with succinate are also shown in Figure 1(B). It is likely that this residual H2O2 release also originated from Complex I, since succinate promoted a large NAD(P) reduction in the presence of rotenone, probably via malate dehydrogenase. Similar results were obtained with piericidin (results not shown). According to the hypothesis that H2O2 generation with succinate and rotenone does not originate from Complex I, these rates were subtracted from the succinate and succinate/GM values of Figure 1(B) and are reported in Figure 1(C). They certainly represent Complex I-dependent H2O2 release with succinate and GM.
Figure 1. Titration of succinate-promoted H2O2 generation.
(A) Different rates of H2O2 production are elicited by GM and succinate. Succinate (trace a) and GM (trace b) were 1 mM. Mitochondria (0.75 mg/1.6 ml) were incubated in standard incubation medium containing HRP. Amplex Red was added at the time indicated by the arrow. (B) H2O2 production was measured in the absence (○) and presence of GM, 1 mM (Δ) or 2 mM (▲) each. Where present, rotenone was 2.5 μM (●) without GM. (C) Net H2O2 releases calculated by subtracting the rotenone rates from the rates in the absence of rotenone in (B). Traces in (A) are representative of duplicate traces from at least seven independent experiments. Results in (B) are means±S.D. for at least five independent experiments.
Succinate does not prevent electron flow from GM in Complex I
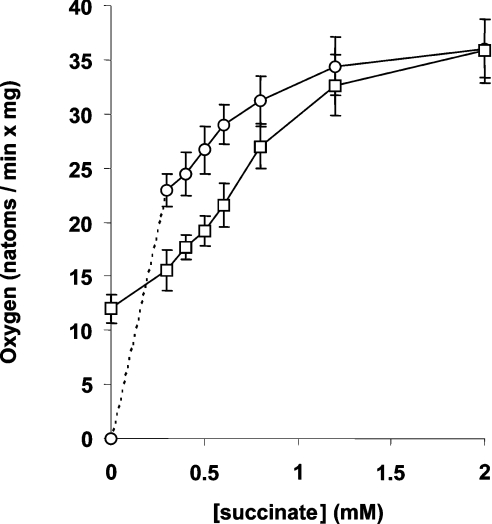
The generally accepted view is that succinate promotes H2O2 release by pushing electrons back into Complex I in a reverse mode of electron transfer. With NAD-linked substrates and in the absence of succinate, H2O2 release is slow and can be increased in a non-physiological situation, i.e. in the presence of rotenone-type electron transfer inhibitors and high ΔpH [17]. Alternatively, H2O2 release was reported to be increased in cytochrome c-depleted mitochondria [20]. The findings reported in the present study show that low succinate promotes H2O2 release also in the presence of high NAD-linked substrates. It can be questioned whether succinate in these conditions operates a ‘reverse’ mode of electron flux, i.e. whether the oxidation of GM is prevented. To solve this problem, first we analysed the rates of O2 consumption with GM (1 mM each), succinate and a mixture. Typical results are reported in Table 1, which shows the experiment with 0.5 mM succinate (a concentration that promotes a large H2O2 release). The oxidation rate was higher with succinate than with GM, probably reflecting the lower number of protons pumped by succinate, which does not feed electrons to Complex I. However, the O2 consumption rate with the mixture was intermediate between that of the two constituents alone, a possible indication that both succinate and GM were contributing to O2 consumption when they were present together. In the presence of rotenone, the O2-consumption rate with succinate was not significantly affected by GM, showing that there was no limitation to succinate availability. The overall titration of O2 consumption with increasing succinate, in the absence and presence of constant (1 mM) GM is reported in Figure 2. Above 0.2 mM, the succinate oxidation rate was higher than that of GM, and the addition of GM induced a decrease of O2 consumption to intermediate values. Only above approx. 1.5 mM succinate, GM became incapable of decreasing the succinate oxidation rate. These results confirm that a fraction of the overall oxidation rate was indeed dependent on GM when both GM and succinate were supplied to mitochondria.
Table 1. O2 consumption rate measured in mitochondria oxidizing different respiratory substrates.
Mitochondria (0.9 mg/1.6 ml) were incubated in standard medium supplemented with Amplex Red and HRP, and respiration rates were measured. GM (1 mM each), succinate (0.5 mM) and rotenone (1 μM) were present or added as indicated. Results are means±S.D. for at least seven independent experiments.
| Substrate | Rate of O2 consumption (n-atoms/min per mg) |
|---|---|
| GM | 10.5±2.5 |
| GM + succinate | 16.8±2.0 |
| Succinate | 28.0±3.0 |
| Succinate + GM | 17.5±1.2 |
| Rotenone/GM/succinate | 27.5±2.0 |
Figure 2. Succinate does not prevent GM oxidation.
Mitochondria (0.9 mg/1.6 ml) were incubated as in Table 1 with variable succinate and constant GM (1 mM each). Results are for succinate alone (○) and succinate in the presence of GM (□). Results are means±S.D. for at least five independent experiments.
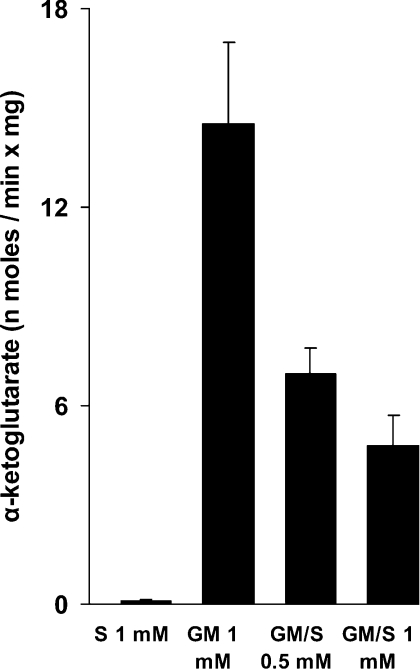
Although these results provide strong evidence in favour of the hypothesis that electrons actually flow downwards in Complex I also during the succinate-promoted H2O2 release in the presence of GM, they are not a direct demonstration that this really occurs. As a second approach to prove this point, we measured the generation of α-KG with GM in the absence and presence of succinate. The accumulation of α-KG is connected directly to the oxidation of GM, via glutamate dehydrogenase, or via glutamate/OAA (oxaloacetete) transaminase, where OAA originates from malate oxidation. As shown in Figure 3, α-KG accumulated during the oxidation of GM, but not during succinate oxidation. With GM, the further presence of succinate progressively decreased, but did not abolish, α-KG production. At 1 mM succinate, α-KG production was still 30% that of the control without succinate. These results are in agreement with the data on respiration presented above.
Figure 3. α-KG is produced during coupled oxidation of GM and succinate.
Mitochondria (4 mg/ml) were incubated for 10 min with 1 mM GM and succinate (S) as indicated. Extra GM (0.3 mM each) and succinate (0.5 mM) were added at 5 min. Results are means±S.D. for duplicate incubations from five preparations.
These experiments demonstrate conclusively that electrons keep flowing down from Complex I in the presence of succinate and during the process of succinate-supported H2O2 production.
H2O2 release is controlled by ΔpH
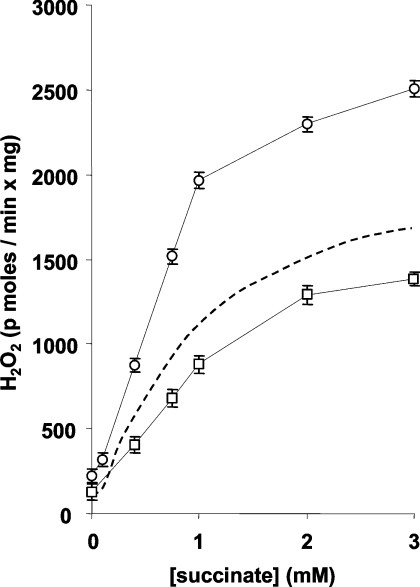
The succinate-induced H2O2 release is dependent on Δp across the inner mitochondrial membrane. However, Δp is the sum of two components, ΔΨ and ΔpH. It has been shown previously that ΔpH is a major controller of succinate-dependent H2O2 production [16]. In fact, the inclusion of the K+/H+ ionophore nigericin (in a high K+ medium) allows K+ equilibration and hence H+ equilibration (ΔpH=0); this results in a corresponding equivalent increase of ΔΨ to maintain Δp constant ([16], and results not shown). Under these conditions, the succinate promoted H2O2 release is at its lowest. The succinate titration of H2O2 release in the presence of nigericin and GM (Figure 4) shows that the overall production rate was depressed relative to that shown in Figure 1(B) (broken line), but that the pattern was unchanged. On the contrary, increasing ΔpH by omitting phosphate (whose influx via the Pi–H+ symporter decreases ΔpH) promoted a higher succinate-dependent H2O2 release [16], without changing the general behaviour in the presence of GM (Figure 4).
Figure 4. H2O2 release rates are controlled by ΔpH.
Conditions as in Figure 1 with 1 mM GM. The titration was performed in the presence of 100 nM nigericin (□) or in the absence of phosphate (○). The broken line represent values from Figure 1(B) (trace in the presence of 1 mM GM). Results are means±S.D. for at least four independent experiments.
Conclusions
The results of the present study show that the succinate stimulation of mitochondrial H2O2 release occurs at low concentrations and that the presence of GM modifies only marginally the succinate promotion of H2O2 release. Furthermore, GM oxidation is decreased, but not prevented, by succinate.
When both NADH and succinate are present (the in vivo situation), it appears that they compete for Complex I (or a part of it), the first pushing electrons down and the second pushing electrons up into the complex. The two processes appear to occur at the same time, possibly due to competition between regular quinone reduction from NADH and re-binding of the reduced species due to its higher concentration during the operation of Complex II. Electron backflow with succinate could mean just binding of QH2 (hydroquinone) originating from Complex II to the Q (quinone)-binding site on Complex I with O2− generation occurring right there (as speculated in [17]), instead of electrons going uphill to a different site of O2− production. In this view, the fact that GM are still oxidized in the presence of succinate does not contradict any conclusions drawn previously.
The high mitochondrial QH2/Q ratio induced by succinate appears to be the major determinant of H2O2 release. Similarly, GM alone induce high H2O2 release rates in cytochrome c-depleted mitochondria [20]. In the latter situation, the removal of cytochrome c decreases the rate of electron flow and consequently increases QH2/Q. A similar effect could occur following NO· inhibition of cytochrome oxidase [21,22].
Succinate concentration in vivo is controlled by the activity of the other dehydrogenases, which are NAD-dependent. It is significant that in vivo succinate concentration oscillates between 0.3 and 1 mM, as determined by Sato et al. [23] in perfused heart.
Preliminary results appear to indicate a similar organization of H2O2 release in heart mitochondria.
Acknowledgments
This work was supported by Ministero dell'Istruzione, dell'Università e della Ricerca, Progetti di Ricerca di rilevante Interesse Nazionale 2004 “Apoptosis and Mitochondria: New Targets in Neoplastic, Degenerative, and Immunologic Diseases”. Piericidin was a gift from Professor Giorgio Lenaz (Dipartimento di Biochimica “G. Moruzzi”, Via Irnerio 48, 40126 Bologna, Italy).
References
- 1.St-Pierre J., Buckingham J. A., Roebuck S. J., Brand M. D. Topology of superoxide production from different sites in the mitochondrial electron transport chain. J. Biol. Chem. 2002;277:44784–44790. doi: 10.1074/jbc.M207217200. [DOI] [PubMed] [Google Scholar]
- 2.Melov S., Coskun P., Patel M., Tuinstra R., Cottrell B., Jun A. S., Zastawny T. H., Dizdaroglu M., Goodman S. I., Huang T. T., et al. Mitochondrial disease in superoxide dismutase 2 mutant mice. Proc. Natl. Acad. Sci. U.S.A. 1999;96:846–851. doi: 10.1073/pnas.96.3.846. [DOI] [PMC free article] [PubMed] [Google Scholar]
- 3.Schriner S. E., Linford N. J., Martin G. M., Treuting P., Ogburn C. E., Emond M., Coskun P. E., Ladiges W., Wolf N., Van Remmen H., et al. Extension of murine life span by overexpression of catalase targeted to mitochondria. Science. 2005;308:1909–1911. doi: 10.1126/science.1106653. [DOI] [PubMed] [Google Scholar]
- 4.Turrens J. F., Alexandre A., Lehninger A. L. Ubisemiquinone is the electron donor for superoxide formation by Complex III of heart mitochondria. Arch. Biochem. Biophys. 1985;237:408–414. doi: 10.1016/0003-9861(85)90293-0. [DOI] [PubMed] [Google Scholar]
- 5.Halliwell B., Gutteridge J. M. C. 3rd edn. Oxford: Oxford University Press; 1999. Free Radicals in Biology and Medicine. [Google Scholar]
- 6.Cadenas E., Davies K. J. Mitochondrial free radical generation, oxidative stress, and aging. Free Radical Biol. Med. 2000;29:222–230. doi: 10.1016/s0891-5849(00)00317-8. [DOI] [PubMed] [Google Scholar]
- 7.Allen R. G., Tresini M. Oxidative stress and gene regulation. Free Radical Biol. Med. 2000;28:463–499. doi: 10.1016/s0891-5849(99)00242-7. [DOI] [PubMed] [Google Scholar]
- 8.Turrens J. F., Boveris A. Generation of superoxide anion by the NADH dehydrogenase of bovine heart mitochondria. Biochem. J. 1980;191:421–427. doi: 10.1042/bj1910421. [DOI] [PMC free article] [PubMed] [Google Scholar]
- 9.Hansford R. G., Hogue B. A., Mildaziene V. Dependence of H2O2 formation by rat heart mitochondria on substrate availability and donor age. J. Bioenerg. Biomembr. 1997;29:89–95. doi: 10.1023/a:1022420007908. [DOI] [PubMed] [Google Scholar]
- 10.Liu Y., Fiskum G., Schubert D. Generation of reactive oxygen species by the mitochondrial electron transport chain. J. Neurochem. 2002;80:780–787. doi: 10.1046/j.0022-3042.2002.00744.x. [DOI] [PubMed] [Google Scholar]
- 11.Korshunov S. S., Skulachev V. P., Starkov A. A. High protonic potential actuates a mechanism of production of reactive oxygen species in mitochondria. FEBS Lett. 1997;416:15–18. doi: 10.1016/s0014-5793(97)01159-9. [DOI] [PubMed] [Google Scholar]
- 12.Votyakova T. V., Reynolds I. J. ΔΨm-dependent and independent production of reactive oxygen species by brain mitochondria. J. Neurochem. 2001;79:266–277. doi: 10.1046/j.1471-4159.2001.00548.x. [DOI] [PubMed] [Google Scholar]
- 13.Han D., Canali R., Rettori D., Kaplowitz N. Effect of glutathione depletion on sites and topology of superoxide and hydrogen peroxide production in mitochondria. Mol. Pharmacol. 2003;64:1136–1144. doi: 10.1124/mol.64.5.1136. [DOI] [PubMed] [Google Scholar]
- 14.Zoccarato F., Toscano P., Alexandre A. Dopamine-derived dopaminochrome promotes H2O2 release at mitochondrial Complex I: stimulation by rotenone, control by Ca2+, and relevance to Parkinson disease. J. Biol. Chem. 2005;280:15587–15594. doi: 10.1074/jbc.M500657200. [DOI] [PubMed] [Google Scholar]
- 15.Zoccarato F., Cavallini L., Alexandre A. Respiration-dependent removal of exogenous H2O2 in brain mitochondria: inhibition by Ca2+ J. Biol. Chem. 2004;279:4166–4174. doi: 10.1074/jbc.M308143200. [DOI] [PubMed] [Google Scholar]
- 16.Lambert A. J., Brand M. D. Superoxide production by NADH:ubiquinone oxidoreductase (Complex I) depends on the pH gradient across the mitochondrial inner membrane. Biochem. J. 2004;382:511–517. doi: 10.1042/BJ20040485. [DOI] [PMC free article] [PubMed] [Google Scholar]
- 17.Lambert A. J., Brand M. D. Inhibitors of the quinone-binding site allow rapid superoxide production from mitochondrial NADH:ubiquinone oxidoreductase (Complex I) J. Biol. Chem. 2004;279:39414–39420. doi: 10.1074/jbc.M406576200. [DOI] [PubMed] [Google Scholar]
- 18.Sanadi D. R. α-Ketoglutarate dehydrogenase from pig heart. Methods in Enzymol. 1969;13:52–55. [Google Scholar]
- 19.McCormarck J. G., Denton R. M. The effects of calcium ions and adenine nucleotides on the activity of pig heart 2-oxoglutarate dehydrogenase complex. Biochem. J. 1979;189:533–544. doi: 10.1042/bj1800533. [DOI] [PMC free article] [PubMed] [Google Scholar]
- 20.Kushnareva Y., Murphy A. N., Andreyev A. Complex I-mediated reactive oxygen species generation: modulation by cytochrome c and NAD(P)+ oxidation–reduction state. Biochem. J. 2002;368:545–553. doi: 10.1042/BJ20021121. [DOI] [PMC free article] [PubMed] [Google Scholar]
- 21.Mason M. G., Nicholls P., Wilson M. T., Cooper C. E. Nitric oxide inhibition of respiration involves both competitive (heme) and noncompetitive (copper) binding to cytochrome c oxidase. Proc. Natl. Acad. Sci. U.S.A. 2006;103:708–713. doi: 10.1073/pnas.0506562103. [DOI] [PMC free article] [PubMed] [Google Scholar]
- 22.Antunes F., Boveris A., Cadenas E. On the mechanism and biology of cytochrome oxidase inhibition by nitric oxide. Proc. Natl. Acad. Sci. U.S.A. 2004;101:16774–16779. doi: 10.1073/pnas.0405368101. [DOI] [PMC free article] [PubMed] [Google Scholar]
- 23.Sato K., Kashiwaya Y., Keon C. A., Tsuchiya N., King M. T., Radda G. K., Chance B., Clarke K., Veech R. L. Insulin, ketone bodies, and mitochondrial energy transduction. FASEB J. 1995;9:651–658. doi: 10.1096/fasebj.9.8.7768357. [DOI] [PubMed] [Google Scholar]


