Abstract
The peroxisome proliferator-activated receptor-β (PPARβ) has been implicated in tumorigenesis, but its precise role remains unclear. Here, we show that the growth of syngeneic Pparb wild-type tumors is impaired in Pparb−/− mice, concomitant with a diminished blood flow and an abundance of hyperplastic microvascular structures. Matrigel plugs containing pro-angiogenic growth factors harbor increased numbers of morphologically immature, proliferating endothelial cells in Pparb−/− mice, and retroviral transduction of Pparb triggers microvessel maturation. We have identified the Cdkn1c gene encoding the cell cycle inhibitor p57Kip2 as a PPARβ target gene and a mediator of the PPARβ-mediated inhibition of cell proliferation, which provides a possible mechanistic explanation for the observed tumor endothelial hyperplasia and deregulation of tumor angiogenesis in Pparb−/− mice. Our data point to an unexpected essential role for PPARβ in constraining tumor endothelial cell proliferation to allow for the formation of functional tumor microvessels.
Keywords: hyperplasia, peroxisome proliferator-activated receptor β/δ, p57KIP2/Cdkn1c, tumor angiogenesis, tumor growth
Introduction
Peroxisome proliferator-activated receptors (PPARs) are nuclear receptors that function as transcription factors and modulate target gene expression in response to endogenous and exogenous ligands (Barish et al, 2006; Desvergne et al, 2006; Feige et al, 2006). The PPAR family consists of three members, PPARα, PPARβ/δ and PPARγ, whose major physiological functions are associated with the regulation of intermediary metabolism. All PPARs are activated by fatty acids and some derivatives, but there are no known subtype-specific, high-affinity endogenous ligands, suggesting that PPARs act as intracellular lipid sensors (Forman et al, 1997; Desvergne et al, 2006). However, PPARs are highly relevant drug targets, which has led to the development of several synthetic drug agonists showing increased subtype selectivity and high-affinity binding (Peraza et al, 2006). PPARs form obligatory heterodimers with the nuclear receptor RXRα on PPAR response elements (PPREs) in their target genes resulting in transcriptional activation. PPARs can also repress genes by directly interacting with specific transcription factors and recruiting corepressor proteins (Lee et al, 2003).
It has recently been shown that PPARβ has a critical role in modulating skeletal muscle lipid catabolism, glucose homeostasis and macrophage activation (Barish et al, 2006; Desvergne et al, 2006). Thus, PPARβ represents a new potential drug target for the treatment of major human diseases such as obesity, metabolic syndrome, inflammation and arteriosclerosis. Intriguingly, PPARβ also promotes cellular differentiation and inhibits proliferation and apoptosis of different cell types (Tan et al, 2001; Schmuth et al, 2004; Kim et al, 2006; Nadra et al, 2006; Varnat et al, 2006). Pparb-null mice exhibit a defect in wound healing, and increased keratinocyte proliferation occurs in the skin of Pparb-null mice treated with a tumor promoter (Peters et al, 2000; Michalik et al, 2001). Furthermore, ligand activation of PPARβ selectively stimulates keratinocyte differentiation and inhibits proliferation (Kim et al, 2006), concomitant with a ubiquitin-mediated downregulation of protein kinase C-α and MAP kinase signaling (Kim et al, 2005).
Consistent with its function in differentiation and proliferation, PPARβ plays a role in intestinal tumorigenesis. In the human colon cancer cell line HCT116, Pparb disruption has been reported to result in a loss of tumorigenicity (Park et al, 2001). However, in intestinal tumor mouse models, PPARβ affected adenoma growth to a variable extent in different studies (Barak et al, 2002; Gupta et al, 2004; Harman et al, 2004; Reed et al, 2004; Marin et al, 2006). Both, the homozygous deletion of Pparb (Harman et al, 2004; Reed et al, 2004) and the pharmacological activation of PPARβ (Gupta et al, 2004; Marin et al, 2006), have been shown to exert subtle, although statistically significant effects on adenoma growth, but the precise function of PPARβ in intestinal tumor cells remains controversial (Burdick et al, 2006).
None of the mouse studies performed to date addressed the issue as to whether PPARβ might play a role in the cells of the tumor stoma, that is, host cells recruited by the tumor, such as endothelial cells (ECs), fibroblasts and macrophages (Bissell and Radisky, 2001). In the present study, we have specifically addressed this question.
Results
Inhibition of tumor growth in Pparb−/− mice
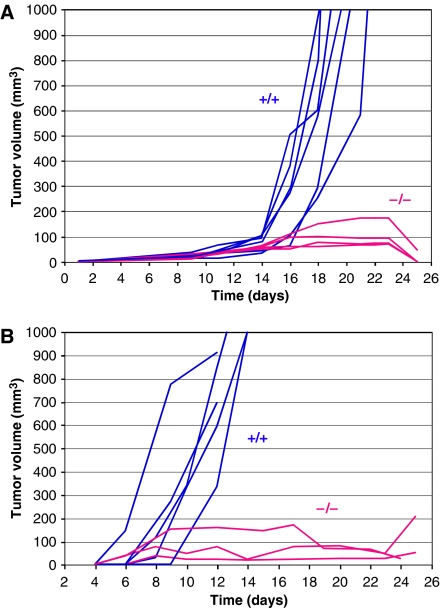
We first asked whether the genetic status of Pparb in host cells would affect the growth of transplanted syngeneic tumor cells. Pparb−/− mice have been described previously and shown to lack PPARβ protein in all tissues analyzed (Peters et al, 2000; Harman et al, 2004). This was confirmed in the present study for fibroblasts and ECs as typical stromal cell types (Supplementary Figure S1). Lewis lung carcinoma (LLC1) cells were inoculated subcutaneously into Pparb+/+ and Pparb−/− mice. Rapid and progressive tumor growth was observed in all Pparb+/+ mice (n=15), invariably leading to death within 24 days. Tumor growth in Pparb−/− mice (n=11) was initially indistinguishable from Pparb+/+ mice, but halted after approximately 14 days, resulting in 100% survival 32 days after tumor cell implantation, and 90.9% survival after >6 months (Figure 1A; Table I). We also observed a dramatic inhibition of tumor growth with the B16F1 melanoma model (Figure 1B). While the inoculated Pparb+/+ mice invariably succumbed to the B16F1 tumors within 14 days, all Pparb−/− mice showed a clear retardation of tumor growth (Figure 1B; n=8), and exhibited a survival rate of 100% on day 24.
Figure 1.
Blockade of syngeneic tumor growth in Pparb−/− mice. Pparb+/+ and Pparb−/− mice were inoculated subcutaneously with LLC1 (A) or B16F1 cells (B), and tumor sizes were determined at the times indicated. Blue lines: Pparb+/+ mice; red lines: Pparb−/− mice. Mice were killed when the calculated tumor volume exceeded 1000 mm3, or when tumors became necrotic. Panel A shows one of the two independent experiments summarized in Table I.
Table 1.
Growth of LLC1 tumors in syngeneic Pparb+/+ and Pparb−/− mice
| Genotype | Tumor volume (mm3) | Doubling time (days) | Survival (n) | |
|---|---|---|---|---|
| Day 9 | Day 9–14 | Day 14–21 | >Day 24 | |
| Pparb+/+ | 6.4±5.4a | 2.3±1.4a | 1.4±0.2b | 0/15 |
| Pparb−/− | 7.5±4.9a | 2.7±1.3a | >13b | 11/11c |
| a Differences between Pparb+/+ and Pparb−/− mice not significant (t-test; P>0.6). | ||||
| b Differences highly significant (P=0.03). | ||||
| c Ten tumors regressed completely, one mouse was killed after 33 days (P<0.0001). Data are obtained from two separate experiments (n=26). | ||||
Abnormal microvascular structures in Pparb−/− mice
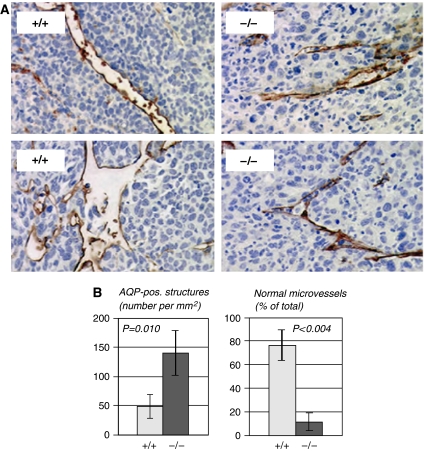
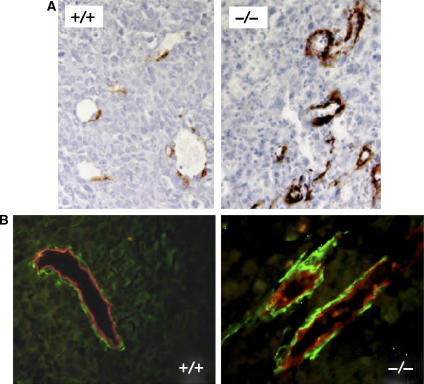
Blood vessels in LLC1 tumors were visualized by immunohistochemistry using an antibody directed against aquaporin-1 (AQP-1), a specific marker for ECs and erythrocytes (Saadoun et al, 2005). Microvessels with a thin lining of ECs and an open lumen with erythrocytes were readily detected in LLC1 tumors from Pparb+/+ mice (Figure 2A). In contrast, microvessels with a normal appearance were rare in LLC1 tumors from Pparb−/− mice, where ECs were found mainly in highly abnormal structures lacking a lumen (Figure 2A). These presumably defective microvessels were frequently located in areas of extensive tumor necrosis, as exemplified in Figure 2A by the cellular debris seen around the abnormal vascular structures. Importantly, immunostaining with antibodies for macrophages, neutrophils or lymphocytes (Supplementary data) revealed only very few cells in tumors of either genotype, clearly suggesting that inflammatory and immune cells did not play an essential role in supporting or restraining LLC1 tumor growth (data not shown).
Figure 2.
Immunohistological analysis of ECs in LLC1 tumors. (A) AQP-1 immunostaining (Saadoun et al, 2005) of ECs and blood vessels in subcutaneous LLC1 tumors 14 days after inoculation into Pparb+/+ and Pparb−/− mice (brown stain). Microscopic magnification, × 50. Areas of tumor cell necrosis are seen in the vicinity of aberrant vascular structures in Pparb−/− mice (debris). These differences between Pparb+/+ and Pparb−/− mice were independent of tumor size and were confirmed by using antibodies against von Willebrand factor or CD34 (data not shown). (B) Quantitative evaluation of AQP-1-positive structures in LLC1 tumors from Pparb+/+ and Pparb−/− mice. The indicated P-values were determined by t-test.
Surprisingly, a quantitative evaluation revealed a three-fold higher microvascular density in LLC1 tumors from Pparb−/− mice (Figure 2B, left panel; n=8; P=0.010). However, while 76% of these structures represented morphologically normal microvessels in Pparb+/+ mice, this was reduced to 11.8% in Pparb−/− mice (Figure 2B, right panel; n=8; P=0.010). These observations suggest that an abnormal organization rather than a lack of ECs underlies the abundance of abnormal microvessels in Pparb−/− mice.
Diminished blood flow in LLC1 tumors in Pparb−/− mice
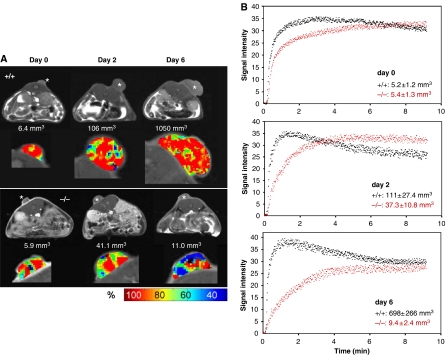
Functional evidence for a tumor vascularization defect in Pparb−/− mice was obtained by dynamic contrast-enhanced magnetic resonance imaging (DCE-MRI) (Choyke et al, 2003; Kiessling et al, 2003). Contrast medium (diethylenetriamine pentaacetic acid; Gd-DTPA) was injected into three PPARb+/+ and three PPARb−/− mice and tumor accumulation was monitored over 9 min. All tumors had a similar volume at the beginning of the analysis (5.3±1.3 mm3; day 0 in Figure 3B). Measurements were repeated after 2 and 6 days with the identical animals. Tumors in Pparb+/+ mice showed continuous progression, reaching sizes of >1000 mm3, whereas tumors in Pparb−/− mice grew much slower followed by a partial regression. Kinetic analysis of Gd-DTPA accumulation in tumors revealed a rapid and high amplitude wash-in followed by a clearly discernible wash-out phase in Pparb+/+ mice at all time points analyzed (Figure 3B), indicative of functional vascularization (Choyke et al, 2003; Kiessling et al, 2003). In contrast, Pparb−/− mice showed a progressive delay of wash-in and no wash-out phase, indicating an obstructed blood flow into and through the tumor tissue (Figure 3B). Analysis of dynamic Gd-DTPA within individual tumors showed a relatively even distribution in tumors in Pparb+/+ mice, whereas large regions of decreased accumulation were seen in Pparb−/− mice, especially in the regressing tumors (green/blue areas in Figure 3A) next to regions showing rapid accumulation (red areas in Figure 3A). These observations are consistent with the histological analyses showing that a large fraction of tumor microvessels is abnormal in Pparb−/− mice.
Figure 3.
Magnetic resonance image analysis of LLC1 tumors. (A) DCE-MRI analysis of LLC1 tumors in PPARb+/+ and PPARb−/− mice at different stages of tumor development. Pparb+/+ and Pparb−/− mice harboring tumors of similar size were selected, and DCE-MRI analyses were performed at the beginning of the experiment (designated day 0) and after 2 and 6 days. During this time Pparb+/+ mice showed progressive growth, while tumors in Pparb−/− mice regressed after an initial growth phase. The respective tumor volumes are indicated in the figure. Top rows (gray scale): MRI images obtained before administration of contrast medium. *s.c. LLC1 tumors. Bottom rows (pseudo-color images): DCE-MRI analysis of tumors 100 s. after i.v. injection of contrast medium. Red areas represent regions of maximum enhancement of signal intensities based on shortened T1 relaxation times caused by contrast medium accumulation in the vascular and extravascular extracellular space. Green/blue areas represent regions of lower signal intensity enhancement indicating decreased influx of contrast medium (see scale for color codes). (B) Quantification of DCE-MRI analysis of tumors in PPARb+/+ (black dots) and PPARb−/− (red dots) mice performed as in panel A. The data show the enhancement of signal intensities (shortened T1 relaxation times; arbitrary units) during the first 9 min after the injection of contrast medium. Data represent absolute values. Tumor volumes are shown as means±s.d. Three mice of each genotype were analyzed.
Endothelial hyperplasia in LLC1 tumors in Pparb−/− mice
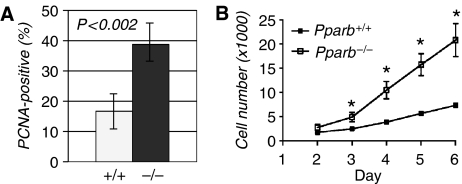
To examine the cellular basis underlying the observed vascular phenotype we performed double immunostaining for AQP-1 and proliferating cell nuclear antigen (PCNA). A considerably higher number of PCNA-positive cells in tumors was found in Pparb−/− mice as compared with Pparb+/+ mice (38.7 versus 16.6%; Figure 4A; n=8; P=0.010). Consistent with these in vivo observations, we found that the proliferation of primary aortic ECs from Pparb−/− mice was enhanced compared to Pparb+/+ cells cultured on a tumor basement membrane-derived matrix (matrigel), in the presence of pro-angiogenic growth factors (Figure 4B).
Figure 4.
Effect of PPARβ on endothelial cell proliferation. (A) Proliferative index of ECs in LLC1 tumors from Pparb+/+ and Pparb−/− mice determined as the PCNA-positive fraction (%) of AQP-1-positive cells. The indicated P-values were determined by t-test. (B) Proliferation of primary aortic ECs from Pparb+/+ and Pparb−/− mice. Cells were seeded in tissue culture plates and cell numbers were determined for up to 6 days. Cells isolated from each mouse were kept separate and data represent the mean result obtained from 2–3 mice per genotype. *Statistically significant from Pparb+/+ (t-test, P⩽0.05). We also observed differentiation of aortic ECs from mice of both genotypes into tube-like structures in the matrigel. While differentiation of Pparb−/− EC cells seemed to be retarded compared with Pparb+/+, cells we were unable to demonstrate definitive morphological differences (not shown).
Microvessels in Pparb−/− mice were typically lined by morphologically less mature ECs frequently protruding into the vessel lumen reminiscent of endothelial hyperplasia. These vessels were surrounded by rings of cells strongly expressing the myofibroblast/pericyte marker smooth muscle α-actin (SMA) (Bissell and Radisky, 2001) (Figure 5A and B). Hyperplastic tumor endothelial structures were also found in the absence of adjacent perivascular SMA expressing cells, indicating that the occurrence of these SMA-positive cells is not a prerequisite for vascular dysfunction.
Figure 5.
Immunostaining of SMA in LLC tumors. (A) SMA immunostaining of LLC1 tumors from Pparb+/+ and Pparb−/− mice. Microscopic magnification, × 50. (B) AQP-1/SMA double immunofluorescence of LLC1 tumors from Pparb+/+ and Pparb−/− mice. Red, AQP-1, green: SMA. Microscopic magnification, × 50.
Immature, hyperproliferative ECs in matrigel plugs in Pparb−/− mice
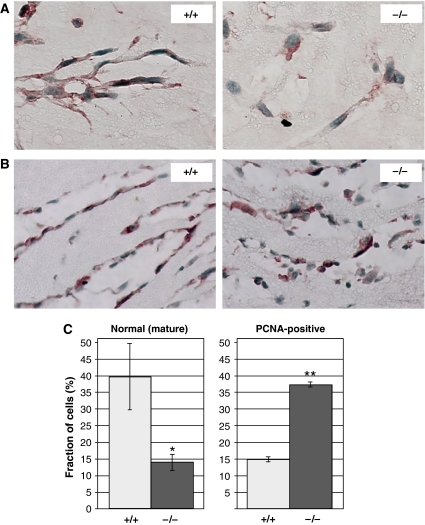
To study the role of PPARβ in an independent in vivo angiogenesis assay, we performed matrigel plug assays (Ley et al, 2004) using prostaglandin E2 (PGE2) and basic fibroblast growth factor (FGF-2) as angiogenic stimuli. These subcutaneous plugs became rapidly invaded by AQP-1-positive cells (Figure 6A and B). In Pparb+/+ mice, the invading cells aligned within 3 days to form network-like structures consisting of elongated cells connected by dendritic processes (Figure 6A, left panel). These ordered structures were largely absent from matrigel plugs in Pparb−/− mice (Figure 6A, right panel). While morphologically mature cells (flat, elongated cells with processes) represented 39.6±10.0% of cells in microvascular structures in Pparb+/+ mice, the corresponding value was 13.9±2.3% for Pparb−/− mice (Figure 6C, left panel). Matrigel plugs in Pparb+/+ mice also contained more advanced structures lined by elongated ECs (Figure 6B, left panel), whereas morphologically aberrant cells protruding into the lumen were seen in Pparb−/− mice (Figure 6B, right panel). Consistent with the hyperproliferation of tumor ECs shown above, we found a significantly higher proportion of PCNA-positive cells in matrigel plugs from Pparb−/− mice (37.2±0.7%), compared with Pparb+/+ mice (14.8±0.8%; Figure 6C, right panel).
Figure 6.
Analysis of PPARβ function in angiogenic ECs in vivo. (A, B) AQP-1 staining of formalin-fixed and paraffin-embedded of bFGF/PGE2 containing matrigel plugs (Ley et al, 2004) 3 days after s.c. implantation into Pparb+/+ and Pparb−/− mice. Microscopic magnification, × 100 (A) and × 50 (B). The images show the formation of network-like structures in Pparb+/+ mice. Panel B shows more advanced stages of microvessel formation. Very similar results were obtained with fluorescently labeled isolectin B4 (data not shown), a selective label for mouse blood vessels (Kawamoto et al, 2003). (C) Quantitative evaluation of morphologically mature (left panel) and PCNA-positive (right panel) ECs in matrigel plugs. ***Statistically significant difference to Pparb+/+ (t-test, P⩽0.05).
Consistent with its essential role in tumor vascularization, we also found that Pparb is the predominant Ppar subtype expressed in angiogenic matrigel plugs, in mouse ECs isolated from subcutaneous tumors (Supplementary Figure S2), and in tumor ECs from human lung carcinomas (Supplementary Figure S3), and that it is inducible by angiogenic growth factors in ECs in vitro (Supplementary Figure S4).
Restoration of PPARβ expression triggers microvessel maturation
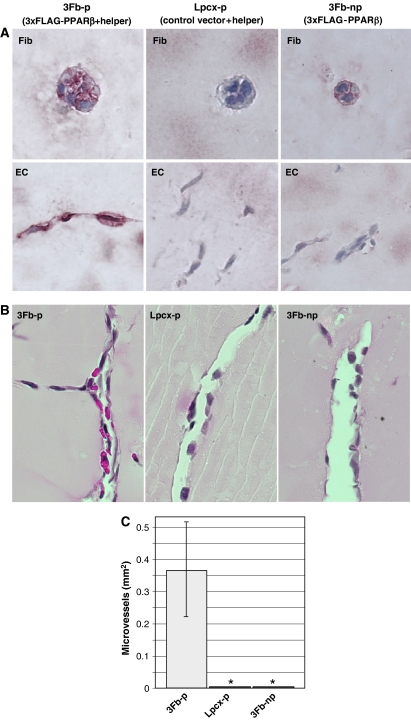
To determine whether re-expression of PPARβ in matrigel-invading cells would restore normal vascularization in Pparb−/− mice, we established a syngeneic fibroblast producer line (3Fb-p cells) expressing FLAG-PPARβ and helper retroviruses (Supplementary Figure S1). Matrigel plugs containing these cells were used with the same experimental design described above. Immunohistological analysis of matrigel plugs 3 days post-implantation showed FLAG-positive implanted fibroblasts (occurring in small colonies) and FLAG-positive host ECs, whereas the inclusion of transduced control cells either lacking the FLAG-PPARβ retrovirus (Lpcx-p cells) or the helper virus (3Fb-np non-producer cells) did not yield any FLAG-specific host cell staining (Figure 7A). Concomitant with this viral spread and re-expression of PPARβ in the invading host cells, we observed the appearance of vessels containing erythrocytes lined by morphologically normal ECs, whereas in the presence of either control cell line, microvascular structures remained abnormal and were devoid of red blood cells without exception (Figure 7B and C). This observation provides additional strong evidence for a role of PPARβ in promoting vascularization in a mouse model of tumor angiogenesis.
Figure 7.
Promotion of microvessel maturation in Pparb−/− mice by PPARβ expressing retroviruses. (A) Immunohistochemical staining for PPARβ of matrigel plugs containing retroviral producer cells. Pparb−/− fibroblasts were infected with a replication-deficient retrovirus expressing an fully functional N-terminally triple-FLAG-tagged PPARβ. A non-producer clone (3Fb1 cells) showing FLAG expression in nearly 100% of the population and a control line harboring empty pLPCX vector (Lpcx cells) were chosen for subsequent studies. From both cell lines we generated virus-producer lines (3Fb1-p and Lpcx-p, respectively) by super-infection with an Mo-MuLV-based helper virus. These producer cells were included in matrigel plugs containing PGE2 and FGF-2. Immunohistological analysis of matrigel plugs 3 days post-implantation showed FLAG-positive fibroblasts (occurring in small colonies; ‘Fib' in the figure above) and FLAG-positive, AQP-1-positive cells (‘EC' in the figure above) in the presence of 3Fb-p cells (left); FLAG-negative implanted fibroblasts and FLAG-negative host cells in control Lpcx-p containing plugs (middle); and FLAG-positive fibroblasts and FLAG-negative host cells in non-producer 3Fb-np containing plugs (right). (B) Effect of restored PPARβ expression on microvessel formation in FGF-2/PGE2 matrigel plugs in Pparb−/− mice. Morphologically mature erythrocyte containing microvessels were induced by 3Fb-p cells (left panel), but not by control producer cells (Lpcx-p) or non-producer 3Fb-np cells. The pictures show HE-stained paraffin sections. Microscopic magnification, × 50. (C) Quantitative evaluation of morphologically normal microvessels in the matrigel plugs shown in panel B. *Statistically significant difference to 3Fb-p (t-test, P⩽0.05).
Altered gene expression in matrigel-invading cells in Pparb−/− mice
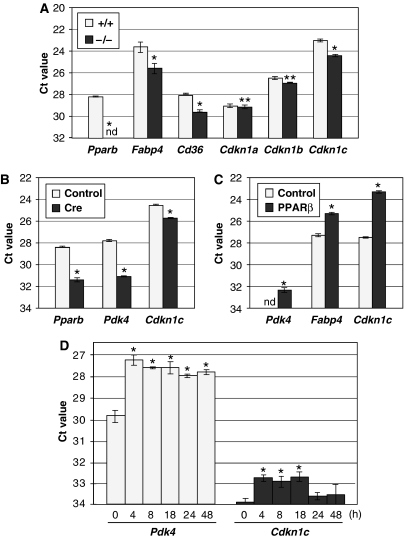
Cells from matrigel plugs were analyzed by qPCR for the expression of EC, fibroblast and macrophage marker genes (Aqp-1, Cd105, vimentin, Cd14, Cd68, F4/80). No significant differences were detectable between Pparb+/+ and Pparb−/− samples (Supplementary Figure S5, and data not shown), indicating a very similar composition of cell types. To identify angiogenesis-associated PPARβ target genes, we first analyzed a number of known genes (including all VEGFs, Flk-1, Angiopoietin-1/2, Tie-1/2, VE-cadherin), but could not detect any significant differences among Pparb+/+ and Pparb−/− samples (data not shown). We therefore compared the gene expression profile of both samples by microarray analysis (ArrayExpress, E-MEXP-983). In Pparb+/+ cells, 39 genes were found to be expressed at higher levels, while 27 genes showed lower expression (cut-off 1.7-fold; Supplementary Table S1). As expected, several of these genes encode proteins with functions in lipid metabolism that have previously been identified as PPAR target genes, that is, fatty acid binding protein 4 (Fabp4 gene), acyl-CoA dehydrogenase (long-chain; Acadl gene), stearoyl-CoA desaturase 1 (Scd1 gene) and the CD36 fatty acid translocase/thrombospondin receptor (Cd36 gene) (see references in Supplementary Table S1). Differential expression in Pparb+/+ and Pparb−/− cells was verified by qPCR for a subset of genes, with a focus on those coding for regulatory proteins (Supplementary Figure S5). Of these genes, Cdkn1c is of particular interest due to the established direct role of its encoded protein p57KIP2 as a negative regulator of the cell cycle (Lee et al, 1995). We also analyzed the expression of genes coding for other CDK inhibitors (Cdkn1a, Cdkn1b, Cdkn2a, Cdkn2b, Cdkn2c), but were unable to detect significant differences between Pparb+/+ and Pparb−/− mice (Figure 8A, and data not shown). Importantly, we found readily detectable levels of Cdkn1c expression in ECs isolated from four independent samples of primary human lung carcinomas (Supplementary Figure S3), which is consistent with a potential role in tumor vascularization. We therefore focused on Cdkn1c in all subsequent experiments.
Figure 8.
Regulation of Cdkn1c expression by PPARβ. (A) Gene expression patterns of matrigel-invading cells from Pparb+/+ and Pparb−/− mice 3 days after implantation were analyzed by qPCR. Data represent the mean values for three individual plugs from each genotype (±s.d.) normalized to Arp0 (Ct=17). (B) Effect of Cre-mediated Pparb disruption on the Cdkn1c gene. Lung fibroblasts with floxed PPARb (LF-Flox-PPARb cells) were infected with a Cre retrovirus (Li et al, 1997) or with control virus (pBABE), and the isolated RNA was analyzed by qPCR for expression of the genes indicated. Pdk4 and Fabp4 are known PPAR target genes and were included as positive controls. Values represent Ct values (averages of triplicates±s.d.) normalized to Arp0 (Ct=18). The Pparb primers used in this panel recognize only the floxed allele. (C) Effect of PPARβ re-expression in Pparb−/− cells on Cdkn1c and known PPAR target gene. Expression patterns of FLAG-PPARβ expressing 3Fb and control Lpcx cells were compared by qPCR. Values represent Ct values (averages of triplicates±s.d.) normalized to L27 (Ct=17). (D) Induction of the Cdkn1c gene by 1 μM GW501516 in HUVECs. Cells were treated for the indicated times, RNA was isolated and analyzed by qPCR. Pdk4 was included as a known PPAR target gene (positive control). Values represent Ct values (averages of triplicates±s.d.) normalized to Arp0 (Ct=17). *Values significantly different (P<0.05) between Pparb−/− cells Pparb−/− cells (panels A–C) or from time=0 (panel D). **Differences not significant (P>0.05). nd: not detectable.
Confirmation of Cdkn1c as a PPARβ target gene
To obtain independent evidence that the Cdkn1c gene is regulated by PPARβ, we used fibroblasts established from a mouse strain with a floxed Pparb allele (Barak et al, 2002). Figure 9 shows that the expression of Cdkn1c was reduced ∼2.5-fold after infection with a Cre expressing retrovirus (Li et al, 1997) relative to control virus infected cells. As a positive control, we included the known PPAR target gene Pdk4 (coding for pyruvate dehydrogenase kinase-4) (Kitz Kramer et al, 2007), which also showed the expected reduction (∼8-fold) in the PPARb-deleted cells.
Figure 9.
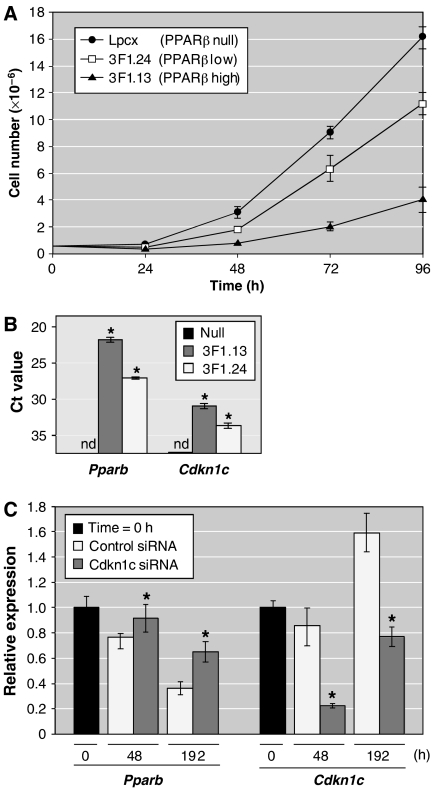
PPARβ mediated inhibition of cell proliferation involves p57KIP2. (A) Growth curves of cells expressing different levels of PPARβ as indicated in the figure. Lpcx cells: Pparb−/− fibroblasts infected with a control retrovirus (pLPCX); 3F1.13 and 3F1.24 cells: FLAG-PPARβ retrovirus infected Pparb−/− fibroblasts. 3F1.24 cells are a derivative of 3F1.13 cells. Cells were seeded at a density of 0.5 × 10⁵ cells/3 cm dish and triplicates were counted every 24 h for 96 h. Data represent the mean of triplicates (±s.d.). (B) Pparb and Cdkn1c expression (qPCR) in the cell lines used in A. Values represent Ct values (averages of triplicates±s.d.) normalized to L27 (Ct=19). *Values significantly different from Lpcx versus 3F1.13 or 3F1.24 cells (P<0.05). (C) Effect of Cdkn1c knockdown on PPARβ-mediated growth inhibition. Pparb−/− cells infected with a FLAG-PPARβ retrovirus (as in A) were subcultured and transfected with siRNA 3-times over 144 h (Supplementary data). Pparb and Cdkn1c mRNA levels were measured at different time points up to 192 h after the first transfection. Values represent Ct values (averages of triplicates±s.d.) normalized to Arp0 (Ct=17). *Values significantly different from cells treated with control siRNA (P<0.05). nd: not detectable.
We next investigated whether the change in Cdkn1c expression in PPARβ-deficient cells could be ‘rescued' by retrovirus-mediated re-expression of PPARβ. As shown in Figure 8C, Pparb−/− fibroblasts infected with the PPARβ retrovirus expressed the Cdkn1c gene at ∼8-fold elevated levels. As expected, the bona fide PPAR target genes Pdk4 and Fapb4 also showed a clear upregulation.
We also studied the inducibility of Cdkn1c by the synthetic PPARβ-selective agonist, GW501516 (1 μM), in human umbilical vein ECs (HuVECs). In this setting, the Pdk4 gene was rapidly induced within 4 h by a factor of ∼4, as expected (Figure 8D). Likewise, Cdkn1c expression increased more than two-fold at 4 h post-treatment, decreasing to near basal levels at 24 h, confirming that Cdkn1c is a PPARβ target gene.
Inspection of the mouse Cdkn1c upstream sequence revealed two motifs at positions –1670 and –710 fitting the PPRE consensus sequence (Supplementary Figure S6, top panel). We cloned a 1.7-kb Cdkn1c promoter fragment harboring these elements, in front of a luciferase reporter gene, and analyzed this construct in mouse 2H11 ECs. We observed a 1.8-fold induction after cotransfection of PPARβ and RxRα expression plasmids, which was further increased by the PPARβ agonist GW501516 to 2.6-fold (Supplementary Figure S6). These data clearly confirm that Cdkn1c induction by PPARβ is mediated by a transcriptional mechanism.
PPARβ-mediated inhibition of cell proliferation involves p57KIP2
We next sought to investigate the growth inhibitory effect of PPARβ on a stroma cell type in further detail using a cell culture model. As shown in Figure 9A, infection of Pparb−/− cells with FLAG-PPARβ retrovirus resulted in a strong inhibition of cell proliferation compared with control virus infected cells (3F1.13 versus Lpcx cells). This growth inhibitory effect of PPARβ imposes a selection pressure against PPARβ expressing cells. Thus, the continuous passaging of 3F1.13 cells resulted in a clear decrease in PPARb expression (subline 3F1.24; Figure 9B), which correlated with an increase in proliferation (Figure 9A). However, 3F1.24 cells still proliferate more slowly than the Pparb−/− Lpcx cells, suggesting that a relatively low level of PPARβ suffices to attenuate cell proliferation (PPARb expression in 3F1.24 cells is similar to that in wild-type fibroblasts; data not shown). Importantly, both the level of PPARb and the extent of growth inhibition correlated with the level of Cdkn1c in the cell lines analyzed (Figure 9B).
To obtain direct evidence for a role of Cdkn1c in the inhibition of proliferation by PPARβ, we studied the effect of a Cdkn1c knockdown on the selection against PPARβ expressing cells in culture. Pparb−/− cells infected with a FLAG-PPARβ retrovirus were repeatedly passaged, and at each passage were treated with either a Cdkn1c-directed siRNA or an irrelevant control siRNA for a total period of 192 h. As shown in Figure 9C, Cdkn1c siRNA treatment reduced the level of Cdkn1c by 74% compared with the control siRNA at 48 h. Cdkn1c is a cell density-regulated gene (Samuelsson et al, 1999), which presumably caused the increased levels at 192 h in both Cdkn1c- and control siRNA-treated cells. Nevertheless, Cdkn1c levels were still 52% lower in the presence of Cdkn1c siRNA.
In control siRNA-treated cells, PPARb expression showed the expected rapid decline (76% after 48 h; 36% after 192 h), reflecting the selection pressure against PPARβ expressing cells. In contrast, Cdkn1c siRNA treatment resulted in significantly increased PPARb expression levels at both time points (92 and 65%, respectively). The clear loss of Pparb expression in the presence of Cdkn1c siRNA strongly suggests that Cdkn1c is a mediator of PPARβ-dependent inhibition of cell proliferation.
Discussion
Impaired tumor vascularization and tumor EC hyperplasia in Pparb−/− mice
A hallmark of tumors in Pparb−/− mice is the abundance of histologically highly abnormal microvessels showing a thickened endothelial lining and lacking a lumen, thus appearing dysfunctional (Figure 2). These alterations were associated with a striking increase in both tumor microvessel density and tumor EC proliferation (Figure 4A). Abnormal hyperproliferative endothelial structures were also seen in matrigel plugs (Figure 6), but never in any normal tissue of Pparb−/− mice. Thus, Pparb−/− ECs hyperproliferate under conditions resembling a tumor microenvironment. Concomitant with this hyperproliferation, tumor microvessels in Pparb−/− mice typically consist of immature ECs surrounded by perivascular cells expressing vast amounts of SMA (Figure 5), a condition characteristic of endothelial hyperplasia. That these histological abnormalities are functionally relevant, was demonstrated by kinetic DCE-MRI analysis of LLC1 tumors (Figure 3), which showed an obstructed tumor blood flow in Pparb−/− mice.
These observations strongly suggest that an abnormal organization caused by a hyperplastic response rather than a lack of ECs underlies the abundance of abnormal microvessels in Pparb−/− mice. However, the presence of a small fraction (11.8%) of morphologically normal tumor microvessels in Pparb−/− mice (Figure 2) obviously suffices to permit the formation of functional blood vessels, as indicated by the DCE-MRI analysis (Figure 3), which showed small but clearly detectable areas of blood flow even in regressing tumors in Pparb−/− mice. This small fraction of apparently functional tumor microvessels in Pparb−/− mice obviously suffices to permit tumor growth to volumes of <100 mm3 (Figure 1), which is clearly beyond the angiogenic threshold (Folkman, 2002), that is, the maximum size achievable by avascular tumors (approximately 4 mm3). Together, these data indicate that tumor neoangiogenesis is principally functional in Pparb−/− mice, but that a significant fraction of tumor microvessels is abnormal and dysfunctional, leading to an inhibition of tumor growth.
Even though a defect in angiogenesis has not been observed during normal development of Pparb−/− mice (Peters et al, 2000; Michalik et al, 2001; Barak et al, 2002; Nadra et al, 2006), our findings are in agreement with previous findings showing that PPARβ regulates terminal differentiation and has a negative regulatory role in the proliferation of different cell types, including keratinocytes (Tan et al, 2001; Schmuth et al, 2004; Kim et al, 2006; Burdick et al, 2007), trophoblast giant cells (Nadra et al, 2006) and intestinal epithelial cells (Marin et al, 2006; Varnat et al, 2006). This suggests that PPARβ is specifically required by tumor ECs to orchestrate their proliferation and differentiation in an environment, providing an abnormally rich source of growth factors and cytokines. This interpretation is consistent with our observations that the fraction of PCNA-positive matrigel-invading cells was 2.5-fold higher in Pparb−/− mice (Figure 6C), and that primary aortic ECs from Pparb−/− mice showed enhanced proliferation in vitro (Figure 4B). In both situations, ECs were exposed to high levels of soluble pro-angiogenic growth factors and a tumor basement membrane-derived matrix (matrigel).
A subtype-specific role for PPARβ in tumor ECs?
The three known PPAR subtypes have partially overlapping functions. Supplementary Figure S2 shows that in contrast to liver, Pparb is the predominant subtype in matrigel-invading cells. Likewise, in mouse ECs isolated from subcutaneous tumors (Supplementary Figure S2) and in ECs from primary human lung tumors (NSCLC) Pparb was the predominant subtype (Supplementary Figure S3). These observations point to a PPARβ-subtype specific function in tumor angiogenesis consistent with the phenotype observed in Pparb−/− mice. This is further supported by the induction of Pparb by angiogenic growth factors in cultured ECs (Supplementary Figure S4).
Altered Cdkn1c gene expression in Pparb−/− stroma cells
To address the molecular mechanisms underlying the observed phenotypic effects, we sought to identify genes that are regulated by PPARβ in vivo under conditions resembling tumor angiogenesis. Microarray and qPCR analysis of RNA from cells in matrigel plugs led to the identification of a set of genes that are differentially expressed in Pparb+/+ and Pparb−/− mice (Supplementary Table S1; Figure 8A; Supplementary Figure S5). In view of the hyperplastic phenotype seen in Pparb−/−, mice we were particularly interested in genes with a direct function in cell cycle regulation. The only gene fitting this criterion was Cdkn1c gene coding for the CDK inhibitor p57KIP2 (Lee et al, 1995). We therefore focused our further investigations on this gene and performed additional experiments to unequivocally confirm Cdkn1c as a PPARβ target gene. This was achieved by different strategies: (i) the Cre-mediated disruption of the Pparb gene in cultured fibroblasts resulted in the expected reduction of Cdkn1c expression (Figure 8B), (ii) the restoration of PPARβ expression in Pparb−/− fibroblasts led to a clear reactivation of Cdkn1c expression (Figure 8C), (iii) the treatment of primary ECs with the synthetic PPARβ agonist GW501516 rapidly induced the Cdkn1c gene (Figure 8D), and (iv) in silico analysis of the Cdkn1c upstream sequence revealed two potential PPREs, and consistent with this finding, we observed a clear induction of the Cdkn1c promoter by PPARβ/RxRα and GW501516 in transient transfection experiments (Supplementary Figure S6). The two latter observations (iii and iv) are characteristic of a direct PPAR target gene. A detailed analysis of the precise mechanisms underlying this regulation will be the subject of future studies.
Inhibition of cell proliferation by PPARβ
The inhibitory effect of PPARβ on stroma cell proliferation could be recapitulated in a cell culture model. Infection of fibroblasts isolated from Pparb−/− mice with a PPARβ expressing retrovirus resulted in a dose-dependent inhibition of cell proliferation and, upon continued passaging, in a selection against the PPARβ re-expressing cells. Two independent lines of evidence indicate that Cdkn1c is a PPARβ target gene that plays a pivotal role in the PPARβ-mediated attenuation of cell proliferation. First, there is good correlation between the re-expression of PPARβ, induction of Cdkn1c and the extent of growth inhibition (Figure 9A and B). Second, the selection against PPARβ expressing cells could be greatly diminished by an siRNA-mediated knockdown of Cdkn1c expression (Figure 9C). These results are consistent with the idea that the hyperproliferation of tumor ECs and matrigel-invading cells in Pparb−/− mice, results at least in part from a decrease in Cdkn1c expression. Consistent with this model, mice with a targeted disruption of the Cdkn1c gene have been reported to suffer from hyperplasia and an impairment of terminal differentiation in different tissues (Zhang et al, 1997).
Other potential PPARβ target genes
For two other genes downregulated in matrigel-invading cells from Pparb−/− mice, that is, Cd36 and Thbs2 (Supplementary Figure S5), an inhibitory role in angiogenesis has been established in previous studies (Lee et al, 1995; Armstrong and Bornstein, 2003). Thrombospondins attenuate EC proliferation and migration in vitro and inhibit angiogenesis in vivo, which is strictly dependent on their interaction with the CD36 receptor. CD36 has previously been shown to be regulated by different PPAR subtypes in a variety of cell types (Tontonoz et al, 1998; Westergaard et al, 2001; Sato et al, 2002; Liu et al, 2004), consistent with the present observations. In Pparb−/− cells, both ligand (Thbs2) and receptor (Cd36) genes are downregulated, suggesting that a signaling loop with an essential function in modulating angiogenesis might be impaired in these cells. CD36 and thrombospondin would have a similar effect on EC proliferation as p57KIP2, suggesting that these molecules may act in concert. We have also identified a number of other genes with potential functions in growth control and differentiation that show a decreased expression in matrigel-invading cells from Pparb−/− mice (see highlighted entries in Supplementary Table S1; Figure 8). Interestingly, further backcrossing of the Pparb−/− strain to C57BL/6N mice results in a lower incidence of tumor resistance (our unpublished observation), suggesting that strain-specific modifier loci also influence the observed phenotype. At present, it is therefore not possible to distinguish which of these genes play a role in the context of PPARβ-dependent vascularization, but it is very likely that multiple target genes are involved.
Conclusions
The angiogenic response to growth factors during the final stages of tumor angiogenesis is characterized by an inhibition of EC proliferation and the acquisition of a fully differentiated phenotype (Carmeliet, 2000). Our findings are consistent with a model where PPARβ is required at this stage of tumor angiogenesis, where it functions to attenuate EC proliferation as a prerequisite for microvessel maturation/differentiation. Thus, the loss of PPARβ does not interfere with angiogenesis per se, but rather results in the deregulation of angiogenesis, leading to a hyperplastic phenotype and the formation of non-functional microvessels. It is likely that the reduced PPARβ-dependent expression of Cdkn1c is at least in part responsible for the phenotype seen in Pparb−/− mice, as suggested by its role in the PPARβ-mediated inhibition of cultured cells. Thus, Cdkn1c has the potential to impinge on tumor growth in different ways. When expressed in the tumor cells proper, Cdkn1c inhibits tumorigenesis by a direct inhibitory effect of tumor cell proliferation (Kuang et al, 2007), while its expression in tumor EC cells is required for blood vessel formation and thus tumor growth.
A similar phenotype of enhanced, but non-productive angiogenesis has very recently been described in mice lacking the Notch ligand Delta-Like 4 (Dll4), or mice systemically treated with a Dll4-neutralizing antibody (Noguera-Troise et al, 2006; Ridgway et al, 2006). The lack of functional Dll4 rendered angiogenic ECs hyperproliferative and markedly increased tumor vascularity, but caused defective microvessel differentiation and blocked syngeneic tumor growth. Even though the histological evidence (hyperplasia and immature microvessels lacking a lumen) and the functional consequences on tumor growth are strikingly similar to our observations with Pparb−/− mice, there are clear differences and probably no functional links. Most importantly, Dll4 is essential for embryonic vascular development and arteriogenesis (Krebs et al, 2004), whereas PPARb is not required for physiological angiogenesis. Furthermore, we were unable to detect any differences in the expression of Dll4 or other key component of Notch signaling between Pparb+/+ and Pparb−/− cells from matrigel plugs (data not shown). This suggests that multiple and presumably independent mechanism are required to prevent the deregulation of tumor EC proliferation and the occurrence of non-productive angiogenesis. It is possible that due to the highly pathological tumor micro-environment, tumor-specific regulatory mechanisms have to be operational to prevent an excessive angiogenic response of the tumor stroma. Our results suggest that Pparβ is such a regulator. Our findings that PPARb is the predominantly expressed Ppar subtype in angiogenic matrigel plugs and human tumor ECs, and is inducible by angiogenic growth factors in vitro, supports this hypothesis.
Previous studies addressing the role of PPARβ in tumorigenesis have yielded partly conflicting results (Park et al, 2001; Barak et al, 2002; Gupta et al, 2004; Harman et al, 2004; Reed et al, 2004; Marin et al, 2006), leaving it unclear whether PPARβ has tumor promoting or suppressing properties. Our findings possibly help to shed light on this issue. PPARβ may have different functions in tumor stroma and in certain tumor cells with opposing effects on tumor growth. Clearly, a detailed understanding of these complexities will be a prerequisite for the development of PPARβ-directed drugs and their clinical application.
Materials and methods
Cell culture
Lewis lung carcinoma (LLC1) and B16F1 melanoma were obtained from the ATCC and cultured in DMEM plus 10% fetal bovine serum. Aortic ECs were isolated as described (Chen et al, 2004). HuVECs were established and cultured as described (Graulich et al, 1999). Cell lines obtained from Pparb+/+, Pparb−/− and Flox-Pparb (PPARδck) mice are described in Supplementary data. Retroviral infections, siRNA transfections and luciferase assays are described in Supplementary data.
Mouse strains
Pparb−/− and Pparb+/+ mice have previously been described (Peters et al, 2000). All experiments were performed with mice backcrossed with the C57BL/6N strain. PPARδck mice (Barak et al, 2002) harboring a floxed Pparb exon 4 were kindly provided by R Evans (The Salk Institute, La Jolla, CA).
Matrigel plug assay
Matrigel plugs (Ley et al, 2004) were established using the BD Matrigel Matrix (Becton Dickinson), as described by the manufacturer. In brief, 500 μl of liquefied matrigel containing 100 nM PGE2 and 0.6 μg/ml FGF-2 were injected subcutaneously and plugs were removed 3 days later for analysis. For retroviral ‘rescue' experiments, 105 stably transduced fibroblasts (see below) were harvested during the exponential growth phase and included in the matrigel.
MRI
Dynamic gadolinium Gd-DTPA enhanced imaging (Choyke et al, 2003; Kiessling et al, 2003) was carried out with a clinical 1.5 T whole-body MRI-System (Siemens Sonata, Erlangen, Germany) and a dedicated custom-made small animal coil. Mice were anesthetized, injected i.v. with 0.5 mmol/kg of Gd-DTPA, and imaging was started immediately thereafter. We performed 510 measurements per session during a total period of 9 min.
Immunohistology
Paraffin-embedded sections were stained as described in Supplementary data. The following antibodies were used: α-SMA (peroxidase-conjugated, Sigma, Munich, Germany), FLAG tag (Becton Dickinson, Heidelberg, Germany), PCNA (polyclonal FL-261, Santa Cruz Biotechnology, Santa Cruz, California, USA) and AQP-1 (kind gift from Dr S Nielsen, Aarhus, Denmark) (Gresz et al, 2001). Signals were visualized by biotinylated secondary antibodies and either avidin-conjugated peroxidase with diaminobenzidine as the substrate, or avidin-conjugated alkaline phosphatase with Vector® Red (Vector Lab, California, USA). Double immunofluorescence was performed using an FITC-labeled α-SMA antibody and the polyclonal rabbit anti-AQP-1 antibody with a Cy5-labeled secondary antibody.
Microarrays
Microarrays were generated using a GMS 417 arrayer (MWG Biotech, Ebersberg, Germany). The chips contained 22 500 clones from the mouse sequence-verified NIA 15k cDNA library plus the NIA 7.4k cDNA clone set (http://lgsun.grc.nia.nih.gov/cDNA/cDNA.html). Analyses were performed with amplified RNA (Supplementary data). Each experiment was performed as a sandwich hybridization using two arrays, and two independent experiments were performed for each data point. Spot intensities were analyzed from scanned images using Scan Array Express™ (Perkin Elmer, Rodgau, Germany). Data from all four hybridization were averaged before further analysis. All procedures were performed according to the protocols described at http://www.imt.uni-marburg.de/microarray/download.html.
Supplementary Material
Supplementary Figures
Supplementary Tables
Supplementary Methods
Acknowledgments
We thank Dr R Evans (Salk Institute, La Jolla, CA) for PPARδck mice, Dr T Blankenstein (MDC Berlin, Germany) for the retroviral Cre vector, Dr S Nielsen (Aarhus, Denmark) for providing the polyclonal AQP-1 antibody. We are grateful to Birgit Samans, Dr M Krause and Professor M Eilers for help with microarray analyses, to Lena Holembowski for Cdkn1c promoter experiments, and to Bernhard Wilke, Julia Dick, Margitta Alt, Christine Rösser and Renate Baumann for excellent technical assistance. This work was supported by grants from the Deutsche Forschungsgemeinschaft (SFB-TR17/A3), the Deutsche Krebshilfe, the Wilhelm-Sander-Stiftung and the National Cancer Institute (CA89607, CA97999, CA124533).
References
- Armstrong LC, Bornstein P (2003) Thrombospondins 1 and 2 function as inhibitors of angiogenesis. Matrix Biol 22: 63–71 [DOI] [PubMed] [Google Scholar]
- Barak Y, Liao D, He W, Ong ES, Nelson MC, Olefsky JM, Boland R, Evans RM (2002) Effects of peroxisome proliferator-activated receptor delta on placentation, adiposity, and colorectal cancer. Proc Natl Acad Sci USA 99: 303–308 [DOI] [PMC free article] [PubMed] [Google Scholar]
- Barish GD, Narkar VA, Evans RM (2006) PPAR delta: a dagger in the heart of the metabolic syndrome. J Clin Invest 116: 590–597 [DOI] [PMC free article] [PubMed] [Google Scholar]
- Bissell MJ, Radisky D (2001) Putting tumours in context. Nat Rev Cancer 1: 46–54 [DOI] [PMC free article] [PubMed] [Google Scholar]
- Burdick AD, Bility MT, Girroir EE, Billin AN, Willson TM, Gonzalez FJ, Peters JM (2007) Ligand activation of peroxisome proliferator-activated receptor-beta/delta(PPARbeta/delta) inhibits cell growth of human N/TERT-1 keratinocytes. Cell Signal 19: 1163–1171 [DOI] [PMC free article] [PubMed] [Google Scholar]
- Burdick AD, Kim DJ, Peraza MA, Gonzalez FJ, Peters JM (2006) The role of peroxisome proliferator-activated receptor-beta/delta in epithelial cell growth and differentiation. Cell Signal 18: 9–20 [DOI] [PubMed] [Google Scholar]
- Carmeliet P (2000) Mechanisms of angiogenesis and arteriogenesis. Nat Med 6: 389–395 [DOI] [PubMed] [Google Scholar]
- Chen S, Sega M, Agarwal A (2004) ‘Lumen digestion' technique for isolation of aortic endothelial cells from heme oxygenase-1 knockout mice. Biotechniques 37: 84–89 [DOI] [PubMed] [Google Scholar]
- Choyke PL, Dwyer AJ, Knopp MV (2003) Functional tumor imaging with dynamic contrast-enhanced magnetic resonance imaging. J Magn Reson Imaging 17: 509–520 [DOI] [PubMed] [Google Scholar]
- Desvergne B, Michalik L, Wahli W (2006) Transcriptional regulation of metabolism. Physiol Rev 86: 465–514 [DOI] [PubMed] [Google Scholar]
- Feige JN, Gelman L, Michalik L, Desvergne B, Wahli W (2006) From molecular action to physiological outputs: peroxisome proliferator-activated receptors are nuclear receptors at the crossroads of key cellular functions. Prog Lipid Res 45: 120–159 [DOI] [PubMed] [Google Scholar]
- Folkman J (2002) Role of angiogenesis in tumor growth and metastasis. Semin Oncol 29: 15–18 [DOI] [PubMed] [Google Scholar]
- Forman BM, Chen J, Evans RM (1997) Hypolipidemic drugs, polyunsaturated fatty acids, and eicosanoids are ligands for peroxisome proliferator-activated receptors alpha and delta. Proc Natl Acad Sci USA 94: 4312–4317 [DOI] [PMC free article] [PubMed] [Google Scholar]
- Graulich W, Nettelbeck DM, Fischer D, Kissel T, Muller R (1999) Cell type specificity of the human endoglin promoter. Gene 227: 55–62 [DOI] [PubMed] [Google Scholar]
- Gresz V, Kwon TH, Hurley PT, Varga G, Zelles T, Nielsen S, Case RM, Steward MC (2001) Identification and localization of aquaporin water channels in human salivary glands. Am J Physiol Gastrointest Liver Physiol 281: G247–G254 [DOI] [PubMed] [Google Scholar]
- Gupta RA, Wang D, Katkuri S, Wang H, Dey SK, DuBois RN (2004) Activation of nuclear hormone receptor peroxisome proliferator-activated receptor-delta accelerates intestinal adenoma growth. Nat Med 10: 245–247 [DOI] [PubMed] [Google Scholar]
- Harman FS, Nicol CJ, Marin HE, Ward JM, Gonzalez FJ, Peters JM (2004) Peroxisome proliferator-activated receptor-delta attenuates colon carcinogenesis. Nat Med 10: 481–483 [DOI] [PubMed] [Google Scholar]
- Kawamoto A, Tkebuchava T, Yamaguchi J, Nishimura H, Yoon YS, Milliken C, Uchida S, Masuo O, Iwaguro H, Ma H, Hanley A, Silver M, Kearney M, Losordo DW, Isner JM, Asahara T (2003) Intramyocardial transplantation of autologous endothelial progenitor cells for therapeutic neovascularization of myocardial ischemia. Circulation 107: 461–468 [DOI] [PubMed] [Google Scholar]
- Kiessling F, Krix M, Heilmann M, Vosseler S, Lichy M, Fink C, Farhan N, Kleinschmidt K, Schad L, Fusenig NE, Delorme S (2003) Comparing dynamic parameters of tumor vascularization in nude mice revealed by magnetic resonance imaging and contrast-enhanced intermittent power Doppler sonography. Invest Radiol 38: 516–524 [DOI] [PubMed] [Google Scholar]
- Kim DJ, Bility MT, Billin AN, Willson TM, Gonzalez FJ, Peters JM (2006) PPARbeta/delta selectively induces differentiation and inhibits cell proliferation. Cell Death Differ 13: 53–60 [DOI] [PubMed] [Google Scholar]
- Kim DJ, Murray IA, Burns AM, Gonzalez FJ, Perdew GH, Peters JM (2005) Peroxisome proliferator-activated receptor-beta/delta inhibits epidermal cell proliferation by downregulation of kinase activity. J Biol Chem 280: 9519–9527 [DOI] [PubMed] [Google Scholar]
- Kitz Kramer D, Al-Khalili L, Guigas B, Leng Y, Garcia-Roves PM, Krook A (2007) Role of AMP kinase and PPARdelta in the regulation of lipid and glucose metabolism in human skeletal muscle. J Biol Chem 280: 19313–19320 [DOI] [PubMed] [Google Scholar]
- Krebs LT, Shutter JR, Tanigaki K, Honjo T, Stark KL, Gridley T (2004) Haploinsufficient lethality and formation of arteriovenous malformations in Notch pathway mutants. Genes Dev 18: 2469–2473 [DOI] [PMC free article] [PubMed] [Google Scholar]
- Kuang SQ, Ling X, Sanchez-Gonzalez B, Yang H, Andreeff M, Garcia-Manero G (2007) Differential tumor suppressor properties and transforming growth factor-beta responsiveness of p57KIP2 in leukemia cells with aberrant p57KIP2 promoter DNA methylation. Oncogene 26: 1439–1448 [DOI] [PubMed] [Google Scholar]
- Lee CH, Chawla A, Urbiztondo N, Liao D, Boisvert WA, Evans RM, Curtiss LK (2003) Transcriptional repression of atherogenic inflammation: modulation by PPARdelta. Science 302: 453–457 [DOI] [PubMed] [Google Scholar]
- Lee MH, Reynisdottir I, Massague J (1995) Cloning of p57KIP2, a cyclin-dependent kinase inhibitor with unique domain structure and tissue distribution. Genes Dev 9: 639–649 [DOI] [PubMed] [Google Scholar]
- Ley CD, Olsen MW, Lund EL, Kristjansen PE (2004) Angiogenic synergy of bFGF and VEGF is antagonized by Angiopoietin-2 in a modified in vivo Matrigel assay. Microvasc Res 68: 161–168 [DOI] [PubMed] [Google Scholar]
- Li LP, Schlag PM, Blankenstein T (1997) Transient expression of SV 40 large T antigen by Cre/LoxP-mediated site-specific deletion in primary human tumor cells. Hum Gene Ther 8: 1695–1700 [DOI] [PubMed] [Google Scholar]
- Liu Y, Zhu Y, Rannou F, Lee TS, Formentin K, Zeng L, Yuan X, Wang N, Chien S, Forman BM, Shyy JY (2004) Laminar flow activates peroxisome proliferator-activated receptor-gamma in vascular endothelial cells. Circulation 110: 1128–1133 [DOI] [PubMed] [Google Scholar]
- Marin HE, Peraza MA, Billin AN, Willson TM, Ward JM, Kennett MJ, Gonzalez FJ, Peters JM (2006) Ligand activation of peroxisome proliferator-activated receptor beta inhibits colon carcinogenesis. Cancer Res 66: 4394–4401 [DOI] [PubMed] [Google Scholar]
- Michalik L, Desvergne B, Tan NS, Basu-Modak S, Escher P, Rieusset J, Peters JM, Kaya G, Gonzalez FJ, Zakany J, Metzger D, Chambon P, Duboule D, Wahli W (2001) Impaired skin wound healing in peroxisome proliferator-activated receptor (PPAR)alpha and PPARbeta mutant mice. J Cell Biol 154: 799–814 [DOI] [PMC free article] [PubMed] [Google Scholar]
- Nadra K, Anghel SI, Joye E, Tan NS, Basu-Modak S, Trono D, Wahli W, Desvergne B (2006) Differentiation of trophoblast giant cells and their metabolic functions are dependent on peroxisome proliferator-activated receptor beta/delta. Mol Cell Biol 26: 3266–3281 [DOI] [PMC free article] [PubMed] [Google Scholar]
- Noguera-Troise I, Daly C, Papadopoulos NJ, Coetzee S, Boland P, Gale NW, Lin HC, Yancopoulos GD, Thurston G (2006) Blockade of Dll4 inhibits tumour growth by promoting non-productive angiogenesis. Nature 444: 1032–1037 [DOI] [PubMed] [Google Scholar]
- Park BH, Vogelstein B, Kinzler KW (2001) Genetic disruption of PPARdelta decreases the tumorigenicity of human colon cancer cells. Proc Natl Acad Sci USA 98: 2598–2603 [DOI] [PMC free article] [PubMed] [Google Scholar]
- Peraza MA, Burdick AD, Marin HE, Gonzalez FJ, Peters JM (2006) The toxicology of ligands for peroxisome proliferator-activated receptors (PPAR). Toxicol Sci 90: 269–295 [DOI] [PubMed] [Google Scholar]
- Peters JM, Lee SS, Li W, Ward JM, Gavrilova O, Everett C, Reitman ML, Hudson LD, Gonzalez FJ (2000) Growth, adipose, brain, and skin alterations resulting from targeted disruption of the mouse peroxisome proliferator-activated receptor beta(delta). Mol Cell Biol 20: 5119–5128 [DOI] [PMC free article] [PubMed] [Google Scholar]
- Reed KR, Sansom OJ, Hayes AJ, Gescher AJ, Winton DJ, Peters JM, Clarke AR (2004) PPARdelta status and Apc-mediated tumourigenesis in the mouse intestine. Oncogene 23: 8992–8996 [DOI] [PubMed] [Google Scholar]
- Ridgway J, Zhang G, Wu Y, Stawicki S, Liang WC, Chanthery Y, Kowalski J, Watts RJ, Callahan C, Kasman I, Singh M, Chien M, Tan C, Hongo JA, de Sauvage F, Plowman G, Yan M (2006) Inhibition of Dll4 signalling inhibits tumour growth by deregulating angiogenesis. Nature 444: 1083–1087 [DOI] [PubMed] [Google Scholar]
- Saadoun S, Papadopoulos MC, Hara-Chikuma M, Verkman AS (2005) Impairment of angiogenesis and cell migration by targeted aquaporin-1 gene disruption. Nature 434: 786–792 [DOI] [PubMed] [Google Scholar]
- Samuelsson MK, Pazirandeh A, Davani B, Okret S (1999) p57Kip2, a glucocorticoid-induced inhibitor of cell cycle progression in HeLa cells. Mol Endocrinol 13: 1811–1822 [DOI] [PubMed] [Google Scholar]
- Sato O, Kuriki C, Fukui Y, Motojima K (2002) Dual promoter structure of mouse and human fatty acid translocase/CD36 genes and unique transcriptional activation by peroxisome proliferator-activated receptor alpha and gamma ligands. J Biol Chem 277: 15703–15711 [DOI] [PubMed] [Google Scholar]
- Schmuth M, Haqq CM, Cairns WJ, Holder JC, Dorsam S, Chang S, Lau P, Fowler AJ, Chuang G, Moser AH, Brown BE, Mao-Qiang M, Uchida Y, Schoonjans K, Auwerx J, Chambon P, Willson TM, Elias PM, Feingold KR (2004) Peroxisome proliferator-activated receptor (PPAR)-beta/delta stimulates differentiation and lipid accumulation in keratinocytes. J Invest Dermatol 122: 971–983 [DOI] [PubMed] [Google Scholar]
- Tan NS, Michalik L, Noy N, Yasmin R, Pacot C, Heim M, Fluhmann B, Desvergne B, Wahli W (2001) Critical roles of PPAR beta/delta in keratinocyte response to inflammation. Genes Dev 15: 3263–3277 [DOI] [PMC free article] [PubMed] [Google Scholar]
- Tontonoz P, Nagy L, Alvarez JG, Thomazy VA, Evans RM (1998) PPARgamma promotes monocyte/macrophage differentiation and uptake of oxidized LDL. Cell 93: 241–252 [DOI] [PubMed] [Google Scholar]
- Varnat F, Heggeler BB, Grisel P, Boucard N, Corthesy-Theulaz I, Wahli W, Desvergne B (2006) PPARbeta/delta regulates paneth cell differentiation via controlling the hedgehog signaling pathway. Gastroenterology 131: 538–553 [DOI] [PubMed] [Google Scholar]
- Westergaard M, Henningsen J, Svendsen ML, Johansen C, Jensen UB, Schroder HD, Kratchmarova I, Berge RK, Iversen L, Bolund L, Kragballe K, Kristiansen K (2001) Modulation of keratinocyte gene expression and differentiation by PPAR-selective ligands and tetradecylthioacetic acid. J Invest Dermatol 116: 702–712 [DOI] [PubMed] [Google Scholar]
- Zhang P, Liegeois NJ, Wong C, Finegold M, Hou H, Thompson JC, Silverman A, Harper JW, DePinho RA, Elledge SJ (1997) Altered cell differentiation and proliferation in mice lacking p57KIP2 indicates a role in Beckwith–Wiedemann syndrome. Nature 387: 151–158 [DOI] [PubMed] [Google Scholar]
Associated Data
This section collects any data citations, data availability statements, or supplementary materials included in this article.
Supplementary Materials
Supplementary Figures
Supplementary Tables
Supplementary Methods


