Abstract
The influence of heat adaptation (growth at 42 and 45°C) on changes in membrane lipid composition and verotoxin concentration of Escherichia coli O157:H7 (ATCC 43895), an rpoS mutant of ATCC 43895 (FRIK 816-3), a verotoxin mutant E. coli O157:H7 (B6-914), and nonpathogenic E. coli (ATCC 25922) was investigated. D values (57°C) of heat-adapted cells were up to 3.9 min longer than those of control cells for all four strains. Heat adaptation increased the amounts of palmitic acid (16:0) and cis-vaccenic acid (18:1ω7c) in membrane lipids of ATCC 43895 and the rpoS mutant, whereas there was a reduction and no change in the amount of cis-vaccenic acid in nonpathogenic and verotoxin mutant E. coli, respectively. The ratio of palmitic to cis-vaccenic acids decreased in ATCC 43895 and in the rpoS mutant, whereas the ratio increased in nonpathogenic E. coli and was not different in the verotoxin mutant with elevated growth temperature. Total verotoxin concentration decreased due to a reduction in intracellular verotoxin amount in heat-adapted ATCC 43895 and rpoS mutant strains. However, extracellular verotoxin concentration increased in heat-adapted cells. The rpoS gene did not influence membrane lipid composition changes although it did affect heat resistance. Results suggest that increased membrane fluidity may have caused increased verotoxin secretion.
Escherichia coli O157:H7 is a gram-negative, facultative anaerobic pathogen that has been associated with the consumption of foods such as undercooked or raw ground beef, raw milk, and unpasteurized fruit juice (6). The bacterium has been considered the main cause of the human diseases hemorrhagic colitis (20), hemolytic-uremic syndrome (6, 9), and thrombotic thrombocytopenic purpura (16).
Many environmental factors such as temperature, pH, moisture content, antimicrobial agents, and water activity affect the growth of bacteria in nature (8). The food industry has a long history of manipulating these factors to control food-borne pathogens during food processing. Among these factors, temperature control is one of the most effective to reduce or minimize populations of E. coli O157:H7 in foods (24, 25). Unfortunately, temperature abuse can occur during inappropriate cooking, inadequate reheating, and improper holding of foods at food service establishments and in homes. These mishandled foods may contribute to heat-stressed conditions for the pathogens.
Heat stress in E. coli O157:H7 can be classified as heat shock or heat adaptation. Heat shock is a short period of exposure of a cell to temperatures above its normal growth maximum, and the response of the cell is associated with heat shock genes (rpoH). In a similar manner, heat adaptation is a long period of exposure of a cell to a temperature above its optimal range for growth and the response of the cell is associated with the rpoS gene and the alteration of the cell membrane. Like the heat shock gene rpoH, rpoS encodes σS, the alternative sigma factor, which has been recognized as a key factor in producing greater resistance of stationary phase cells. This alternative sigma factor controls the expression of a specific subset of around 40 genes per operon involved in producing the changes associated with the onset of stationary phase (4, 12).
The alteration of membrane lipid composition plays an important role in bacterial response to heat stress, the so-called “homeoviscous adaptation” (1, 23). These changes are associated with the maintenance of an adequate liquid-crystalline balance, which contributes to an ideal physical state of the membrane (24). At higher growth temperatures, the mechanism of regulation theoretically occurs via the incorporation of proportionally more saturated fatty acids such as palmitic acid into membrane lipids due to their higher melting points (3, 22). By such means, bacteria can regulate the activity of vital membrane-bound enzymes and transport systems. Low-temperature bacterial growth decreases heat resistance of cells due to increases in membrane unsaturated fatty acids, which increases membrane fluidity and thus interrupts the selective permeability function of the membrane (5, 19). Conversely, high-growth-temperature adaptation increases heat resistance of cells, presumably due to decreases in membrane fluidity. To our knowledge, there are no reports on the effect of high growth temperatures on membrane lipid changes in E. coli O157:H7.
Temperature induced changes in membrane lipid composition probably affects protein secretion because proteins synthesized in the cytoplasm must cross the inner and outer membranes to reach the culture medium (13, 26). E. coli O157:H7 verotoxin is secreted via vesicles, which are spherical fragments of the bacterial membrane (11). Verotoxin in the vesicles could act both as a toxin and as an adhesin in vivo (11).
To help understand the response of E. coli O157:H7 in response to heat stress, the relationships between heat resistance and membrane lipid composition, membrane lipid composition and verotoxin secretion, or temperature and verotoxin secretion should be elucidated. Although there are reports on E. coli O157:H7 heat resistance, membranes, and verotoxin, to our knowledge nothing has been reported regarding these combined topics. Therefore, the objective of this study was to measure changes in heat resistance, membrane lipid composition, and verotoxin concentration in heat-shocked and heat-adapted E. coli O157:H7.
MATERIALS AND METHODS
Bacterial strains and culture conditions.
Enterohemorrhagic E. coli O157:H7 ATCC 43895 (HEC) and nonpathogenic E. coli ATCC 25922 (NPEC) were purchased from American Type Culture Collection (Manassas, Va.). E. coli O157:H7 (ATCC 43895) FRIK 816-3, an rpoS-deficient mutant (HEC-RM), was obtained from Charles W. Kaspar of the Food Research Institute, University of Wisconsin—Madison (2). E. coli O157:H7 B6-914, a verotoxin negative mutant (HEC-VM), was obtained from the Centers for Disease Control and Prevention (Atlanta, Ga.). Stock cultures were stored on Trypticase soy agar (BBL, Cockeysville, Md.) slants at 4°C, with biweekly transfers to retain viability. Prior to use, working cultures of all strains were grown in Trypticase soy broth (TSB) (BBL) at 37°C with two consecutive transfers after 18-h periods for a total of 36 h of incubation.
Cultures were confirmed monthly on Sorbitol-MacConkey Agar (Oxoid, Basingstoke, England) by the absence of sorbitol fermentation for HEC, HEC-RM, and HEC-VM strains and sorbitol positive reaction for NPEC. The presence of the insertional mutation in HEC-RM was confirmed monthly by ability to grow in TSB containing penicillin G (250 μg/ml; Sigma, St. Louis, Mo.) (2, 12). HEC-VM was confirmed bimonthly by absence of toxin detection using the Premier EHEC assay according to manufacturer directions (Meridian Diagnostics, Inc., Cincinnati, Ohio). For this assay, a 50-μl volume of the appropriate cell density (108 CFU/ml) was added to 200 μl of sample diluent provided by the manufacturer in a microtube. Rabbit antibodies specific for verotoxins, goat anti-rabbit antibody conjugated to horseradish peroxidase as enzyme conjugate, and urea peroxide as substrate were used for this assay. Reaction mixture aliquots were read spectrophotometrically at 450 nm with a microtiter plate spectrophotometer (Spectra Max 250; Molecular Devices Corp., Sunnyvale, Calif.). Samples were considered verotoxin positive when the optical density was ≥0.18.
Preparation of heat-shocked and heat-adapted cells.
Aliquots (100 ml) of working cultures (108CFU/ml) were heat shocked by immersion (3 cm above medium level in bottle) into 42°C (42°C HS) and 45°C (45°C HS) temperature-controlled water baths for 15 min. Heat-adapted cells were prepared by incubating working cultures at 42°C for 18 h (42°C HA) followed by an additional 15 h at 45°C (45°C HA). Cultures grown in TSB for 18 h at 37°C were used as controls.
Determination of heat resistance.
Control cells, heat-shocked cells, and heat-adapted cells were diluted with 0.1% peptone water as needed to obtain 108 CFU/ml and 1 ml of each inoculum was transferred into a closed bottle containing 99 ml of fresh TSB in a circulating water bath prewarmed to 57°C that had water 3 cm above the medium level in the bottle. Heat treatment was carried out for 18 min, with 5 ml of TSB withdrawn at 0, 2, 4, 6, 8, 10, 12, 15, and 18 min and immediately cooled in an ice bath. The population at each time was enumerated by spiral plating (model D; Spiral Biotech, Bethesda, Md.) appropriate dilutions in 0.1% peptone-water on Trypticase soy agar plates that were incubated at 37°C for 24 h prior to automated colony counting.
Membrane lipid composition.
Procedures for gas chromatography of fatty acid methyl esters, as outlined by Sasser in MIDI technical note 101 (MIDI, Inc., Newark, Del.), were followed. All chemicals were high-performance liquid chromatography grade and were from Sigma. For each cell type in TSB, about 40 mg of bacterial pellets were collected by centrifugation at 3,800 × g for 5 min and resuspended by vortexing in 1 ml of saponification solution consisting of 45 g of NaOH, 150 ml of methanol, and 150 ml of deionized distilled water. Suspensions were transferred into test tubes with Teflon-lined caps, which were heated in a boiling water bath for 5 min, at which time the tubes were vigorously vortexed for 5 to 10 s and returned to the water bath for 25 min of additional heating. Tubes were then cooled in cold tap water and uncapped, and 2 ml of methylation solution consisting of 325 ml of 6 N HCl and 275 ml of methanol was added. After recapping, the tubes were heated for 10 min at 80°C and then cooled rapidly. Addition of 1.25 ml of extraction solution consisting of 200 ml of hexane and 200 ml of methyl-tert-butyl ether to the cooled tubes was followed by recapping and gentle tumbling on a clinical rotator for 10 min. The tubes were uncapped and the aqueous (lower) phase was pipetted out and discarded. Three milliliters of alkaline washing solution consisting of 10.8 g of NaOH and 900 ml of deionized distilled water was added to the organic phase remaining in the tubes. The tubes were recapped and tumbled for 5 min. Following uncapping, two-thirds of the organic phase was pipetted into a vial that was capped and ready for analysis. Fatty acid methyl esters were analyzed on a Hewlett-Packard gas chromatograph (model 6890; Wilmington, Del.) equipped with a split-capillary injector and a flame ionization detector. Separations were obtained using a Hewlett-Packard Ultra 2 cross-linked 5% phenylmethyl siloxane column (25 m by 0.2 mm by 0.33 μm [film thickness]). The temperature program was ramped from 170 to 270°C at 5°C per min, hydrogen was used as the carrier gas, and the flow rate was set to 30 ml/min. Sherlock Microbial Identification System (MIDI Inc.) was used for analyzing fatty acid profiles.
Determination of verotoxin concentration.
To observe the influence of heat adaptation on verotoxin production, intracellular and extracellular verotoxin concentrations of control, heat-shocked, and heat-adapted cells were measured. To extract intracellular verotoxin, cells were collected by centrifugation at 3,800 × g for 5 min, with pellets washed 3 times with phosphate-buffered saline (pH 7.3; Sigma). The final washed pellets were resuspended in 1 ml of phosphate-buffered saline, and cell membranes were disrupted using an ultrasonicator (Sonifier S-12; Branson Sonic Power Company, Danbury, Conn.) at 50 W for 1 min. Verotoxin concentration was determined using this disrupted cell mixture. To determine extracellular verotoxin concentration, supernatant from the first centrifugation was analyzed. Verotoxin concentration was determined using the enzyme-linked immunosorbent assay-based Premier EHEC assay described previously. For quantification of verotoxins, standard curve of optical density versus verotoxin I (Sigma) concentration was prepared to determine unknown verotoxin concentrations produced by HEC and HEC-RM.
Statistical analysis.
D values (minutes) were determined by plotting the log10 number of survivors against time for each cell type. The line of best fit for survivor plots was determined by linear regression with Microsoft Excel (Microsoft Corp. Redmond, Wash.) and the negative reciprocal of the slope was used for the D value. A completely randomized experimental design was used with means of D values, membrane lipid composition, and verotoxin concentration obtained from duplicate observations from three replicate experiments. All data were analyzed by analysis of variance and means were separated by least significant difference (P < 0.05) (SAS, Statistical Analysis Software, Version 8.0, SAS Institute, Cary, North Carolina).
RESULTS AND DISCUSSION
Heat resistance.
Regardless of bacterial strain, all heat-shocked cells and heat-adapted cells exhibited higher D values than control cells. Comparisons within strains show that heat-adapted HEC at 42°C had the highest D-value increase, from 5.1 (control) to 9.0 min (Table 1). Heat-shocked HEC-RM at 42°C had a D-value increase from 4.1 to 6.5 min. For NPEC, heat shocking and heat adaptation had a small but significant 1-min increase in D values. Like HEC, heat-adapted HEC-VM at 42°C had the highest D-value increase from 2.6 to 5.8 min. Of most importance, the heat resistance of HEC after heat shocking and heat adaptation was found to be markedly higher than those of the other strains.
TABLE 1.
D values of various E. coli strainsb
| Heat treatment |
D value (min) for straina: |
|||
|---|---|---|---|---|
| HEC | HEC-RM | NPEC | HEC-VM | |
| Control | 5.1 E | 4.1 D | 3.1 C | 2.6 D |
| 42°C HS | 8.3 B | 6.5 A | 4.1 A | 3.9 B |
| 45°C HS | 7.8 C | 5.5 B | 3.9 AB | 3.7 B |
| 42°C HA | 9.0 A | 4.8 C | 4.0 A | 5.8 A |
| 45°C HA | 6.2 D | 4.4 CD | 3.6 C | 3.0 C |
Values in the same column followed by different letters are significantly different (P < 0.05; n = 6).
E. coli 0157:H7 (HEC), E. coli O157:H7 rpoS mutant (HEC-RM), NPEC, and E. coli O157:H7 verotoxin mutant (HEC-VM) heated in tryptic soy broth at 57°C.
Results indicate that heat-adapted HEC and HEC-VM at 42°C were more resistant to heat inactivation than control and heat-shocked cells. In NPEC and HEC-RM, heat-adapted cells possessed similar or lower D values than heat-shocked cells. Others have demonstrated that heat-adapted bacteria exposed to temperatures above their optimum for growth had higher heat resistance than those grown at lower temperatures (17, 18). It is known that stationary phase or starvation induces production of protective proteins that impart resistance to chemical and physical challenges and these proteins are regulated by rpoS in E. coli (2). Indeed, the rpoS mutant, HEC-RM, has lower heat tolerance after acid stress than similarly exposed HEC (2, 29). When comparing heat resistance among HEC, HEC-RM, and NPEC, present results are in agreement with those of Leenanon and Drake (14), who reported that HEC was the most heat resistant of the three strains following acid stress, whereas NPEC was the least heat resistant. Our results indicate that the presence of rpoS increased heat resistance when cells were heat adapted at temperatures above the optimum growth temperature without acid stress, possibly due to protective proteins produced at stationary phase.
Change in membrane lipid composition.
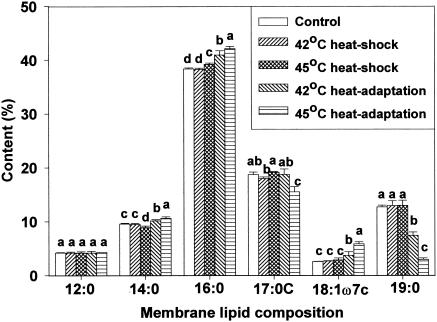
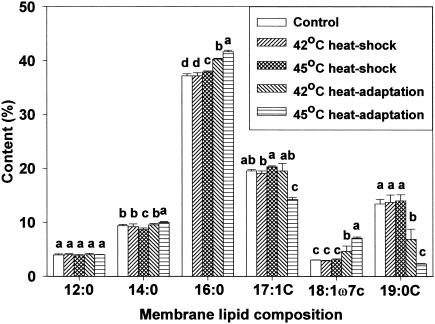
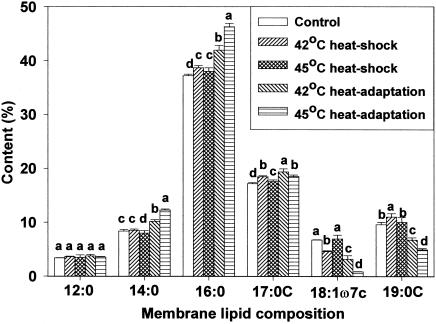
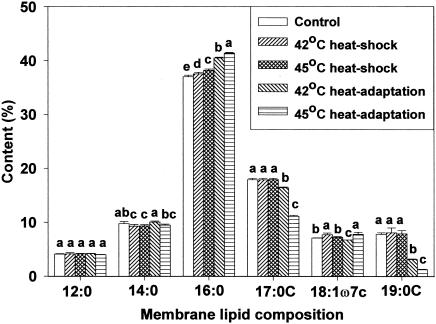
Membrane lipid composition changes after heat shocking and heat adaptation were investigated using gas chromatography. For all cell types, analysis revealed the presence of the same six predominant membrane fatty acids but in different proportions. Major fatty acids identified were n-dodecanoic (lauric, 12:0), n-tetradecanoic (myristic, 14:0), n-hexadecanoic (palmitic, 16:0), cyclo-heptadecanoic (17:0 cyclo), cis-11-octadecenoic (vaccenic, 18:1ω7c), and cyclo-nonadecanoic (19:0 cyclo) acids. Marr and Ingraham (19) found palmitic, hexadecenoic, octadecenoic, and β-hydroxymyristic acids predominant in E. coli ML30. This indicates that fatty acid profiles are strain-specific (24). Of the fatty acids identified in the present study, concentrations of palmitic, cis-vaccenic, and cyclo-nonadecanoic acids were influenced by growth temperature. Due to the short duration of exposure, heat shocking had little influence on membrane lipid composition. However, in heat-adapted HEC, palmitic and cis-vaccenic acid concentrations increased, whereas cyclo-nonadecanoic acid concentration decreased (Fig. 1). The same response was observed for HEC-RM (Fig. 2). Similar fatty acid profiles between HEC and HEC-RM indicates that the presence or absence of the rpoS gene did not affect membrane lipid composition during heat adaptation even though rpoS can cause changes in cellular physiology and morphology. In NPEC, the profile of membrane lipid composition showed an increase in palmitic acid concentration and a decrease in cis-vaccenic and cyclo-nonadecanoic acid concentrations in heat-adapted cells (Fig. 3). In HEC-VM, elevation of growth temperature induced an increase in palmitic acid concentration, a decrease in cyclo-nonadecanoic acid concentration, and little change in cis-vaccenic acid amounts (Fig. 4). Membrane lipid composition in E. coli is mediated by membrane-bound acyl transferases, which use a decreasing proportion of unsaturated acyl CoA species as substrates in the synthesis of membrane phospholipids as temperature is increased (7).
FIG. 1.
Membrane lipid composition of E. coli O157:H7 (HEC) after heat shocking and heat adaptation. Means within each fatty acid accompanied by different letters are significantly different (P < 0.05).
FIG. 2.
Membrane lipid composition of HEC-RM after heat shocking and heat adaptation. Means within each fatty acid accompanied by different letters are significantly different (P < 0.05).
FIG. 3.
Membrane lipid composition of NPEC after heat shocking and heat adaptation. Means within each fatty acid accompanied by different letters are significantly different (P < 0.05).
FIG. 4.
Membrane lipid composition of HEC-VM after heat shocking and heat adaptation. Means within each fatty acid accompanied by different letters are significantly different (P < 0.05).
Membrane fluidity is important for cells because it affects membrane functions such as bicochemical reactions, transport systems, and protein secretion. For the most part, the ratio of saturated to unsaturated fatty acids affects membrane fluidity. For the present study, we used the ratio of palmitic to cis-vaccenic acids (16:0/18:1ω7c) as a proxy for membrane fluidity because there was little change in other membrane fatty acids. Due to melting point differences (generally saturated fatty acids are higher than unsaturated fatty acids), an increase in the ratio represents decreased membrane fluidity, whereas a decrease in the ratio represents increased membrane fluidity. Table 2 shows the change in the 16:0/18:1ω7c ratio of control, heat-shocked, and heat-adapted cells. In HEC and HEC-RM, the ratio decreased as temperature increased, which implies increased membrane fluidity. In contrast, the ratio for NPEC markedly increased for heat-adapted cells, which indicated decreased membrane fluidity. There was little change in the ratio for HEC-VM. It has been shown that E. coli decreased the amount of membrane unsaturated fatty acids (decreased fluidity) to maintain an adequate liquid-crystalline phase with elevated temperatures (10, 19). These observations were consistent with what we found with NPEC. On the other hand, present results with strains HEC, HEC-RM, and HEC-VM showed a simultaneous increase in saturated and unsaturated fatty acid concentrations. In addition, high growth temperature adaptation decreased the ratio of saturated to unsaturated fatty acids in HEC and HEC-RM. Therefore, we question whether the observed increase in membrane fluidity in HEC and HEC-RM due to heat adaptation may have implications on verotoxin secretion and ultimately on virulence.
TABLE 2.
Membrane lipid 16:0/18:1ω7c ratio of various E. coli strainsb
| Heat treatment | Ratio for straina: |
|||
|---|---|---|---|---|
| HEC | HEC-RM | NPEC | HEC-VM | |
| Control | 15.1 A | 12.6 A | 5.5 D | 5.2 B |
| 42°C HS | 14.4 A | 13.0 A | 8.4 C | 4.9 C |
| 45°C HS | 14.7 A | 12.5 A | 5.5 D | 5.3 B |
| 42°C HA | 11.4 B | 9.0 B | 13.7 B | 6.0 A |
| 45°C HA | 7.2 C | 6.0 C | 56.5 A | 5.3 B |
Values in the same column followed by different letters are significantly different (P < 0.05; n = 6).
E. coli O157:H7 (HEC), E. coli O157:H7 rpoS mutant (HEC-RM), NPEC, and E. coli O157:H7 verotoxin mutant (HEC-VM).
Change in verotoxin concentration.
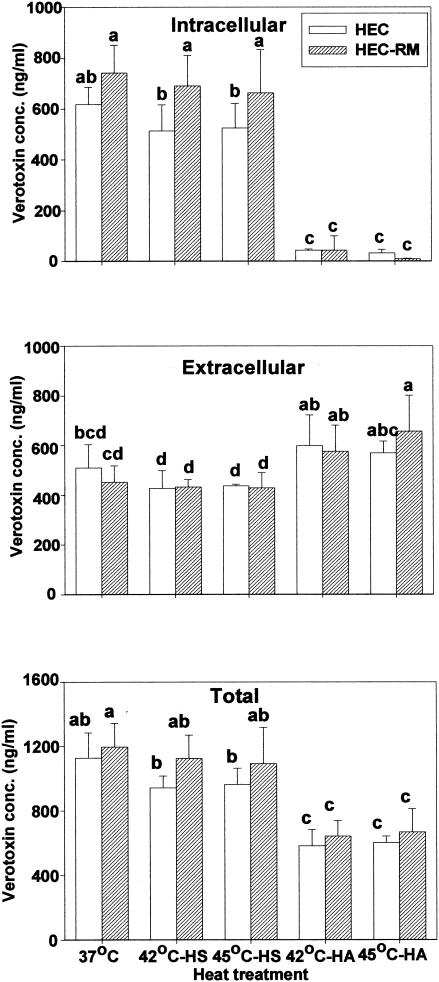
The influence of heat shock or heat adaptation on intracellular and extracellular verotoxin concentration for each E. coli strain was studied using a spectrophotometric enzyme-linked immunosorbent assay method. Figure 5 shows the effect of heat shock and heat adaptation on verotoxin concentration produced by HEC and HEC-RM. NPEC and HEC-VM were not studied due to their inability to produce verotoxin. For HEC control cells and heat-shocked cells, about 45% of total verotoxin was extracellular. Extracellular verotoxin concentration of HEC-RM was less than 40% of total. For heat-adapted HEC and HEC-RM cells, the bulk of verotoxin detected was extracellular. In addition, the amount of extracellular verotoxin for heat-adapted cells was higher than for heat-shocked cells even though total verotoxin levels were less. Furthermore, heat-adapted HEC-RM had significantly higher extracellular verotoxin amounts than its corresponding control. Increased extracellular verotoxin concentration with elevated temperature was presumably due to increased membrane fluidity shown earlier for HEC and HEC-RM strains.
FIG. 5.
Intracellular, extracellular, and total verotoxin concentrations of heat-shocked (HS) and heat adapted (HA) E. coli O157:H7 (HEC) and HEC-RM. Means within each figure accompanied by different letters are significantly different (P < 0.05).
Heat adaptation reduced total verotoxin concentration in both of HEC and HEC-RM cultures due to decreased intracellular verotoxin amounts (Fig. 5). Palumbo et al. (21) demonstrated that the amount of secreted toxin was related to cell density, with the highest cell count giving highest verotoxin titer at 37°C. Similarly, Weeratna and Doyle (27) reported that the greatest production of verotoxin in both milk and ground beef was at optimum growth temperature (37°C) whereas less toxin was produced at 30 or 25°C. In contrast to these findings about the relationship between temperature and verotoxin amount, Weinstein et al. (28) reported that temperature had no significant effect on verotoxin production by an E. coli strain that was rendered toxigenic by lysogenization with toxin-converting phage 933J.
Present results showed slightly lower amounts of verotoxin produced by HEC than by HEC-RM (Fig. 5), indicating a possible effect of rpoS on production of verotoxin. Leenanon (15) also reported that the amount of verotoxin in HEC-RM was higher than the amount of verotoxin in HEC at 37°C after acid adaptation. These observations suggest that rpoS may act as a repressor of toxin expression either directly or indirectly.
It is unclear why intracellular and total verotoxin levels were so low in heat-adapted cells (Fig. 5). Perhaps high temperature represses the expression of the verotoxin gene or energy involved in toxin production is diverted to other metabolic processes necessary for growth and survival. The growth of HEC-VM under heat-adapting conditions supports this assumption, indicating that the absence of toxin had no influence on growth at high temperature.
Conclusion.
Heat-adapted E. coli O157:H7 strains were more heat resistant than control cells, heat-shocked cells, or NPEC. In addition, the presence of rpoS increased the heat resistance of E. coli O157:H7. Novel findings in the present study demonstrated that heat adaptation increased membrane fluidity, which may have increased verotoxin secretion in E. coli O157:H7. Heat adaptation also reduced the total amount of verotoxin produced due to decreased intracellular verotoxin concentration, perhaps by repressed production of the toxin. It is unknown whether heat-adapted cells with more extracellular verotoxin, but with much lower total verotoxin, are more or less virulent than control cells.
Acknowledgments
We thank Charles W. Kaspar of the University of Wisconsin-Madison Food Research Institute for the rpoS mutant. This work was supported in part by a USDA-CSREES special grant (00-34231-9797) and by the Mississippi Agricultural and Forestry Experiment Station under project MIS-081392.
REFERENCES
- 1.Arneborg, N., A. S. Salskov-Iversen, and T. E. Mathiasen. 1993. The effect of growth rate and other growth conditions on the lipid composition of Escherichia coli. Appl. Microbiol. Biotech. 39:353-357. [Google Scholar]
- 2.Cheville, A. M., K. W. Arnold, C. Buchrieser, C.-M. Cheng, and C. W. Kaspar. 1996. rpoS regulation of acid, heat and salt tolerance in Escherichia coli O157:H7. Appl. Environ. Microbiol. 62:1822-1824. [DOI] [PMC free article] [PubMed] [Google Scholar]
- 3.De Mendoza, D., and J. E. Cronan, Jr. 1983. Thermal regulation of membrane lipid fluidity in bacteria. Trends Biochem. Sci. 8:49-52. [Google Scholar]
- 4.Dodd, C. E. R., and T. G. Aldsworth. 2002. The importance of RpoS in the survival of bacteria through food processing. Int. J. Food Microbiol. 74:189-194. [DOI] [PubMed] [Google Scholar]
- 5.Fulco, A. J. 1974. Metabolic alteration in fatty acids. Annu. Rev. Biochem. 43:215-241. [DOI] [PubMed] [Google Scholar]
- 6.Griffin, P. M., and R. V. Tauxe. 1991. The epidemiology of infections caused by Escherichia coli O157:H7, other enterohemorhagic E. coli and the associated hemolytic uremic syndrome. Epidemiol. Rev. 13:60-98. [DOI] [PubMed] [Google Scholar]
- 7.Houslay, M. D., and K. K. Stanley. 1982. Dynamics of biological membranes, p. 138-139. John Wiley & Sons Ltd. New York.
- 8.Jay, J. M. 2000. Modern food microbiology, p. 35-56. Aspen Publishers Inc., Gaithersburg, Md.
- 9.Karmali, M. A., M. Petric, C. Lim, P. C. Fleming, G. S. Arbus, and H. Lior. 1985. The association between idiopathic hemolytic uremic syndrome and infection by verotoxin-producing Escherichia coli. J. Infect. Dis. 151:775-781. [DOI] [PubMed] [Google Scholar]
- 10.Knivett, V. A., and J. Cullen. 1965. Some factors affecting cyclopropane acid formation in Escherichia coli. Biochem. J. 96:771-776. [DOI] [PMC free article] [PubMed] [Google Scholar]
- 11.Kolling, G. L., and K. R. Matthews. 1999. Export of virulence genes and Shiga toxin by membrane vesicles of Escherichia coli O157:H7. Appl. Environ. Microbiol. 65:1843-1848. [DOI] [PMC free article] [PubMed] [Google Scholar]
- 12.Lange, R., and R. Hengge-Aronis. 1991. Identification of a central regulator of stationary phase gene expression in Escherichia coli. Mol. Microbiol. 5:49-59. [DOI] [PubMed] [Google Scholar]
- 13.Lariviere, S., C. L. Gyles, and D. A. Barnum. 1973. Preliminary characterization of the heat-labile enterotoxin of Escherichia coli F11 (P155). J. Infect. Dis. 128:312-320. [DOI] [PubMed] [Google Scholar]
- 14.Leenanon, B., and M. A. Drake. 2001. Acid stress, starvation, and cold stress affect poststress behavior of Escherichia coli O157:H7 and nonpathogenic Escherichia coli. J. Food Prot. 64:970-974. [DOI] [PubMed] [Google Scholar]
- 15.Leenanon, B. 2001. Effect of stress on subsequent post stress behavior of Escherichia coli. Ph.D. dissertation, Mississippi State University, Mississippi State.
- 16.Machin, S. J. 1984. Clinical annotation: thrombotic thrombocytopenic purpura. Br. J. Haematol. 56:191-197. [DOI] [PubMed] [Google Scholar]
- 17.Mackey, B. M., and C. M. Derrick. 1986. Elevation of the heat resistance of Salmonella typhimurium by sublethal heat shock. J. Appl. Bacteriol. 61:389-394. [DOI] [PubMed] [Google Scholar]
- 18.Mackey, B. M., and C. M. Derrick. 1987. Changes in the heat resistance of Salmonella typhimurium during heating at rising temperatures. Lett. Appl. Microbiol. 4:13-16. [Google Scholar]
- 19.Marr, A. G., and J. L. Ingraham. 1962. Effect of temperature on the composition of fatty acids in Escherichia coli. J. Bacteriol. 84:1260-1267. [DOI] [PMC free article] [PubMed] [Google Scholar]
- 20.Padhye, N. V., and M. P. Doyle. 1992. Escherichia coli O157:H7: epidemiology, pathogenesis and methods for detection in food. J. Food Prot. 55:555-565. [DOI] [PubMed] [Google Scholar]
- 21.Palumbo, S. A., J. E. Call, F. J. Schultz, and A. C. Williams. 1995. Minimum and maximum temperatures for growth and verotoxin production by hemorrhagic strains of Escherichia coli. J. Food Prot. 58:352-356. [DOI] [PubMed] [Google Scholar]
- 22.Quinn, P. J. 1981. The fluidity of cell membranes and its regulation. Prog. Biophys. Mol. Biol. 38:1-104. [DOI] [PubMed] [Google Scholar]
- 23.Sinensky, M. 1974. Homeoviscous adaptation: a homeostatic process that regulates the viscosity of membrane lipids in Escherichia coli. Proc. Natl. Acad. Sci. USA 71:522-525. [DOI] [PMC free article] [PubMed] [Google Scholar]
- 24.Suutari, M., and S. Laakso. 1994. Microbial fatty acids and thermal adaptation. Crit. Rev. Microbiol. 20:285-328. [DOI] [PubMed] [Google Scholar]
- 25.United States Department of Agriculture, Food Safety and Inspection Service. 1998. Code of Federal Regulations Title 9, 318.23. Heat-processing procedures, cooking instructions, and cooling, handling, and storage requirements for uncured meat patties. Office of the Federal Register, U. S. Government Printing Office, Washington, D.C.
- 26.Wai, S. N., A. Takade, and K. Amako. 1995. The release of outer membrane vesicles from the strains of enterotoxigenic Escherichia coli. Microbiol. Immunol. 39:451-456. [DOI] [PubMed] [Google Scholar]
- 27.Weeratna, R. D., and M. P. Doyle. 1991. Detection and production of verotoxin 1 of Escherichia coli O157:H7 in food. Appl. Environ. Microbiol. 57:2951-2955. [DOI] [PMC free article] [PubMed] [Google Scholar]
- 28.Weinstein, D. L., R. K. Holmes, and A. D. O'Brien. 1988. Effect of iron and temperature on Shiga-like toxin 1 production by Escherichia coli. Infect. Immun. 56:106-111. [DOI] [PMC free article] [PubMed] [Google Scholar]
- 29.Williams, N. C., and S. C. Ingham. 1998. Thermotolerance of Escherichia coli O157:H7 ATCC 43894, Escherichia coli B, and an rpoS-deficient mutant of Escherichia coli O157:H7 ATCC 43895 following exposure to 1.5% acetic acid. J. Food Prot. 61:1184-1186. [DOI] [PubMed] [Google Scholar]


