Abstract
Wavenumber–absorbance relationships of infrared spectra of DNA analyzed by principal components analysis may be expressed as points in space. Each point represents a highly discriminating measure of DNA structure. Structural modifications of DNA, such as those induced by free radicals, alter vibrational and rotational motion and consequently change the spatial location of the points. Using this technology to analyze breast tumor DNA, we revealed a 94° difference in direction between the progression of normal DNA → primary tumor DNA and the progression of primary tumor DNA → metastatic tumor DNA (P < 0.001). This sharp directional change was accompanied by a substantial increase in the structural diversity of the metastatic tumor DNA (P = 0.003), which, on the basis of the volume of the core cluster of points, could comprise as many as 11 × 109 different phenotypes. This suggests that the heterogeneity and varied physiological properties known to characterize malignant tumor cell populations may at least partially arise from these diverse phenotypes. The evidence suggests that the progression to the metastatic state involves structural modifications in DNA that are markedly different from the modifications associated with the formation of the primary tumor. Overall, the findings of this and earlier studies imply that the observed DNA alterations are a pivotal factor in the etiology of breast cancer and a formidable barrier to overcome in intervention to control the disease. In terms of cancer etiology and prediction, the technology described has potentially wide application to studies in which the structural status of DNA is an important consideration.
Keywords: breast cancer, tumor metastasis, DNA damage, free radicals, Fourier transform-infrared spectroscopy
A significant body of evidence points to the involvement of the hydroxyl radical (·OH) in introducing mutagenic structures into DNA of the normal female breast, thus statistically increasing the probability of breast cancer (1, 2, 3, 4, 5). In a recent study (5), the transformation of primary breast tumors to the metastatic state was shown to involve a >2-fold increase in ·OH damage in DNA, as indicated by modified nucleotide base models comprising mutagenic 8-hydroxyadenine (6) and the putatively nonmutagenic ring-opened product 4,6-diamino-5-formamidopyrimidine (fapyadenine; refs. 7, 8, 9, 10, 11). In addition, plots of the modified nucleotide base model log10(fapyadenine/8-hydroxyadenine) versus the size of metastatic and nonmetastatic breast tumors revealed that the metastatic tumor DNA had significantly greater structural diversity than the nonmetastatic tumor DNA (P = 0.01; ref. 5).
Principal components analysis (PCA) of data obtained by Fourier transform-infrared (FT-IR) spectroscopy yielded plots in which individual spectra were represented as points in two- or three-dimensional space. Each point was a highly discriminating representation of an individual DNA structure in that spatially and visually close points had <3% average spectral difference over the range 1750–700 cm−1 (5). The core cluster of metastatic tumor DNA points was substantially larger than the core cluster of nonmetastatic tumor DNA points and significantly more diverse (P = 0.003). A significant portion of the diversity likely was the result of the observed increase in ·OH-induced DNA damage revealed by the modified nucleotide base models (5). The increase in oxidative damage may well be related to the known ability of cancer cells to constitutively generate hydrogen peroxide, the precursor of the ·OH (12). This “second stage” radical attack on the primary tumor DNA would likely result in additional mutagenic damage and genetic instability and further increase the number of DNA phenotypes from which highly malignant metastatic forms could be selected. Ultimately, the selection process may at least partially set the stage for the heterogeneity and diverse physiological properties known to characterize malignant cell populations (5).
Use of the PCA/FT-IR technology led to the concept that DNA can be regarded as being “in motion.” That is, the specific spatial location of points in a two- or three-dimensional plot is altered by changes in the nucleotide base and phosphodiester–deoxyribose structures. The structural modifications cause changes in the height, width, and location of individual absorbance bands representing various functional groups (e.g., NH2, PO2, and CO). These spectral differences provide unique insight into the nature of structural modifications in DNA associated with primary tumor formation and progression to the metastatic state.
MATERIALS AND METHODS
Tissue Acquisition, DNA Isolation, and FT-IR Spectroscopic Analysis.
Tissue acquisition, DNA isolation, and FT-IR spectroscopic analysis were undertaken as described (5). Twenty-one samples of DNA from reduction mammoplasty tissue (RMT) were used as normal controls. Fourteen samples of DNA from invasive ductal carcinoma without evidence of metastasis (IDC) and 25 samples of DNA from invasive ductal carcinoma with evidence of metastasis (IDCm) were used as test samples. Previously acquired FT-IR spectral data for these samples (5) were reanalyzed in the present study using the statistical approaches described below.
Statistical Analysis.
PCA is a statistical procedure applied to a single set of variables with the purpose of revealing a few variables (components) that are independent of each other and that capture most of the information in the original, long list of variables (13). In the present dataset, it was found that five principal components (i.e., five dimensions) were sufficient to describe the 1051 dimensions of the spectra (with the grand mean of all spectra subtracted from each spectrum) and that visual representation in two or three dimensions was adequate.
The entire analysis was carried out with core clusters from each of the three groups (RMT, IDC, and IDCm). Using cluster analysis, those members of a specified group that stood apart from others in the core group were identified. The isolated group members all stood apart from any others in their group at Euclidean distances representing at least a 12% difference in the mean normalized absorbance, a visibly notable difference when spectra were conventionally plotted. The core clusters can be considered to be the more commonly encountered DNA structural phenotypes, whereas the isolated group members represent less frequent phenotypes not present in great enough numbers to study with this sample, yet overly influential in the analysis if included. The core clusters consisted of 18 out of 21 RMT samples, 10 out of 14 IDC samples, and 22 out of 25 IDCm samples.
The hypothesis that DNA structural changes for the progression of RMT → IDC are the same as for the progression of IDC → IDCm was tested on the basis of centroids statistically derived from groups of points. The centroid is the vector of mean absorbances of the 1051 individual wavenumbers from 1750 to 700 cm−1. If the two progressions are similar, then the centroids of the three groups would line up in two- and three-dimensional space.
Formally, the hypothesis that cos(θ) = 1.0 was tested, where θ is the angle between a vector x pointing from the RMT to the IDC centroid and a vector y pointing from the IDC to the IDCm centroid. cos(θ) is defined by cos(θ) = x·y/(|x| · |y|). The vector x is indexed by wavenumbers and, at each wavenumber, contains the difference between the mean normalized absorbance of IDC spectra and the mean normalized absorbance of RMT spectra. The vector y shows the corresponding difference for IDCm minus IDC spectra. An angle θ = 0 [which is equivalent to cos(θ) = 1.0] implies that the IDCm is a “virtual straight ahead” continuation of the RMT → IDC progression, and that the centroids line up, whereas θ ≠ 0 implies that the IDC → IDCm progression involves a different suite of spectral (structural) changes. The hypothesis that cos(θ) = 1.0 was tested using the bootstrap method (14), which involves resampling with replacement from the RMT, IDC, and IDCm core clusters and calculation of cos(θ) for each resampling.
To determine if the populations from which the RMT and IDC core clusters were drawing had distinct centroids (i.e., distinct mean absorbance spectra), a permutation test was carried out on the distance between the RMT and IDC centroids, randomly permuting labels among RMT and IDC samples and recalculating distances between centroids. A similar permutation test was carried out for the distance between the IDC and IDCm centroids. Finally, the sizes of the three core clusters were compared using the Kruskal–Wallis ANOVA and Mann–Whitney (MW) tests on the distance of each spectrum to the centroid of its cluster. (The P values from the Kruskal–Wallis and MW tests were approximate, due to some statistical dependence introduced when sample values are compared with their sample mean.)
RESULTS
The PCA of FT-IR spectra revealed a change in direction of DNA in the course of the progression from the normal state through the primary cancer and metastatic cancer states. The observed cosine and associated angle between the RMT → IDC vector of DNA absorbance changes and IDC → IDCm changes are cos(θ) = −0.08 and θ = 94.4°, virtually a right angle. Alignment of the RMT, IDC, and IDCm centroids implies cos(θ) = 1.0 and θ = 0°. A 95% confidence interval for cos(θ) is from −0.63 to 0.40, with an associated 95% confidence interval for θ from 66° to 129°. Out of 103 resamplings in the bootstrap method, no value of cos(θ) is larger than 0.67 (or smaller than −0.87), implying P < 0.001 to reject the null hypothesis of cos(θ) = 1.0 and θ = 0. Fig. 1 shows the distribution of the angle for the 103 resamplings. The separation of the distribution from 0° is apparent.
Figure 1.
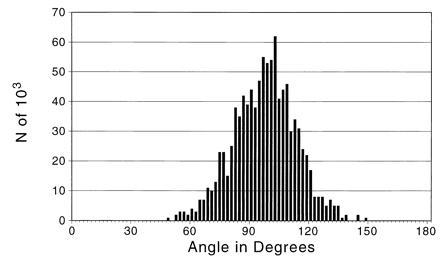
Resampling distribution of the angle between the RMT → IDC progression and the IDC → IDCm progression (n = 103). The cosine and associated angle between the RMT → IDC vector changes and IDC → IDCm vector changes are cos(θ) = −0.08 and θ = 94.4°—virtually a right angle. Note the absence of any values near 0°.
The change in direction is also illustrated in Fig. 2. This representation shows the core clusters in terms of the first two principal components. The nearly right angle turn between the RMT → IDC and IDC → IDCm progression is designated by arrows illustrating the angular changes from centroid to centroid. The centroid of the RMT cluster is distinctly separate from that of the IDC cluster, with a distance of 3.5 normalized absorbance units (or 11% of the mean normalized absorbance) and P < 0.001 to reject zero separation by the permutation test. The separation of the IDC and IDCm centroids is smaller, 2.2 units (7%; P = 0.08), which is suggestively different from a random separation.
Figure 2.
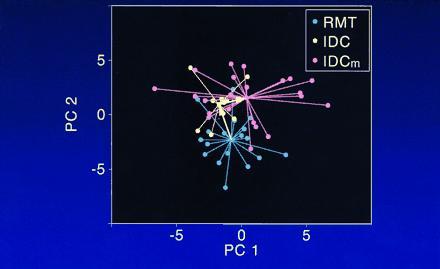
Core clusters of RMT, IDC, and IDCm points represented by two principal components. Alterations in the structure of DNA, resulting from factors in the microenvironment, contribute to the concept of DNA in virtually continual motion in multidimensional PC plots. The virtual right angle in the figure (depicted by arrows) does not appear to be 94°, due to the use of only two dimensions to represent the clusters.
The size of the IDCm cluster is significantly greater than the size of the RMT and IDC clusters. The mean distances ± SD from their respective centroids are 3.0 ± 1.2 normalized absorbance units for the RMT, 2.4 ± 1.1 for the IDC, and 4.0 ± 1.5 for the IDCm. The population mean distances are very unlikely to be equal (P = 0.01, Kruskal–Wallis test), and the IDCm cluster is significantly larger than either the IDC cluster (P = 0.003, MW test) or the RMT cluster (P = 0.04, MW test). While the RMT cluster is somewhat larger than the IDC cluster, the difference is not statistically significant (P = 0.4, MW test). What emerges from these size, location, and angle comparisons is that, over time, there is a distinct movement across spectral space in the RMT → IDC progression, with a small decrease in spectral diversity (i.e., size of cluster), followed by a large increase in spectral diversity in the IDC → IDCm progression and a qualitatively different series of structural changes as reflected in the spectra and captured by the right angle.
A striking feature related to the right angle change is the location of the non-core spectra with respect to the core clusters shown in Fig. 3. All the points, with the exception of one IDC and one IDCm point, are spatially close to the IDC → IDCm progression trend seen in Fig. 2. Moreover, all the points are located on the right side of the plot, the same as indicated by the IDC → IDCm progression. Taking the RMT → IDC vector as a reference direction (the same direction that yielded 94° for the metastatic progression), the outlying points lie at angles of 72–132° in multidimensional space.
Figure 3.
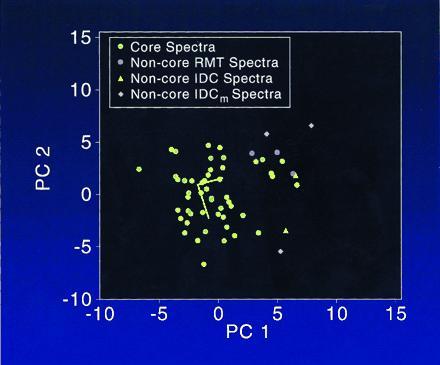
The core cluster of points and “outlier” non-core points of the RMT, IDC, and IDCm groups represented by two principal components. Note that all the non-core points are located on the right side of the plot. Moreover, each non-core point, with the exception of the two points in the lower portion of the plot (location, ≈−5, 5), are spatially close to the IDC → IDCm progression trend. The non-core points may well represent DNAs having a relatively high degree of structural damage.
Considering that even subtle changes in DNA structure likely define new phenotypes, the potential number of phenotypes in each cluster can be estimated. Fitting a three-dimensional ellipsoid to each cluster, using two standard deviations as the semi-axis for each of the three axes of the ellipsoid, the estimated volume for each core cluster is 180 for the RMT, 122 for the IDC, and 385 for the IDCm in cubed, normalized absorbance units. Assuming that a mean difference of 0.01% between two spectra distinguishes phenotypes, the number of phenotypes in the core clusters would be 5.3 × 10⁹ for the RMT, 3.6 × 10⁹ for the IDC, and 11.3 × 10⁹ for the IDCm. If the difference between the spectra of two phenotypes is as large as 0.1%, then the number of phenotypes for each of the core clusters would be smaller than those mentioned above by a factor of 10−3.
Fig. 4, which draws attention to differences in the spectra, shows the mean spectrum of each core cluster minus the grand mean of all spectra (all core groups). By subtracting the grand mean spectrum from each group, similarities between groups have been deemphasized. A comparison across Fig. 4 A–C shows that each group differs uniquely and substantially from the others. The two cancer groups differ from the RMT group notably between ≈1750-1500 cm−1, a region that includes strong C–O stretching and NH2 bending vibrations of the nucleotide bases. The spectra of the two cancer groups and the RMT group also differ between ≈1300-1000 cm−1, a region assigned to medium antisymmetric vibrations of the PO2 group (≈1240 cm−1) and the C–O stretching vibrations of deoxyribose (≈1100 cm−1; refs. 15, 16, 17). The spectral differences between the IDC and the IDCm groups are profound over the entire spectral range. The IDCm spectrum shows a loss of the IDC peak at ≈1680 cm−1, which is likely associated with nucleotide base vibrations. Moreover, the series of bands in the IDC spectrum between ≈1300 and 900 cm−1 have been essentially reduced to one band at ≈1040 cm−1, probably arising from vibrations associated with deoxyribose. Bands in the 1750–1400 cm−1 region are virtually free from interference by the phosphate and sugar groups, whereas the region 1100–900 cm−1 has overlapping bands (16, 17).
Figure 4.
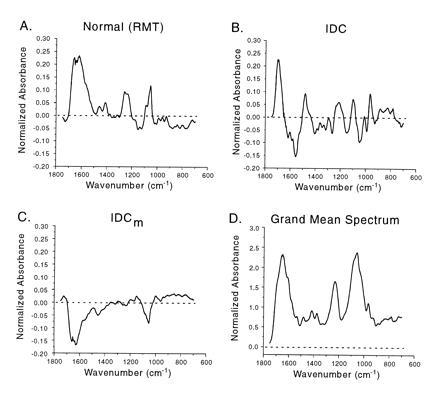
The mean spectrum of each core cluster (A–C) minus the grand mean (D) of all core spectra. Substantial differences in the spectra of the RMT, IDC, and IDCm groups are obvious and particularly notable in the regions assigned to vibrations of the nucleotide bases (≈1750-1400 cm−1), the PO2 structure (e.g., ≈1240 cm−1), and deoxyribose (≈1100-900 cm−1). Dramatic differences in the spectra between the IDC and the IDCm are especially notable (see text for details).
The qualitatively different spectral changes between the two progressions are illustrated in Fig. 5, which displays the differences between the mean spectra of the IDC and RMT groups and the IDCm and IDC groups. The strikingly dissimilar pattern of the two progressions is evident over virtually the entire spectral range, most notably between 1750–1400 cm−1 and 1100–900 cm−1, the areas generally assigned to vibrations of the nucleotide bases and deoxyribose, respectively.
Figure 5.
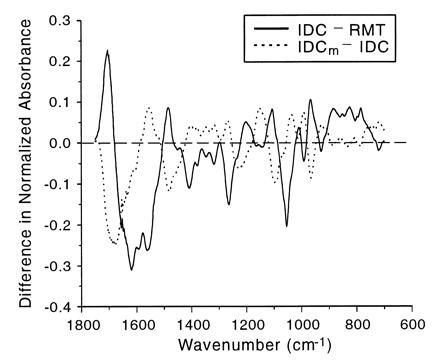
Plot depicting differences in the mean spectra of the IDC and RMT groups versus differences in the mean spectra of the IDC and IDCm groups. The solid line represents the mean IDC spectrum minus the mean RMT spectrum, and the dotted line represents the mean IDCm spectrum minus the mean IDC spectrum. Major absorbance–wavenumber differences are evident over virtually the entire spectral region, demonstrating that the progression from normal tissue to primary tumor tissue involves a markedly different suite of DNA modifications than the progression to the metastatic state.
DISCUSSION
The present work builds on previous studies (5) demonstrating that ·OH-induced modifications of DNA are intimately associated with primary tumor formation and ultimately progression to the metastatic state. The development of technology using PCA of FT-IR data has made it possible to elucidate structural modifications of DNA in a precise and discriminating manner [e.g., spatially and visibly close points in two- and three-dimensional principal component plots had a <3% mean difference over the entire spectral range (5)]. In this regard, the spatial location of a point is a function of time, given that DNA is in a state of flux in response to microenvironmental factors that continually modify its structure. The structural changes may be induced by free radicals, enzyme repair systems (e.g., glycosylases and endonucleases), and other factors. In biological systems, the predominance of damage over repair would potentially create a change in spatial location, as would the predominance of repair over damage.
In the present study, centroids of RMT, IDC, and IDCm groups were studied to determine if the mean spectrum of each group was unique in that it represented distinct structural arrangements. The progression during tumor formation and the progression to the metastatic state were also examined to determine the structural relationship each had to the other. The IDCm centroid lies at virtually a right angle to the RMT → IDC progression (Fig. 1), suggesting that structural alterations of DNA during primary tumor formation are distinctly different from those leading to the metastatic state. The RMT and IDC centroids are spatially distinct (Fig. 2), similarly suggesting that the RMT and IDC groups have markedly different structural features. Further, the majority of non-core points in the plot shown in Fig. 3 are spatially close to the IDC → IDCm progression trend, implying that such points may represent DNA having a relatively high degree of damage with different structural features from those associated with the DNA represented in the core cluster.
Details of absorbance–wavenumber relationships depicting alterations in the functional groups of the nucleotide bases and the phosphodiester–deoxyribose structure (Figs. 4 and 5) further illustrate that the RMT → IDC and IDC → IDCm progressions are different. Major differences can be observed in the actual spectra of the RMT and IDC group centroids with the mean spectrum subtracted (Fig. 4 A and B). The dramatic RMT → IDC decrease in absorbance between ≈1650 and 1500 cm−1, the spectral region assigned to strong C–O stretching and NH2 bending vibrations and weak N–H vibrations and C–H in-plane base deformations, suggests that marked structural changes had taken place in the nucleotide bases. These changes, which are undoubtedly complex, likely result from a variety of intramolecular associations involving functional group coupling (vertical stacking interactions of the base residues), which are known to result in band shifts (16, 17), and a host of base modifications induced by free radicals and other factors (e.g., the methylation of cytosine; ref. 18). The attack of the ·OH, in particular, may well account for somatic alterations reported to occur in cancer-related genes, such as the tumor suppressor gene p53 (19).
Changes in the nucleotide bases are accompanied by similarly dramatic alterations in the deoxyribose structure, as is evident in the spectral region ≈1100-900 cm−1. For the most part, these changes likely reflect ·OH reactions involving the abstraction of hydrogen from one or more of the positions associated with the furanose structure. Such reactions are known to yield a variety of products and ultimately lead to strand breaks and the loss of phosphoric acid (20).
The spectra of the IDC and IDCm group centroids minus the mean showed almost no similarity, except in the region generally assigned to symmetrical stretching vibrations of the PO2 group (≈1050 cm−1; Fig. 4 B and C). The profiles shown in Fig. 5 further illustrate this dissimilarity and reveal that major spectral regions appear to be essentially “out of phase.” This is particularly evident between 1600–1400 cm−1 and 1150–950 cm−1, the areas generally representing vibrations of the nucleotide bases and deoxyribose, respectively. These findings imply that the metastatic transformation is associated with a new suite of structural alterations, possibly triggered by a second attack of the ·OH on the primary tumor DNA, as suggested by the data from the nucleotide base models (5) and the fact that cancer cells are known to generate hydrogen peroxide (12). The changes may include further damage to the nucleotide bases and the phosphodiester–deoxyribose structure at different locations and/or a major restructuring of significant portions of the molecule due to disruptions in the redox balance. Such disruptions would be expected to involve alterations in the vertical transfer of electrons and the horizontal transfer of protons in DNA, processes that may potentially induce structural changes up to at least 100 bp away from the initial reaction site (reviewed in ref. 21).
A potentially important aspect of the progression leading to metastasis is the creation of structural diversity, as suggested previously (5). Accordingly, an attempt was made to estimate the possible number of individual structures (phenotypes) that might be created, based on the volumes of the core clusters. The estimate was at least in the millions, with the highest number being derived from the IDCm group. The creation of structural diversity may be especially important in primary tumor formation and metastasis in that it sets the stage for the selection of malignant DNA phenotypes. It has been estimated that the rate of attack of the ·OH on the nucleotide bases is about five times that for deoxyribose (22). Also, the DNAs from normal (RMT) tissue and metastatic tumor tissue have been shown to have substantial structural diversity (4, 5), at least partly as a result of ·OH-induced modifications in the nucleotide bases and the phosphodiester–deoxyribose structure. Such diverse populations of DNA likely provide a basis for the selection of subgroups of highly malignant phenotypes with modified base structures and virtually no impairment of deoxyribose. Thus, the ability of the ·OH to preferentially modify the base structure, rather than the carbohydrate moiety, may ultimately be a decisive factor in the generation of malignant phenotypes at the cellular level. Importantly, the pronounced diversity of the IDCm phenotypes may account to a considerable measure for the cellular heterogeneity and varied physiological properties known to characterize metastatic cell populations (23, 24).
The PCA of FT-IR spectra have been shown to be highly discriminating in distinguishing subtle changes in DNA structure in relation to cancer and would appear to have application to other diseases in which alterations in the structure of DNA are a consideration. However, additional work is necessary (e.g., using various oligonucleotides) to provide further insight into the influence of different structural features of DNA on the spatial orientation of the points in the principal component plots and modifications that govern their movement.
The present findings support the notion that the cancer-related damage to DNA revealed in this and previous reports (1, 2, 3, 4, 5) is a pivotal event in the etiology of primary tumor formation and metastasis in the breast, as it may be in other cancer-prone tissues as well. Moreover, intervention to reduce breast cancer rates, notably sporadic occurrences, which account for ≈90% of breast cancer cases (25), will likely necessitate controlling those factors that contribute to the damage, possibly including the effects of estrogens (26) and xenoestrogens (27). With regard to the etiology and prediction of cancer, the technology employed should have wide application to a variety of clinical and laboratory studies in which the status of DNA structure is important. Among such possible applications are studies of the effects of DNA cleaving molecules having selective anti-cancer activity (28, 29), DNA damage resulting from radiation (30), antioxidant protection against DNA oxidation (31, 32), structural alterations in DNA resulting from hormones (26) and xenobiotics (27), and somatic changes in genes (33).
Acknowledgments
We thank Dr. Bruce Kulander and Dynacare Laboratory of Pathology, Seattle, and The Cooperative Human Tissue Network, Cleveland, for providing breast tissues and pathology data; Dr. Henry Gardner, (United States Army Biomedical Research and Development Laboratory, Fort Detrick, Maryland) for abiding interest and support; Dr. Andy Blair and David Frazer for graphics; and Derek Stanford for excellent computing support. Helpful comments on this manuscript were provided by Drs. Joachim Liehr, Henry Gardner, and George Kriz. This work was supported by U.S. Army Medical Research and Materiel Command Contract No. DAMD17-95-1-5062.
Footnotes
The publication costs of this article were defrayed in part by page charge payment. This article must therefore be hereby marked “advertisement” in accordance with 18 U.S.C. §1734 solely to indicate this fact.
Abbreviations: PCA, principal components analysis; FT-IR, Fourier transform-infrared; RMT, reduction mammoplasty tissue; IDC, invasive ductal carcinoma without evidence of metastasis; IDCm, IDC with evidence of metastasis; MW, Mann–Whitney.
References
- 1.Malins D C, Haiminot R. Cancer Res. 1991;51:5430–5432. [PubMed] [Google Scholar]
- 2.Malins D C. J Toxicol Environ Health. 1993;40:247–261. doi: 10.1080/15287399309531792. [DOI] [PubMed] [Google Scholar]
- 3.Malins D C, Holmes E H, Polissar N L, Gunselman S J. Cancer. 1993;71:3036–3043. doi: 10.1002/1097-0142(19930515)71:10<3036::aid-cncr2820711025>3.0.co;2-p. [DOI] [PubMed] [Google Scholar]
- 4.Malins D C, Polissar N L, Nishikida K, Holmes E H, Gardner H S, Gunselman S J. Cancer. 1995;75:503–517. doi: 10.1002/1097-0142(19950115)75:2<503::aid-cncr2820750213>3.0.co;2-0. [DOI] [PubMed] [Google Scholar]
- 5.Malins D C, Polissar N L, Gunselman S J. Proc Natl Acad Sci USA. 1996;93:2557–2563. doi: 10.1073/pnas.93.6.2557. [DOI] [PMC free article] [PubMed] [Google Scholar]
- 6.Kamiya H, Miura H, Murata-Kamiya N, Ishikawa H, Sakaguchi T, Inoue H, Sasaki T, Masutani C, Hanaoka F, Nishimura S, Ohtsuka E. Nucleic Acids Res. 1995;23:2893–2899. doi: 10.1093/nar/23.15.2893. [DOI] [PMC free article] [PubMed] [Google Scholar]
- 7.Chetsanga C J, Lindahl T. Nucleic Acids Res. 1979;6:3673–3684. doi: 10.1093/nar/6.11.3673. [DOI] [PMC free article] [PubMed] [Google Scholar]
- 8.Chetsanga C J, Lozon M, Makaroff C, Savage L. Biochemistry. 1981;20:5201–5207. doi: 10.1021/bi00521a016. [DOI] [PubMed] [Google Scholar]
- 9.Boiteux S, O’Connor T R, Lederer F, Gouyette A, Laval J. J Biol Chem. 1990;265:3916–3922. [PubMed] [Google Scholar]
- 10.Breimer L H. Nucleic Acids Res. 1984;12:6359–6367. doi: 10.1093/nar/12.16.6359. [DOI] [PMC free article] [PubMed] [Google Scholar]
- 11.Laval J, Boiteux S, O’Connor T R. Mutat Res. 1990;233:73–79. doi: 10.1016/0027-5107(90)90152-t. [DOI] [PubMed] [Google Scholar]
- 12.O’Donnell-Tormey J, DeBoer C J, Nathan C F. J Clin Invest. 1985;76:80–86. doi: 10.1172/JCI111981. [DOI] [PMC free article] [PubMed] [Google Scholar]
- 13.Timm N H. In: Multivariate Analysis. Timm N H, editor. Monterey, CA: Brooks/Cole; 1975. pp. 528–570. [Google Scholar]
- 14.Efron B, Gong G. Am Stat. 1983;37:36–48. [Google Scholar]
- 15.Parker F S. Applications of Infrared, Raman, and Resonance Raman Spectroscopy in Biochemistry. New York: Plenum; 1983. pp. 349–398. [Google Scholar]
- 16.Tsuboi M. Appl Spectrosc Rev. 1969;3:45–90. [Google Scholar]
- 17.Tsuboi M. In: Basic Principles in Nucleic Acid Chemistry. Ts’o P O P, editor. Vol. 1. New York: Academic; 1974. pp. 399–452. [Google Scholar]
- 18.Weitzman S A, Turk P W, Milkowski D H, Kozlowski K. Proc Natl Acad Sci USA. 1994;91:1261–1264. doi: 10.1073/pnas.91.4.1261. [DOI] [PMC free article] [PubMed] [Google Scholar]
- 19.Kovach J S, Hartmann A, Blaszyk H, Cunningham J, Schaid D, Sommer S S. Proc Natl Acad Sci USA. 1996;93:1093–1096. doi: 10.1073/pnas.93.3.1093. [DOI] [PMC free article] [PubMed] [Google Scholar]
- 20.Von Sonntag C, Hagen U, Schön-Bopp A, Schulte-Frohlinde D. Adv Radiat Biol. 1981;9:110–142. [Google Scholar]
- 21.Steenken S. Chem Rev. 1989;89:503–520. [Google Scholar]
- 22.Scholes G, Ward J F, Weiss J. J Mol Biol. 1960;2:379–391. doi: 10.1016/s0022-2836(60)80049-6. [DOI] [PubMed] [Google Scholar]
- 23.Fidler I J, Nicolson G L. In: The Breast: Comprehensive Management of Benign and Malignant Diseases. Bland K I, Copeland E M III, editors. Philadelphia: Saunders; 1991. pp. 395–408. [Google Scholar]
- 24.Kohn E C, Liotta L A. Cancer Res. 1995;55:1856–1862. [PubMed] [Google Scholar]
- 25.Lynch H T, Marcus J N, Watson P, Lynch J. In: The Breast: Comprehensive Management of Benign and Malignant Diseases. Bland K I, Copeland E M III, editors. Philadelphia: Saunders; 1991. pp. 262–291. [Google Scholar]
- 26.Han X, Liehr J G. Carcinogenesis. 1995;16:2571–2574. doi: 10.1093/carcin/16.10.2571. [DOI] [PubMed] [Google Scholar]
- 27.Bagchi D, Bagchi M, Hassoun E A, Stohs S J. Toxicology. 1995;104:129–140. doi: 10.1016/0300-483x(95)03156-a. [DOI] [PubMed] [Google Scholar]
- 28.Hiramoto K, Fujino T, Kikugawa K. Mutat Res. 1996;360:95–100. doi: 10.1016/0165-1161(95)00073-9. [DOI] [PubMed] [Google Scholar]
- 29.Quinlan G J, Gutteridge J M C. Free Radicals Biol Med. 1988;5:341–348. doi: 10.1016/0891-5849(88)90106-2. [DOI] [PubMed] [Google Scholar]
- 30.Dizdaroglu M, Gajewski E. Methods Enzymol. 1990;186:530–544. doi: 10.1016/0076-6879(90)86147-n. [DOI] [PubMed] [Google Scholar]
- 31.Ames B N, Shigenaga M K, Hagen T M. Proc Natl Acad Sci USA. 1993;90:7915–7922. doi: 10.1073/pnas.90.17.7915. [DOI] [PMC free article] [PubMed] [Google Scholar]
- 32.Bast, A., Haenen, G. R. M. M. & Doelman, C. J. A. (1991) Am. J. Med. 91, Suppl. 3C, 2S–13S. [DOI] [PubMed]
- 33.Negrini M, Monaco C, Vorechovsky I, Ohta M, Druck T, Baffa R, Huebner K, Croce C M. Cancer Res. 1996;56:3173–3179. [PubMed] [Google Scholar]


