

Abstract
The effects of colon-derived butyrate on intestinal cell proliferation are controversial. In vitro studies suggest an inhibitory effect, and in vivo studies suggest the opposite, but neither type of study has been based on a physiologically relevant, intracolonic supply of butyrate. In this study, piglets (n = 24) were fed sow’s milk replacement formula and randomized into 4 equal groups: 1) control; 2) cecal butyrate infusion at a rate equal to that produced in the colon; 3) inulin supplementation at a concentration previously found to lower cecal cell proliferation; and 4) butyrate infusion plus inulin supplementation. After 6 d of oral feeding, cecal butyrate infusions were initiated for a period of 4 d. Cecal, distal colonic, jejunal, and ileal cell proliferation, apoptosis, and morphology were evaluated and serum concentration of glucagon-like peptide-2 (GLP-2) was measured. Butyrate or inulin did not affect GLP-2, weight gain, apoptosis, intestinal injury scores, cecal or colon crypt depth, and jejunal or ileal villus height. For cell proliferation, there was a significant interaction between inulin, butyrate, and tissue (P = 0.007). Inulin modified the effect of butyrate (butyrate × inulin interaction in cecum, P = 0.001; in distal colon, P = 0.018; in ileum, P = 0.001; and in jejunum, P = 0.003). In the absence of inulin, butyrate caused a 78–119% increase in cell proliferation in the ileum, distal colon, jejunum, and cecum (P ≤ 0.002). Thus, at an entry rate into the colon within the physiological range, butyrate caused increased intestinal cell proliferation, but inulin tended to block this effect. Thus, intracolonic butyrate may enhance intestinal growth during infancy.
Introduction
Sugars, starches, or fibers not digested in the small intestine are subjected to bacterial fermentation in the colon, which produces butyrate and other short-chain fatty acids, normally efficiently absorbed in the colon (1). Previous studies suggest that intracolonic infusion or instillation of butyrate causes increased colonic or small intestinal cell proliferation, which could be beneficial in patients recovering from intestinal surgery, trauma, infection, or other inflammatory states (2–4). On the other hand, patients with familial polyposis, who are great risk for recurrent colonic cancer, benefit from decreased cell proliferation in the colonic mucosa (5). In cultured neoplastic cells of colonic origin, butyrate generally causes a suppression of the cell cycle, although the effect may be concentration dependent (6,7).
We have been particularly interested in novel approaches for accelerating the transition to full enteral feeding and for enhancing intestinal and colonic function in patients with severe carbohydrate malabsorption, as occurs in infants with short bowel syndrome (1,8). Thus, we developed a piglet model of carbohydrate malabsorption using lactulose, an indigestible disaccharide of galactose and fructose (8). Feeding a laxative dose of lactulose causes decreased cecal cell proliferation but increased production of butyrate in the colonic lumen (8–10). We also sought ways to enhance colonic fermentation so that, when challenged with severe carbohydrate malabsorption, fermentation (and presumably butyrate production) might be enhanced without producing severe osmotic diarrhea. Inulin is a fructooligosaccharide (FOS) with a mean of 35 fructosyl units. FOS are found naturally in infant and adult foods (1,11). The cofeeding and/or prefeeding of inulin reversed the inhibitory effects of lactulose on cecal cell proliferation while also preventing the lactulose-induced increase in butyrate production (9,10). However, feeding inulin by itself also inhibited cecal cell proliferation and caused an intermediate rate of butyrate production, not significantly different from either control- or lactulose-fed piglets (10). Because both lactulose and inulin caused a decrease in cecal cell proliferation when consumed separately, one might speculate that these sugars inhibit the growth of bacterial species normally promoting colonic cell proliferation (12) but competitively inhibit each other’s effects when consumed together. The experiment outlined in the present study was designed to determine whether, in the absence of lactulose, butyrate also would inhibit colonic and small intestinal cell proliferation and whether inulin would again prevent this effect.
In response to luminal fatty acids, glucagon-like-peptide 2 (GLP-2)8 is released from enteroendocrine L cells present throughout the intestine but localized particularly to the distal ileum and colon (13–17,17–22). In pigs with postintestinal resection (short bowel syndrome), the intravenous infusion of butyrate caused increased plasma GLP-2 concentrations (23). It is not clear whether GLP-2 at physiological levels of secretion affects cell proliferation in pigs (15,16,19). As preliminary results from the present study became available, we elected to assess the blood concentration of GLP-2 to determine whether cecal butyrate infusion or inulin feeding affected its circulating concentration.
Materials and Methods
Animals, feedings, and design
Twenty-four standard Yorkshire/Hampshire piglets were studied at the University of Vermont, where the Institutional Animal Care and Use Committee approved the research protocol. At ~12 d of age, the piglets were transported from the pig farm to the laboratory. The piglets were then fed orally a sow’s milk replacer (SMR) formula for 6 d(control formula) (SPF Lac, Sterile milk replacer, PetAG). Based on actual analysis (Covance Laboratories), the macro-nutrient composition was the following: energy, 3.7 MJ · L−1; protein, 48.2 g · L−1; fat, 60.5 g · L−1; total carbohydrate, 33.9 g · L−1; and lactose, 28.7 g · L−1. The formula was further supplemented with lactose to achieve a final concentration of 60 g · L−1.
The piglets were assigned to 4 study groups: 1) The control group (C) received only the SMR formula for both the preoperative period of 6 d and also postoperatively after the insertion of a cecal catheter on d 7 (n = 6). For 4 d postoperatively, this group received a cecal infusion (1 mL · h−1) of PBS (pH 7.4; phosphate, 10 mmol · L−1; NaCl, 138 mmol · L−1; KC1, 2.7 mmol · L−1) (P–3813, Sigma-Aldrich). 2) Experimental group B also was fed SMR for the entire experiment but, for 4 d postoperatively, they received a cecal infusion of butyrate (1 mL · h−1) (12.7 μmol · min−1) (n = 6). 3) Experimental group I was fed SMR and inulin (3 g · L−1) for the entire study and a cecal infusion of PBS postoperatively at an identical rate to group C (n = 6). The dose of inulin was based both on our previous study (9) and a study by others (24), which suggested that this dose of inulin augmented colonic mucosal cell proliferation. 4) Experimental group B + I was fed SMR + inulin for the entire study period and received the cecal butyrate infusion postoperatively (n = 6).
The study was designed so that the cecal butyrate infusion equaled the difference in the means for cecal synthesis of butyrate between the control and lactulose groups in our previous study (10). The actual mean rate of cecal infusion of butyrate was 2.30 μmol · kg−1 · min−1 and 2.13 μmol · kg−1 · min−1 in the experimental groups B and B + I. These rates can be compared with the mean rate of synthesis of butyrate in the cecal lumen (grand mean) of 2.2 ± 0.3 μmol · kg−1 · min−1, which did not statistically differ in the groups fed control formula, inulin, lactulose, and inulin + lactulose in our previous study, when expressed per body weight (10).
During the study, body weight, formula intake, and stool characteristics were monitored. Diarrhea was quantified as previously described (8,9).
Details of the surgical procedures have been described previously (10,25–28). Anesthesia was induced (intramuscular telazol, 6 mg · kg−1, and xylazine, 4 mg · kg−1), and general anesthesia was maintained with isoflurane via an endotracheal tube. A cecal catheter was inserted very close to the ileocecal valve (25). The piglets resumed oral feeding and received cecal infusions of butyrate or PBS according to their group assignments.
After 4 d of cecal infusion (d 5), the piglets were anesthetized with the telazol/xylazine combination, and bromodeoxyuridine (25 mg · kg−1) was injected into an ear vein (8). Two hours later, the piglets were reanesthetized with the telazol/xylazine combination, and breath was collected from the trachea to determine H2, CH4, and CO2 concentrations (Quintron Instrument) (10). General anesthesia was then maintained with isoflurane, and a laparotomy was performed. Cecal pH was measured (Model Omega PHH-253, Omega Technologies). Tissue was then biopsied from the cecum (8–10 cm from the ileocecal valve), distal colon (10–15 cm from the rectum), jejunum (10–15 cm from the pylorus), and ileum (10–15 cm proximal to the ileocecal valve). Studies of histology (morphometry), cell proliferation, and apoptosis were performed on this tissue. Finally, prior to killing the animals, blood was obtained via cardiac puncture, and the serum was separated and frozen at −80°C.
Histological damage assessment
We used a system for the histologic assessment of injury or inflammation that was previously described (10,29).
In slides stained for BrdU labeling (see below), we assessed total crypt depth (cecum and distal colon) and total villus length (jejunum and ileum) by counting cells (Fig. 1). To accomplish this, we counted the entire number of cells lining the cecal or colonic crypt or forming the villus for each crypt or villus; the final count was also utilized for our assessment of cell proliferation. Both stained and unstained cells were used to enumerate the total number of cells per crypt or villus. The crypt depth or villus height was equal to the total number of cells divided by 2 (Fig. 1).
Figure 1.
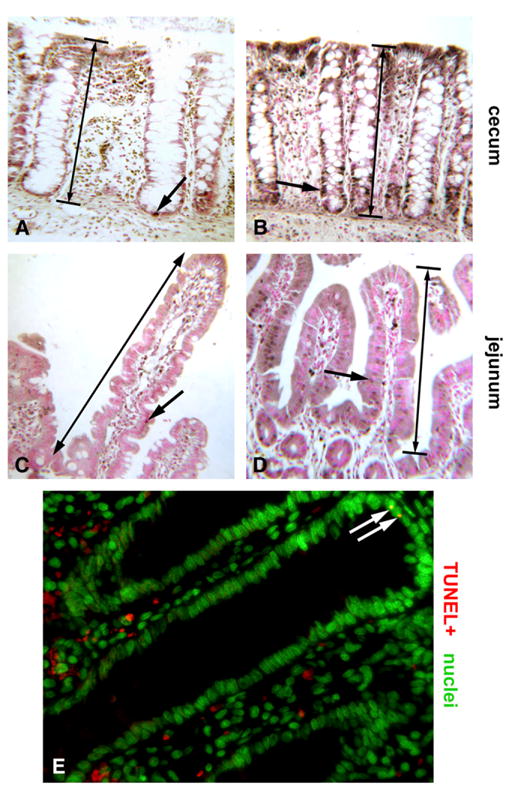
Photomicrographs exhibiting effects of butyrate on intestinal epithelium proliferation and apoptosis in piglets. Representative fields depicting BrdU immunohistochemistry (brown) with Fast Red nuclear counterstain (pink) (160X, oil immersion). Large arrows denote crypt depth or villus height used for measurements (A–D) Control piglet cecum showing few BrdU+ nuclei (brown dots, arrow) with most nuclei BrdU-negative (pink dots) (A). Butyrate-treated piglet demonstrating enhancement in epithelial proliferation (arrow) (B). Jejunum of a control piglet showing few BrdU+ nuclei (brown dots, arrow) (C). Butyrate-treated jejunum displays more nuclei incorporating the label (arrow) (D). Widefield fluorescence field of the jejunum from a butyrate-treated piglet showing typically rare TUNEL+ nuclei or apoptotic bodies (arrows, yellow dots) among the epithelium. Nuclei are counterstained green (400x) (E).
Cell proliferation index
Unstained, paraffin-embedded slides were deparaffinized and then stained for bromodeoxyuridine labeling (Cell Proliferation Kit from Amersham Life Science, KPN 20) (9,10) (Fig. 1). For each of the 24 piglets, we estimated the CV for the proliferati ve index (PI) of the 10 crypts counted in each piglet. For the 24 piglets, the mean CV was 20.3, 22.8, 23.4, and 23.2% for cecum, colon, jejunum, and ileum, respectively.
Using counts of the total number of cells in the crypt and the crypt height, we also estimated the PI for the lower 40% of the cecal and colonic crypt. However, for the upper 40% of the cecal and colonic crypt, we estimated the ϕh value (labeled cells in the upper 40% of the crypt divided by total labeled cells in the crypt) (9,10,30).
Assessment of apoptosis
DNA fragmentation (apoptosis) was assessed using a modified TUNEL staining protocol (31,32). A DeadEnd Colorimetric TUNEL System Kit G7132 (Promega) was used with the initial steps of the TUNEL protocol following the manufacturer’s suggestions. A modification of the kit (TdT-based end labeling with biotin-UTP as the labeled nucleotide) included incubation with streptavidin-CY3 (1:2000, Jackson ImmunoResearch) and 0.5 mg · L−1 Hoechst stain solution (Molecular Probes) in the final labeling step. We used slides treated with DNAase as positive controls, and, for negative controls, we used slides in which the rTdT reaction mix (1 μL) was left out of the TUNEL protocol. For each of the 10 crypts or villi for each piglet, we used sequential pictures so that the entire crypt or villus was displayed, and we estimated apoptosis as the percentage of total cells in each cecal/colonic crypt or jejunal/ileal villus, which were stained (33). A composite photomicrograph showing the labeling of an apoptotic cell is shown in Figure 1. For each of the 24 piglets, we estimated the CV for the percentage of apoptotic cells for the 10 crypts counted in each piglet. For the 24 piglets, the mean CV was 163, 64, 159, and 35% for cecum, colon, jejunum, and ileum, respectively, which reflects the very low number of apoptotic cells visualized in 10 crypts per piglet.
Assay of serum concentration of GLP-2
For 5 piglets in each group, the serum concentration of GLP-2 was measured by radioimmunoassay after extraction of plasma with 70% ethanol (v:v, final concentration) (34). The radioimmunoassay used antiserum code 92160 and standards of human GLP-2 (proglucagon 126–158, a gift from Novo Nordisk A/S) and monoiodinated Tyr-12 GLP-1, specific activity >70 MBq/nmol (34). The antiserum is directed against the N-terminus of GLP-2 and therefore measures only fully processed, biologically active GLP-2 of intestinal origin. Sensitivity was <5 pmol · L−1, and the intra-assay CV was <10%.
Data analysis and statistics
During histologic examination and other data analyses, the investigators were masked to the identity of the treatment group for each piglet. For analyses of variables relevant to the whole animal (food intake, weight gain, diarrhea, cecal pH, and breath H2 concentration), we used 2-way ANOVA to examine the main dietary group effect (inulin) and butyrate effect (SPSS Base 10.0). Any significant interaction effect was followed by an F-test for simple effects (35) (SAS System for Windows, version 8.1).
Because cecal inflammation, intestinal morphometry, cell proliferation, and apoptosis were examined in multiple tissues per animal, the analyses were based on a mixed-model approach to repeated-measures ANOVA, in which dietary group (inulin or noninulin) and the presence or absence of butyrate were the grouping factors, and tissue was the within-subjects repeated factor. Thus, the outcome was modeled as:
where Yijkl is the response of tissue k in the ith animal in the jth dietary group (j = 1 to 2) and the kth butyrate group (k = 1 to 2); μ, is the overall mean, Aj is the fixed effect of the jth dietary group, Bk is the fixed effect of the kth butyrate group, ABjk is the interaction of the dietary and butyrate grouping factors, and Tl is the fixed effect of the lth tissue. Included in the model are the random effects of animal dijk, the interaction effect of treatment with tissue ABTijl, and the random error εijkl. Analyses were performed using the proc mixed procedure in SAS, modeled with an unstructured covariance matrix (36). Any significant interaction effect was followed by an F-test for simple effects (35). All results are expressed as the mean ± SEM. Significance was set to a value of P = 0.05 for all tests.
Results
Formula intake, weight gain, diarrhea, cecal pH, and breath H2 concentration
Preoperatively, there was no group effect on formula intake or weight gain. Postoperatively, neither butyrate nor inulin affected formula intake, but a significant interaction was observed primarily because the highest intake was found in the B + I group. There was no inulin or butyrate effect on the rate of postoperative weight gain or the ratio of weight gain to formula intake. There also was no significant inulin or butyrate effect on the fraction of days with diarrhea or breath concentration of H2 or CH4. There was a significant inulin effect (P = 0.018) but no butyrate effect on the cecal wet:dry weight ratio, an index of fluidity of cecal fluid (Table 1). Inulin (P = 0.007) but not butyrate had an effect on cecal pH (Table 1). Thus, the mean for both cecal wet:dry weight ratio and cecal pH was lower in the 2 groups receiving inulin than in the 2 groups that did not.
TABLE 1.
Effects of butyrate and inulin treatments in piglets1
| Groups
|
P-values
|
||||||
|---|---|---|---|---|---|---|---|
| C | B | I | B + I | B | I | B × I | |
| Cecal fluid | |||||||
| Wet/dry wt | 8.7 ± 0.7 | 7.6 ± 0.8 | 5.9 ± 0.4 | 6.7 ± 1.0 | >0.1 | 0.018 | >0.1 |
| Luminal pH | 7.04 ± 0.11 | 7.01 ± 0.17 | 6.61 ± 0.19 | 6.51 ± 0.13 | >0.1 | 0.007 | >0.1 |
| Cecum | |||||||
| PI L402,3 | 0.21 ± 0.02 | 0.42 ± 0.04* | 0.29 ± 0.03 | 0.29 ± 0.03 | <0.001 | >0.1 | 0.002 |
| ϕh2 | 0.44 ± 0.04 | 0.48 ± 0.03 | 0.42 ± 0.05 | 0.49 ± 0.03 | >0.1 | >0.1 | >0.1 |
| Apoptosis,2% | 0.19 ± 0.07 | 0.27 ± 0.07 | 2.9 ± 2.7 | 2.8 ± 0.1 | >0.1 | >0.1 | 0.077 |
| Distal colon | |||||||
| PI L402,3 | 0.15 ± 0.01 | 0.28 ± 0.02* | 0.19 ± 0.03 | 0.20 ± 0.03 | <0.001 | >0.1 | 0.002 |
| ϕh2 | 0.29 ± 0.04 | 0.26 ± 0.03 | 0.40 ± 0.03 | 0.32 ± 0.04 | >0.1 | >0.1 | >0.1 |
| Apoptosis,2% | 0.07 ± 0.05 | 0.06 ± 0.11 | 0.06 ± 0.06 | 0.04 ± 0.03 | >0.1 | >0.1 | 0.077 |
| Jejunum | |||||||
| Apoptosis,2% | 0.13 ± 0.05 | 0.09 ± 0.04 | 1.30 ± 0.69 | 0.52 ± 0.39 | >0.1 | >0.1 | 0.077 |
| Ileum | |||||||
| Apoptosis,2% | 0.03 ± 0.03 | 2.06 ± 2.06 | 0.0 ± 0.0 | 0.04 ± 0.04 | >0.1 | >0.1 | 0.077 |
Values are means ± SEM, n = 6; ileal apoptosis, n = 4.
Different from corresponding group without inulin, P < 0.001.
Performed as a single analysis including repeated effects for tissue. Inulin × butyrate × tissue interaction, P> 0.1.
Lower 40% of the crypt.
Cecal inflammation, intestinal morphometry, cell proliferation, and apoptosis
Butyrate or inulin did not affect cecal inflammation or injury score for cecum, distal colon, jejunum, or ileum. Treatment group also did not significantly affect cecal or distal colonic crypt depth or jejunal or ileal villus height.
For each of the 4 tissues, there was no overlap of the values for cell PI (total crypt or villus) in the control and butyrate groups (Fig. 2). The interaction of butyrate, inulin, and tissue type (P = 0.002) indicated that the combined effect of butyrate and inulin differed in the various tissues examined. An examination of the simple effects within each tissue revealed that inulin modifies the effect of butyrate (butyrate × inulin interaction within the cecum, P = 0.001; within the colon, P = 0.018; within the ileum, P = 0.001;and within the jejunum, P = 0.003). In the absence of inulin, butyrate resulted in increases in the cell PI of 119% in the cecum (P < 0.001), 111% in the jejunum (P < 0.001), 89% in the distal colon (P = 0.002), and 78% in the ileum (P = 0.001). Conversely, butyrate did not affect the cell PI in any of these tissues when inulin was present.
Figure 2.
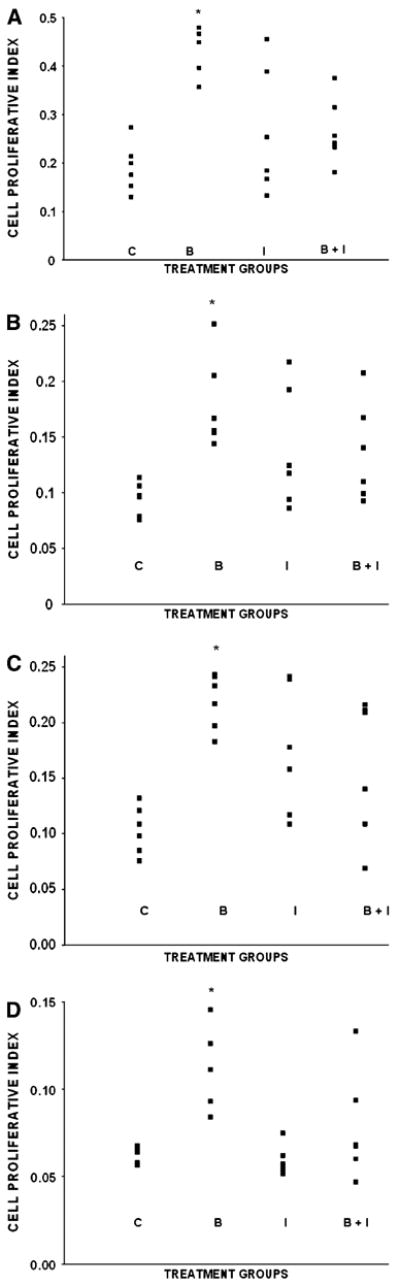
Scattergrams depicting intestinal cell proliferative index of piglets in the control (C), butyrate (B), inulin (I), and butyrate + inulin groups (B + I). Cecum: The means (± SEM) for the C, B, I, and B + I groups were as follows: 0.19 ± 0.02, 0.42 ± 0.02, 0.26 ± 0.05, and 0.27 ± 0.03 (A). Distal colon: 0.09 ± 0.01, 0.18 ± 0.02, 0.14 ± 0.02, and 0.14 ± 0.02 (B). Jejunum: 0.10 ± 0.01, 0.22 ± 0.01, 0.17 ± 0.02, and 0.16 ± 0.03 (C). lleum: 0.06 ± 0.002, 0.11 ± 0.011, 0.06 ± 0.003, and 0.08 ± 0.013 (D). *Main effect of butyrate, P< 0.001 (main effect of inulin, P> 0.1). B different from C, P ≤ 0.002.
The butyrate × inulin interaction effect (P = 0.002), when examining the lower 40% of the crypt for the cecum and distal colon, again suggests that the presence of inulin altered the reaction to butyrate. The nonsignificant butyrate × inulin × tissue interaction suggests that this effect of butyrate is similar in both tissues, with the overall PI in both increasing by 95% in the absence of inulin (P < 0.001) compared with no change in the PI when inulin was present in the lower 40% of the crypt for cecum or distal colon. Neither butyrate nor inulin affected the ϕh value in either the cecum or distal colon. Fractional apoptosis did not differ among the 4 dietary groups (Table 1).
Serum concentration of GLP-2
The serum concentration of GLP-2 (pmol · L−1) did not differ among the 4 groups (overall, 34.8 ± 3.3).
Discussion
Our results suggest that cell proliferation is stimulated, ~2-fold, by a cecal infusion of butyrate, which is similar to in vivo rates of cecal luminal synthesis. We designed the study to infuse butyrate at a constant level (μmol/min; groups B and B + I) corresponding to the 120% increase in the rate of cecal luminal synthesis of butyrate in a lactulose-fed group compared with the control group (10). However, the mean rate of butyrate infusion in group B (2.30 μmol · kg−1 · min−1) was similar to the grand mean of the rate of synthesis of butyrate (2.2) in piglets fed either the control formula (1.7 ± 0.4), lactulose (3.0 ± 0.5), inulin (2.2 ± 0.7), or lactulose plus inulin (1.8 ± 0.5) in our previous study (10), and it was also similar to the mean production rate (2.0) in older pigs (37). Thus, we are confident that, in piglets, a physiologically relevant rate of intracecal butyrate infusion, which did not cause obvious intestinal injury, stimulated cell proliferation not only in the cecum but also in tissues apparently remote from the infusion, i.e., the distal colon, jejunum, and ileum. Although cell proliferation was conventionally expressed as a PI, the lack of a group effect on crypt depth and villus height (both measured as cell numbers) means that the total mean number of proliferating cells was also increased in the butyrate group.
Previous studies in rats and piglets also suggest that butyrate can stimulate cell proliferation in the colon and small intestine when infused into the cecum or colon or administered intravenously (2,3,23,38). These results suggest that increased amounts of butyrate, formed via fermentation of undigested sugars, starches, or fibers, also might be trophic to the small intestine in developing infants, in infants who have short bowel syndrome, or in infants who are recovering from malnutrition or diarrheal diseases. Moreover, because it is now possible to feed starches, relatively resistant to digestion, that are butyrylated and cause a larger “production” of butyrate in the colon, our data may be relevant to practical approaches toward enhancing small bowel growth using butyrate (39).
Cecal or colonic crypt depth, jejunal and ileal villus height, and apoptosis in these 4 intestinal tissues were not altered. In regard to the latter finding, we should point out that the means in each of the groups for each tissue were small but variable. Because this study was originally designed to test the hypothesis that butyrate would decrease and not increase cecal cell proliferation, we did not assess intestinal length or nitrogen content, which might have provided additional evidence of enhanced intestinal growth (40).
We do not know the mechanism for the observed effects of intracecal butyrate. In our previous study, lactulose or inulin feeding caused decreased cecal cell proliferation and respectively increased, or tended to increase, butyrate synthesis (10), whereas, in this study, inulin blocked the stimulatory effects of butyrate infusion on cell proliferation. Therefore, we wonder if these sugars might alter the cecal density of bacteria that could have stimulatory effects on cecal cell proliferation via their protein products (41–43). Indeed, we recently showed that piglets fed lactulose had lower cecal densities of clostridial species (12). However, in the same inulin-treated piglets participating in the present study, a 52% reduction in clostridial densities did not quite reach statistical significance (12). An understanding of how the microbiological flora, or the products of their own metabolism (e.g., butyrate), alter cell kinetics in small intestine, colon, and the pancreatic β-cell, could lead to new therapeutic targets for patients with deficient intestinal mass and function and to novel strategies for preventing epidemic health problems such as obesity and type 2 diabetes (e.g., intake of fibers enhancing butyrate production) (43,44). Thus, the fact that a physiologically relevant intracecal butyrate infusion increased intestinal cell proliferation without significantly altering luminal pH or intestinal morphology is of scientific interest. Although we did not assess immunological and cytokine effects of cecal butyrate infusion, we found no evidence that this infusion caused inflammation. Previous work suggested that the intestinotrophic effects of colon-derived short-chain fatty acids may be mediated by vagal innervation (3). Glucagon-like peptides (GLP) are secreted by enteroendocrine L cells in the distal intestine in response to unabsorbed nutrients, including short-chain fatty acids, and this process may be mediated, at least in part, by the vagus nerve (13,45). We measured the serum concentration of GLP-2 because this compound is a putative mediator of increased intestinal cell proliferation. However, whereas in rodents GLP-2 causes increased cell proliferation in the small intestine, in piglets this may not be a physiological effect of GLP-2 (15,16,46,47). In this study, we did not detect an effect of either butyrate or inulin on serum concentration of GLP-2, although the mean values in each group were similar to those in healthy newborn piglets receiving parenteral nutrition (23,48) or in somewhat older piglets enterally fed after an intestinal resection procedure (49). Besides effects on GLP-2 secretion, alternative mechanisms that explain the effects per se of cecal butyrate infusion would include other, presently unknown, circulating mediators or a direct effect of butyrate reaching the target cells via the circulation. Because the arterial concentration of butyrate is known to be extremely low, it is likely that tracer studies are required to obtain further insight into the correlation between the in vivo supply of butyrate to organs other than the colon and molecular effects of butyrate on these organs. Determining whether colon-derived butyrate acts on “distant” tissues via direct effects is also of practical interest. Cow’s milk contains a substantial amount of butyrate within glycerides (50), and particularly in the past, when non-breast-fed infants were often fed formulas based on cow’s milk, the estimated butyrate intake in a 3-kg infant was probably as high as 2 μmol · kg−1 · min−1. Thus, if butyrate’s trophic effects on intestinal cell proliferation do not require its initial presence in the colon (where it could stimulate GLP-2 secretion), then ingestion of butyrate in the diet (e.g., in cow’s milk or dairy products) might affect intestinal development.
As another explanation for previous results (10), osmotic diarrhea per se could either alter the composition of the bacterial flora and/or affect the metabolism of the existing bacteria, which might then have an overall repressing effect on cecal cell proliferation. In the present study, although inulin did not cause a statistically significant change in the fraction of loose stools (I, 0.33 ± 0.17 and B + I, 0.25 ± 0.09) compared with the C or B groups (0.11 ± 0.07 and 0.00 ± 0.00, respectively), it did cause an increase in the wet:dry weight ratio of the cecal luminal fluid. Thus, one might generally conclude that, despite varying clinical conditions in the piglets in the previous (10) and present study, inulin probably consistently exerts an osmotic effect in the cecal lumen, resulting in a larger water concentration. However, despite the similar osmotic effects of inulin in the 2 studies, and whereas inulin caused a lowering of cecal cell proliferation in our previous study (10), there was no evidence of this effect in the present study. We cannot reconcile these apparent opposing effects of inulin on cecal cell proliferation, except that perhaps other clinical factors inherent with the catheter surgery in the previous study might have affected cecal cell proliferation apart from effects of either butyrate or specific bacterial species. Such superimposed effects of abdominal surgery may need to be taken into account when considering extrapolating effects of prebiotics (observed in healthy patients or animal populations) to patients with gastrointestinal disease or injury (including surgical resection).
In summary, piglets were fed sow’s milk replacement formula, with or without supplementation with inulin. In piglets not receiving inulin supplementation, cecal butyrate infusion, at a physiologically relevant rate, caused increases in cell proliferation of the cecum, distal colon, jejunum, and ileum, without affecting intestinal morphology or apoptosis. Thus, butyrate, produced by bacterial fermentation of carbohydrates normally ingested by piglets, may play an important role in intestinal growth. It does not appear that the effects of intracecal butyrate are mediated by GLP-2.
Acknowledgments
We appreciate the technical assistance of Rhonda Maple, Karen Everingham, Kyla LaRock. We also thank Morton Alling IV, and Heather Joyce of the Animal Resources Center, University of Vermont.
Abbreviations used
- GLP-2
glucagon-like peptide 2
- PI
proliferative index
- SMR
sow’s milk replacer (formula)
Footnotes
Supported by the NIH, grant DK61775.
Literature Cited
- 1.Roy CC, Kien CL, Bouthillier L, Levy E. Short-chain fatty acids: ready for prime time? Nutr Clin Pract. 2006;21:351–66. doi: 10.1177/0115426506021004351. [DOI] [PubMed] [Google Scholar]
- 2.Sakata T. Stimulatory effect of short-chain fatty acids on epithelial cell proliferation in the rat intestine: a possible explanation for trophic effects of fermentable fibre, gut microbes and luminal tropic factors. Br J Nutr. 1987;58:95–103. doi: 10.1079/bjn19870073. [DOI] [PubMed] [Google Scholar]
- 3.Frankel WL, Zhang W, Singh A, Klurfeld DM, Don S, Sakata T, Modlin I, Rombeau JL. Mediation of the trophic effects of short-chain fatty acids on the rat jejunum and colon. Gastroenterology. 1994;106:375–80. doi: 10.1016/0016-5085(94)90595-9. [DOI] [PubMed] [Google Scholar]
- 4.Sakata T, Tamate H. Rumen epithelial cell proliferation accelerated by rapid increase in intraruminal butyrate. J Dairy Sci. 1978;61:1109–13. doi: 10.3168/jds.S0022-0302(78)83694-7. [DOI] [PubMed] [Google Scholar]
- 5.Lipkin M, Newmark H. Effect of added dietary calcium on colonic epithelial cell proliferation in subjects at high risk for familial colonic cancer. N Engl J Med. 1985;313:1381–4. doi: 10.1056/NEJM198511283132203. [DOI] [PubMed] [Google Scholar]
- 6.Singh B, Halestrap A, Paraskeva C. Butyrate can act as a stimulator of growth or inducer of apoptosis in human colonic epithelial cell lines depending on the presence of alternative energy sources. Carcinogenesis. 1997;18:1265–70. doi: 10.1093/carcin/18.6.1265. [DOI] [PubMed] [Google Scholar]
- 7.Davie JR. Inhibition of histone deacetylase activity by butyrate. J Nutr. 2003;133:2485S–93S. doi: 10.1093/jn/133.7.2485S. [DOI] [PubMed] [Google Scholar]
- 8.Kien CL, Murray RD, Qualman SJ, Marcon M. Lactulose feeding in piglets: A model for persistent diarrhea and colitis induced by severe sugar malabsorption. Dig Dis Sci. 1999;44:1476–84. doi: 10.1023/a:1026672306929. [DOI] [PubMed] [Google Scholar]
- 9.Kien CL, Chang JC, Cooper JR, Frankel WL. Effects of prefeeding a prebiotic on diarrhea and colonic cell proliferation in piglets fed lactulose. JPEN J Parenter Enteral Nutr. 2004;28:22–6. doi: 10.1177/014860710402800122. [DOI] [PubMed] [Google Scholar]
- 10.Kien CL, Schmitz-Brown M, Solley T, Sun D, Frankel WL. Increased colonic luminal synthesis of butyric acid is associated with lowered colonic cell proliferation in piglets. J Nutr. 2006;136:64–9. doi: 10.1093/jn/136.1.64. [DOI] [PMC free article] [PubMed] [Google Scholar]
- 11.Briet F, Achour L, Flourie B, Beaugerie L, Pellier P, Franchisseur C, Bornet F, Rambaus JC. Symptomatic response to varying levels of fructo-oligosaccharides consumed occasionally or regularly. Eur J Clin Nutr. 1995;49:501–7. [PubMed] [Google Scholar]
- 12.Kien CL, Blauwiekel R, Williams CH, Bunn JY, Buddington RK. Lactulose feeding lowers cecal densities of Clostridia in piglets. JPEN J Parenter Enteral Nutr. 2007 doi: 10.1177/0148607107031003194. in press. [DOI] [PMC free article] [PubMed] [Google Scholar]
- 13.Kieffer TJ, Habener JF. The glucagon-like peptides. Endocr Rev. 1999;20:876–913. doi: 10.1210/edrv.20.6.0385. [DOI] [PubMed] [Google Scholar]
- 14.Tappenden KA, Thomson ABR, Wild GE, McBurney MI. Short-chain fatty acids increase proglucagon and ornithine decarboxylase messenger RNAs after intestinal resection in rats. JPEN J Parenter Enteral Nutr. 1996;20:357–62. doi: 10.1177/0148607196020005357. [DOI] [PubMed] [Google Scholar]
- 15.Burrin DG, Stoll B, Jiang R, Petersen Y, Elnif J, Buddington RK, Schmidt M, Holst JJ, Hartmann B, et al. GLP-2 stimulates intestinal growth in premature TPN-fed pigs by suppressing proteolysis and apoptosis. Am J Physiol Gastrointest Liver Physiol. 2000;279:G1249–56. doi: 10.1152/ajpgi.2000.279.6.G1249. [DOI] [PubMed] [Google Scholar]
- 16.Burrin DG, Stoll B, Guan X, Cui L, Chang X, Holst JJ. Glucagon-like peptide 2 dose-dependently activates intestinal cell survival and proliferation in neonatal piglets. Endocrinology. 2005;146:22–32. doi: 10.1210/en.2004-1119. [DOI] [PubMed] [Google Scholar]
- 17.Brubaker PL, Izzo A, Hill M, Drucker DJ. Intestinal function in mice with small bowel growth induced by glucagon-like peptide-2. Am J Physiol. 1997;272:E1050–8. doi: 10.1152/ajpendo.1997.272.6.E1050. [DOI] [PubMed] [Google Scholar]
- 18.Tsai C-H, Hill M, Asa SL, Brubaker PL, Drucker DJ. Intestinal growth-promoting proterties of glucagon-like peptide-2 in mice. Am J Physiol Endocrinol Metab. 1997;273:E77–84. doi: 10.1152/ajpendo.1997.273.1.E77. [DOI] [PubMed] [Google Scholar]
- 19.Burrin D, Guan X, Stoll B, Petersen YM, Sangild PT. Glucagon-like peptide 2: a key link between nutrition and intestinal adaptation in neonates? J Nutr. 2003;133:3712–6. doi: 10.1093/jn/133.11.3712. [DOI] [PubMed] [Google Scholar]
- 20.Reimer RA, McBurney MI. Dietary fiber modulates intestinal proglucagon messenger ribonucleic acid and postprandial secretion of glucagon-like peptide-1 and insulin in rats. Endocrinology. 1996;137:3948–56. doi: 10.1210/endo.137.9.8756571. [DOI] [PubMed] [Google Scholar]
- 21.Estall JL, Drucker DJ. Dual regulation of cell proliferation and survival via activation of glucagon-like peptide-2 receptor signaling. J Nutr. 2003;133:3708–11. doi: 10.1093/jn/133.11.3708. [DOI] [PubMed] [Google Scholar]
- 22.Thulesen J. Glucagon-like peptide 2 (GLP-2), an intestinotrophic mediator. Curr Protein Pept Sci. 2004;5:51–65. doi: 10.2174/1389203043486946. [DOI] [PubMed] [Google Scholar]
- 23.Bartholome AL, Albin DM, Baker DH, Holst JJ, Tappenden KA. Supplementation of total parenteral nutrition with butyrate acutely increases structural aspects of intestinal adaptation after an 80% jejunoileal resection in neonatal piglets. JPEN J Parenter Enteral Nutr. 2004;28:210–22. doi: 10.1177/0148607104028004210. [DOI] [PubMed] [Google Scholar]
- 24.Howard MD, Gordon DT, Pace LW, Garleg KA, Kerley MS. Effects of dietary supplementation with fructooligosaccharides on colonic microbiota populations and epithelial cell proliferation in neonatal pigs. J Pediatr Gastroenterol Nutr. 1995;21:297–303. doi: 10.1097/00005176-199510000-00007. [DOI] [PubMed] [Google Scholar]
- 25.Kien CL, Ailabouni AH, Murray RD, Powers PA, McClead RE, Kepner J. Technical note: pig model for studying nutrient assimilation by the intestine and colon. J Anim Sci. 1997;75:2161–4. doi: 10.2527/1997.7582161x. [DOI] [PubMed] [Google Scholar]
- 26.Kien CL, Chang JC, Cooper JR. Quantitation of colonic luminal synthesis of butyric acid in piglets. J Pediatr Gastroenterol Nutr. 2002;35:324–8. doi: 10.1097/00005176-200209000-00016. [DOI] [PubMed] [Google Scholar]
- 27.Ebner S, Schoknecht P, Reeds P, Burrin D. Growth and metabolism of gastrointestinal and skeletal muscle tissues in protein-malnourished neonatal pigs. Am J Physiol. 1994;266:R1736–43. doi: 10.1152/ajpregu.1994.266.6.R1736. [DOI] [PubMed] [Google Scholar]
- 28.Reeds PJ, Burrin DG, Jahoor F, Wykes L, Henry J, Frazer EM. Enteral glutamate is almost completely metabolized in first pass by the gastrointestinal tract of infant pigs. Am J Physiol. 1996;270:E413–8. doi: 10.1152/ajpendo.1996.270.3.E413. [DOI] [PubMed] [Google Scholar]
- 29.Andres PG, Beck PL, Mizoguchi E, Mizoguchi A, Bhan AK, Dawson T, Kuziel WA, Maeda N, MacDermott RP, et al. Mice with a selective deletion of the CC chemokine receptors 5 or 2 are protected from dextran sodium sulfate-mediated colitis: lack of CC chemokine receptor 5 expression results in a NK1.1+ lymphocyte-associated Th2-type immune response in the intestine. J Immunol. 2000;164:6303–12. doi: 10.4049/jimmunol.164.12.6303. [DOI] [PubMed] [Google Scholar]
- 30.Velazquez OC, Zhou D, Seto RW, Jabbar A, Choi J, Lederer HM, Rombeau JL. In vivo crypt surface hyperproliferation is decreased by butyrate and increased by deoxycholate in normal rat colon: Associated in vivo effects on c-Fos and c-Jun expression. JPEN J Parenter Enteral Nutr. 1996;20:243–50. doi: 10.1177/0148607196020004243. [DOI] [PubMed] [Google Scholar]
- 31.Jetton TL, Liang Y, Cincotta AH. Systemic treatment with sympatholytic dopamine agonists improves aberrant beta-cell hyperplasia and GLUT2, glucokinase, and insulin immunoreactive levels in ob/ob mice. Metabolism. 2001;50:1377–84. doi: 10.1053/meta.2001.26741. [DOI] [PubMed] [Google Scholar]
- 32.Jetton TL, Lausier J, LaRock K, Trotman WE, Larmie B, Habibovic A, Peshavaria M, Leahy JL. Mechanisms of compensatory beta-cell growth in insulin-resistant rats: roles of Akt kinase. Diabetes. 2005;54:2294–304. doi: 10.2337/diabetes.54.8.2294. [DOI] [PubMed] [Google Scholar]
- 33.Potten CS. What is an apoptotic index measuring? A commentary. Br J Cancer. 1996;74:1743–8. doi: 10.1038/bjc.1996.624. [DOI] [PMC free article] [PubMed] [Google Scholar]
- 34.Hartmann B, Johnsen AH, Orskov C, Adelhorst K, Thim L, Holst JJ. Structure, measurement, and secretion of human glucagon-like peptide-2. Peptides. 2000;21:73–80. doi: 10.1016/s0196-9781(99)00176-x. [DOI] [PubMed] [Google Scholar]
- 35.Winer BJ, Brown DR, Michels KM. Statistical principles in experimental design. Boston: McGraw-Hill; 1991. [Google Scholar]
- 36.Littell RC, Henry PR, Ammerman CB. Statistical analysis of repeated measures data using SAS procedures. J Anim Sci. 1998;76:1216–31. doi: 10.2527/1998.7641216x. [DOI] [PubMed] [Google Scholar]
- 37.Kennelly JJ, Aherne FX, Sauer WC. Volatile fatty acid production in the hindgut of swine. Can J Anim Sci. 1981;61:349–61. [Google Scholar]
- 38.Sakata T, von Engelhardt W. Stimulatory effect of short chain fatty acids on epithelial cell proliferation in rat large intestine. Comp Biochem Physiol. 1983;74:459–62. doi: 10.1016/0300-9629(83)90631-x. [DOI] [PubMed] [Google Scholar]
- 39.Annison G, Illman RJ, Topping DL. Acetylated, propionylated or butyrylated starches raise large bowel short-chain fatty acids preferentially when fed to rats. J Nutr. 2003;133:3523–8. doi: 10.1093/jn/133.11.3523. [DOI] [PubMed] [Google Scholar]
- 40.Kien CL, Anderson AJ, Holcenberg JS. Tissue nitrogen-sparing effect of high protein diet in mice with or without ascites tumor treated with acinetobacter glutaminase-asparaginase. Cancer Res. 1985;45:4876–82. [PubMed] [Google Scholar]
- 41.Wallace FM, Mach AS, Keller AM, Lindsay JA. Evidence for clostridium perfringens enterotoxin (CPE) inducing a mitogenic and cytokine response in vitro and a cytokine response in vivo. Curr Microbiol. 1999;38:96–100. doi: 10.1007/s002849900410. [DOI] [PubMed] [Google Scholar]
- 42.Watanabe K, Uesaka H, Sato K, Yamaguchi T, Awaya J. Purification and biological properties of a cell growth-stimulating factor from clostridium perfringens FERM P-14028. Biochem Mol Biol Int. 1994;34:645–52. [PubMed] [Google Scholar]
- 43.Backhed F, Ding H, Wang T, Hooper LV, Koh GY, Nagy A, Semenkovich CF, Gordon JI. The gut microbiota as an environmental factor that regulates fat storage. Proc Natl Acad Sci USA. 2004;101:15718–23. doi: 10.1073/pnas.0407076101. [DOI] [PMC free article] [PubMed] [Google Scholar]
- 44.Samuel BS, Gordon JI. A humanized gnotobiotic mouse model of host-archaeal-bacterial mutualism. Proc Natl Acad Sci USA. 2006;103:10011–6. doi: 10.1073/pnas.0602187103. [DOI] [PMC free article] [PubMed] [Google Scholar]
- 45.Dumoulin V, Moro F, Barcelo A, Dakka T, Cuber JC. Peptide YY, glucagon-like peptide-1, and neurotensin responses to luminal factors in the isolated vascularly perfused rat ileum. Endocrinology. 1998;139:3780–6. doi: 10.1210/endo.139.9.6202. [DOI] [PubMed] [Google Scholar]
- 46.Shin ED, Estall JL, Izzo A, Drucker DJ, Brubaker PL. Mucosal adaptation to enteral nutrients is dependent on the physiologic actions of glucagon-like peptide-2 in mice. Gastroenterology. 2005;128:1340–53. doi: 10.1053/j.gastro.2005.02.033. [DOI] [PubMed] [Google Scholar]
- 47.Estall JL, Drucker DJ. Tales beyond the crypt: glucagon-like peptide-2 and cytoprotection in the intestinal mucosa. Endocrinology. 2005;146:19–21. doi: 10.1210/en.2004-1389. [DOI] [PubMed] [Google Scholar]
- 48.Petersen YM, Burrin DG, Sangild PT. GLP-2 has differential effects on small intestine growth and function in fetal and neonatal pigs. Am J Physiol Regul Integr Comp Physiol. 2001;281:R1986–93. doi: 10.1152/ajpregu.2001.281.6.R1986. [DOI] [PubMed] [Google Scholar]
- 49.Paris MC, Fuller PJ, Carstensen B, Nagy E, Taylor RG, Sourial M, Holst JJ, Hartmann B, Binesm JE. Plasma GLP-2 levels and intestinal markers in the juvenile pig during intestinal adaptation: effects of different diet regimens. Dig Dis Sci. 2004;49:1688–95. doi: 10.1023/b:ddas.0000043388.52260.2f. [DOI] [PubMed] [Google Scholar]
- 50.Small DM. The effects of glyceride structure on absorption and metabolism. Annu Rev Nutr. 1991;11:413–34. doi: 10.1146/annurev.nu.11.070191.002213. [DOI] [PubMed] [Google Scholar]