

Abstract
S-Nitrosothiol (SNO) cysteine modifications are regulated signaling reactions that dramatically affect, and are affected by, protein conformation. The lability of the S-NO bond can make SNO-modified proteins cumbersome to measure accurately. Here, we review methodologies for detecting SNO modifications in biology. There are three caveats. 1) Many assays for biological SNOs are used near the limit of detection: standard curves must be in the biologically relevant concentration range. 2) The assays that are most reliable are those that modify SNO protein or peptide chemistry the least. 3) Each result should be quantitatively validated using more than one assay. Improved assays are needed and are in development.
Keywords: Reviews, S-Nitrosoglutathione, S-Nitrosylation, S-Nitrosohemoglobin, Signaling, Cysteine
1. Introduction
Protein and peptide S-nitrosothiol (SNO) modifications can be thought of biological signaling reactions that have been proposed to be analogous to phosphorylation [1,2]. They are involved in virtually every class of cell signaling process and have a broad spectrum of effects in physiology. S-Nitrosylation of specific cysteine moieties is predicted by highly conserved amino acid consensus motifs in many proteins [1–4]. This signaling biochemistry is regulated by specific enzymes and by cellular compartmentalization [1–7]. It appears to be involved in most, but perhaps not directly in all [8], cGMP-independent signaling downstream from activation of nitric oxide (NO) synthases (NOS).
However, S-nitrosylation-based signaling reactions differ in important ways from phosphorylation reactions. NO can be released through homolytic cleavage or transferred as nitrosonium (NO+) between electronegative thiolate moieties [1–3,6,9]. Indeed, a change in protein conformation can dramatically change the stability or reactivity of specific protein S-NO bond, transferring or releasing an NO equivalent to signal a bioactivity. This lability of S-NO bonds often makes S-nitrosylated proteins substantially more cumbersome to identify and measure than phosphorylated proteins. In the following monograph, we will review currently available methodologies that are appropriate for detection and quantitation of SNO modifications in biology.
We begin with two vital caveats. First, many assay techniques for measuring biological SNOs are used near the limit of detection. Data derived from experimental conditions or using standard curves, in which SNO concentrations are 10–1,000 fold higher than those measured in biology, are both irrelevant and misleading [10,11,12]. It is mandatory to generate a standard curve using the specific SNO of interest in the biological range (usually 10 nM – 5 μM) [1,2,5,11–16].
Secondly, S-NO bonds are exquisitely sensitive to tertiary and quaternary changes in protein structure, as well as to changes in cellular protein location [1,5,7,16–24]. Modifications that are made between the time that the protein is being extracted from an intact cell and the time the S-NO bond is measured can dramatically affect results, particularly in the case of hemoglobin [18–20,24]. Therefore, a) preparations or assays that extensively modify protein chemistry as it relates to NO binding are likely to produce misleading results; b) in processing, relevant physiological parameters (such as pH and pO2) of the cell matrix should be preserved as much as possible; c) each assay should be quantitatively validated with other assays in the biological range; and d) several additional steps – beyond simple assay – should be taken definitively to demonstrate that an S-NO modification of a specific cysteine results in a specific biological effect [2,19,23,24]. These criteria are enumerated in Table 1 [21]. Assays that require pre-addition of nitrite-, metal- and thiol-chelating compounds should not be used as stand-alone determinations of biological SNO levels [24]; quantitative validation with an alternative method is required [23].
Table 1.
Criteria for establishing the biological relevance of an S-nitrosothiol modification.
|
From ref. 21, with permission.
This review will cover several different complementary types of SNO assays. These will include a) chemiluminescence-based assays in which an NO+ equivalent is reduced to NO − or NO is photolytically cleaved from the SNO − and then reacted anaerobically with ozone to release a photon; b) colorimetric assays in which NO, oxidized to nitrite, is assayed using spectrophotometry; c) similar assays using fluorescence-based detection of released NO+; d) assays using antibodies directed against S-nitroso-cysteine (CSNO); e) assays based on replacement of the thiolate-bound NO+ group with biotin; and f) assays based on direct mass spectrometric identification of the SNO containing species. Most of these assays are coupled with specific systems for removing or substituting the NO group (outlined below) and/or with systems for SNO separation by chromatography, immunoprecipitation or electrophoresis. Each system has specific strengths and weaknesses as outlined in Table 2. Of note, each of these assays requires careful use of standards. Certain high-quality standards – such as S-nitrosoglutathione (GSNO) – are commercially available. Others, including S-NO modified L- and D-isomers of cysteine, 15NO+ modified species and S-NO proteins [25], will need to be synthesized. Protocols for SNO synthesis and characterization have been extensively detailed elsewhere [25–27] and are not the subject of this paper. It is important to emphasize, however, that 1) the standard must be prepared under conditions that do not distort the conformation of the protein being assayed [24,25]; and 2) the concentration of the standard itself should be validated using at least two complementary assays across a concentration range relevant to the unknown to be assayed [23,27]. The standard should ideally be the molecule being assayed [25]. This can require iterative discovery.
Table 2.
Comparison of common S-nitrosothiol assay techniques
| Method/Reference | Principle | Detection Limit | Selectivity | Advantage | Caveats |
|---|---|---|---|---|---|
| Photolysis-Chemiluminescence [18, 19, 24, 31] | Photoexcitation induced homololytic cleavage of S-NO | Low pmol-range amount | Fe nitrosyls also detected | Sensitive | False positive possible under some circumstances if: - λ < 300 nm - coil overheats
Highly sensitive and efficient equipment must be custom-made and is expensive |
| Reductive Chemiluminescence (CuCl, cysteine) [5,11,14, 32] | Selective reduction of S-NO | Low pmol-range amount | SNO selective | Specific and sensitive | Nitrite artifact at low pH
Severe signal attenuation if heme in sample – requires addition of CO to gas stream |
| Indirect assay via nitrite quantification- KI chemiluminescence [20, 24, 32] | Conversion of thiol bound NO to NO+, detected as nitrite after reduction in KI in acid | Low pmol-range amount | Detects nitrite | Simple | Requires modification of the sample that alters the SNO bond; makes NOI. Iodide methods should never be used as stand-alone assays |
| - Saville (colorimetric) [9,13] | As above, but SNO generated NO+ detected via Griess reagent | 500 nM | SNO selection | Simple, inexpensive | Insensitive |
| DAF-based fluorescence [14,49] | Conversion of DAF to fluorescent DAF-2T by NO+ | Low nM Low μM, if gel-based | Variable | High-throughput capability | SNO quantified as gain of signal in paired samples +/− HgCl2 |
| Mass spectrometry[16,25,29,38,41,42], | Selective monitoring of appropriate m/z | Instrument specific: generally ~ 200 nM solutions | Gold standard | Gold standard | LC separation phase must be designed to so as to limit loss or gain of S-NO bonds; alternatively, thiol-bound NO groups may be switched
Requires internal standards labeled with 15N |
2. Chemiluminescence-based assays
All chemiluminescent detectors utilize the same basic principle, namely that NO reacts with ozone to generate NO2* which decays back to NO2 releasing light. This reaction occurs in the gas phase and is critically dependent upon the rate of mixing of NO and ozone. It is essential that the two reactants be mixed in equal proportion as an excess of either leads to damping of the luminescence [28]. A variety of instruments are available to measure the generated luminescence, however, all are dependent upon equal mixing of the test gas flow with the ozone and the efficiency of the photomultiplier used to measure the generated light. These two factors determine the quantum yield generated within the test chamber and hence the sensitivity of the instrument. The usage of these instruments for the measurement of NO and its metabolites within liquid samples thus relies upon the competence with which NO is released to the gas phase and how dry that gas stream can be maintained. There are two basic methodologies by which NO equivalents can be released into the gas phase, photolysis and chemical reduction; both must be performed in the presence of an inert gas stream to remove released NO to the chemiluminescent analyzer. The efficiency of this transfer to the gas phase is critical to sensitivity.
2.1. Photolysis-chemiluminescence
The S-N bond of nitrosothiols is sensitive to homolytic cleavage following exposure to light of the appropriate wavelength. Following light exposure an activated S-nitrosothiol (RS-NO) is formed which can decay to free NO and a RS radical either directly or via a caged intermediate [28]. These products can recombine to reform nitrosothiol or the RS radical can react with another thiol-containing compound to generate a disulfide. In the case of another nitrosothiol this would result in further NO release. As a result of potential side reactions it is critically important that following photolysis the NO is purged in the inert gas stream. Practically, this is best achieved by injecting the liquid sample to an inert gas and buffer stream that is passed through the photolysis unit; the liquid portion is then extracted by successive cold traps.
S-Nitrosothiols possess two significant absorption maxima, one in the 300–350 nm range, and one in the 530–560 nm range [27–30]. The first of these is associated with the nO → π* transition, while the second is associated with the nN excitation. Promoting the nO → π* transition is associated with acceleration of the S-N bond cleavage and thus for analysis, irradiation in the 300–350 nm range is utilized. Of note is the fact that different SNOs have different absorption maxima within the ranges noted above depending on other interacting groups within the molecule [27,28,30]. In these experiments nitrite contamination can result in NO release, either through reaction with thiols in the sample if the pH is allowed to fall, or directly through photolytic cleavage if light of below 300 nm wavelength is used. Therefore, in order to achieve maximum S-N cleavage while avoiding potential confounders, out experience suggests that it is best to use a broad spectrum lamp but ensure that the irradiating light does not span to lower than 300 nm. In addition, the lamp wattage should not exceed 100 W as heat generated from the lamp can result in spurious signal. Any photolysis system should be checked to ensure that the appropriate photolytic yield is achieved: sensitivity should normally be in the low nM-range. In general, the yield of the commercial photolysis-chemiluminescence system (Nitrolite) for GSNO is 99–100%. Specificity should be confirmed by using pre- and post-HgCl2 measurements [28–32]. The detection limit is that of the chemiluminescence system (~5 pmol) and the assay is highly reproducible [9,33]. Different systems produce similar results in blood, airway lining fluid and cell-fraction precipitates [5,28–30]. Note also that predictions regarding SNO formation from NO3− [34] in photolysis systems have been made on the basis of assumptions about the light intensity, source distance and duration of exposure that are not relevant to the conventional instruments; therefore, NO3− control injections do not give a signal in the presence of thiol ([13,33] and B.G., unpublished observations).
2.2. Anaerobic reductive chemiluminescence using transnitrosation to cysteine to form S-nitrosocysteine (CSNO), followed by CuCl-mediated CSNO reduction to NO
In this assay, excess cysteine serves to drive the transnitrosation equilibrium in favor of CSNO and reduce Cu2+ to Cu+. This assay can be used in intact cells (injected directly into the reflux chamber), in following with immunoprecipitation, or in tandem with HPLC [5,14,32]. In general, the detection limit for the reductive-chemiluminescence assays discussed in the next three sections is that of the NO detector – conventionally, 5–10 pmol, and the coefficient of variation is ≤ 5% [5,13,29].
Reductive SNO assays are carried out under He or Ar in a purge vessel containing 1 mM cysteine and 100 μM CuCl (saturated in ultrapure water), pH 7.0, 50°C [29]. The pH of the stock CuCl/cysteine solution should be checked regularly; in our experience, it falls significantly with time. Note that excess HgCl2 added to cysteine will also cause pH to fall; pH should be checked if HgCl2 is added to samples as a control (to ablate the SNO signal), because, at low pH, NO2− can give a false positive signal. Pure water and a NO2− (~ 10 μM) standard should be injected before each experiment as controls to be certain that there is no signal.
High-pressure liquid chromatography
In tandem with this reduction assay, low-mass SNOs can be separated by reverse-phase HPLC on a C-18 column (mobile phase: 20% methanol, 80% PBS, with 1 mM 1-octanesulfonic acid, pH 2.2) at 1 ml/min (Beckman System Gold; San Ramon, CA) [32]. Peaks are monitored spectrophotometrically at 220 nm, and the eluate collected at one minute intervals for CuCl/cysteine reduction assay as above (Fig. 1). The assay has been performed on biological samples, revealing concentrations in the high nM-low μM range [32,33]; additionally, it is critical to show that the signal can be eliminated (ideally by pre-treatment with photolysis) and to confirm with a complementary assay (Table 1). It is important to perform a control experiment in which the injection is spiked with reduced thiol to be certain that SNO is not formed artifactually from NO2− on column; additionally, it is important to show that the signal is ablated in samples pre-treated with photolysis [5] and to confirm the measurement with a complementary assay [23]. Alternatively, a neutral pH mobile phase containing an ion-pairing agent such as tetrabutylammoniumhydrogen sulfate can be used [34].
Fig. 1.
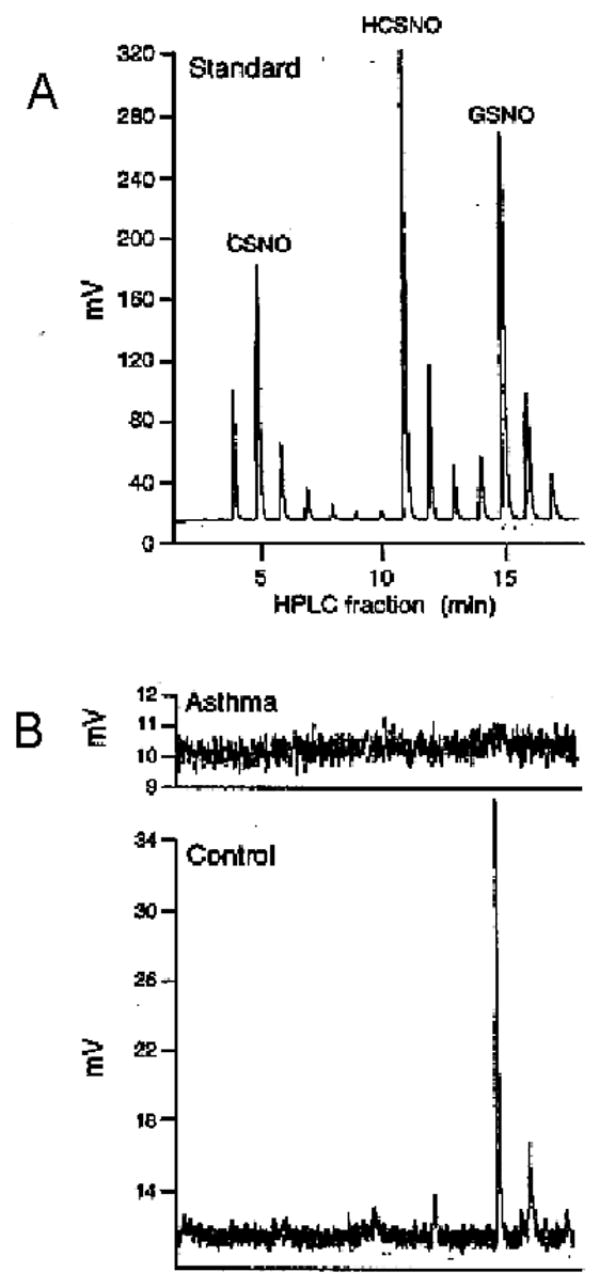
S-Nitrosothiols characterization by HPLC coupled with CuCl/cysteine (CSH) assay. (A) (Bottom) S-Nitrosocysteine, S-nitrosoglutathione (GSNO) and S-nitrosohomocysteine (HCSNO) (synthetic; 10 μM each) were separated by reverse-phase HPLC on a C18 column (mobile phase: 20 vol.% methanol, 80 vol.% PBS, 1 mM 1-octanesulfonic acid, pH 2.2, flow rate 1 ml/min). Samples eluted from the columns after injection of a mixture of the 3 compounds were collected at 1-min intervals. Each sample was injected into the CuCl/CSH assay. The eluate collected at these intervals was assayed by CuCl/CSH. Maximum elution times for mixed SNOs corresponded to elution time for each SNO assayed individually. The chemiluminescent SNO signal is shown as a function of time, with injections at one minute intervals. Each one minute interval injection contains S-nitrosothiols that are either a mixture in the gradient shoulder of the adjacent peak (in the troughs) or represent lower amplitude signal of pure S-nitrosothiol that is identical to the adjacent peak. (B) Representative injections from the airway lining fluid of a patient with asthma (top) and a control subject (middle) showing GSNO is present in the normal airway that is absent in asthma, as reported in ref. [33].
Protein immunoprecipitation
Before the reduction assay described above, proteins can be immunoprecipitated; equal concentrations of isotype-matched antibody are used as a negative control [5,35]. SDS-PAGE/silver staining and/or immunostaining systems are used to confirm that the only protein brought down in detectable amounts is or UV light to the protein of interest. Treatment of the immunoprecipitates with HgCl2 remove the NO+/NO group before injection into the reductive assay must also be used as an additional control [5] (Fig. 2). If there is concern that removal of the protein from the immunoprecipitation beads will alter the pH or otherwise disturb (create or destroy) S-NO bonds, the whole washed bead preparation can be injected into the reflux chamber; however, control injections with the beads alone should then be done to be certain there is no intrinsic signal [5]. In these immunoprecipitation experiments, it is critical to study proteins in which the candidate cysteine has been mutated, in cells in which relevant NOS isoforms are inactive/inhibited, and in samples pre-treated with light or HgCl2 as controls (see Table 1 and refs. [ 5,23,31,35]). These highly reproducible assays generally reveal concentrations of specific SNO-proteins in specific cell compartments – such as caspase-3 and caspase-9 in the mitochondrial intramembrane space – in the mid nM-range [5,31].
Fig. 2.
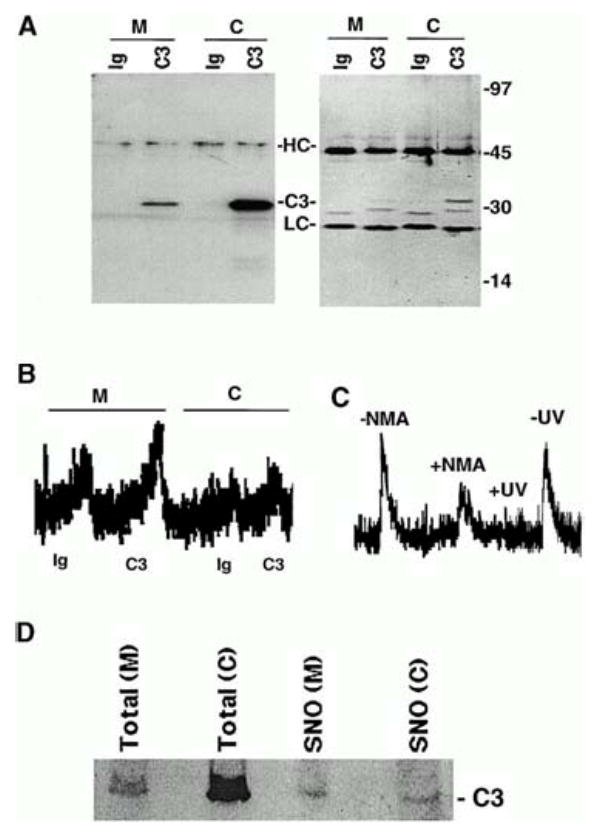
S-Nitrosylation of mitochondrial and cytoplasmic caspase-3. (A) Caspase-3 immunoprecipitation (IP). Proteins were IP’ed from mitochondrial (M) and cytoplasmic (C) cellular fractions using a caspase-3–specific monoclonal antibody (C3) or equal concentrations of an isotype-matched control antibody (Ig). IP’ed proteins were visualized on silver-stained gels (right) or caspase-3 Western blot analysis (left). Molecular weight markers, immunoglobulin heavy chain (HC), light chain (LC), and caspase-3 (C3) are shown. (B) S-Nitrosylation of caspase-3. The SNO-derived chemiluminescence signal of Ig control (Ig) and caspase-3 (C3) IP’s obtained from mitochondrial (M) and cytoplasmic (C) fractions of 10C9 cells are shown. NO chemiluminescence in arbitrary units is on the y-axis, and time is on the x-axis. The NO released from each sample is proportional to the area under the curve. The data are representative of 10 experiments. (C) Caspase-3 is S-nitrosylated endogenously. The SNO-derived chemiluminescence signal of mitochondrial caspase-3 IP’s from CEM cells after they had been grown for 48 h in the presence (+NMA) or absence (−NMA) of 4.5 mM NG-monomethyl-L-arginine (L-NMA) is shown. The data are representative of 2 experiments. Mitochondrial caspase-3 IP’s from control cells were divided into two samples, one of which was exposed to UV light for 10 min (+UV) and the other left untreated in the dark at room temperature for the same period (−UV). The SNO-derived chemiluminescence signal from UV-treated and UV-untreated samples is shown. The data are representative of 4 experiments. (D) A higher percentage of mitochondrial than cytoplasmic caspase-3 is S-nitrosylated. S-Nitrosylated proteins in cytoplasmic (C) and mitochondrial (M) fractions were selectively labeled with biotin and then purified over streptavidin-agarose as described previously [29]. The purified S-nitrosylated proteins were then analyzed by caspase-3 Western blot analysis. 1% of the total protein in the mitochondrial or cytoplasmic starting sample (16 μg) was loaded in the lanes (“Total”). Purified S-nitrosylated proteins obtained from each fraction were loaded in the lanes labeled SNO. Caspase-3 (C3) is indicated. From ref. [5], with permission.
2.3. Reduction in CO-saturated Cu–cysteine (CO/Cu/Cys): Chemiluminescence assay for SNO bonds in heme-containing proteins
SNOs are selectively assayed in a CuCl-saturated, 1 mM cysteine (Cys) containing solution (pH 7) using chemiluminescence as above, modified by adding carbon monoxide (CO) to the inert gas flow through the reflux chamber, preventing NO autocapture by heme groups [14] (Fig. 3). Note that metal carbonyls (0.7 ppm in research grade CO) must be removed, as both Ni- and Fe-carbonyls chemiluminescence in the presence of O3. Therefore, the CO source gas is passed through iodine crystals and (in series) activated charcoal, blended with the He stream in a gas proportioner (Aalborg, Orangeburg, NY) [14,37]. Note that (i) oxidized Cys should be replaced, and residual Hb removed, by refreshing the reflux chamber after each sample injection; and (ii) Nonidet P-40 and Triton X-100 used to lyse cell membranes both produce artifactual signal with this assay [14]. Additionally, headspace pressure determines CO partial pressure in the aqueous reactant matrix – this pressure should be monitored and maintained at 100–200 Torr greater than atmospheric. As a cautionary note, several chemiluminescent NO analyzers utilize hopcalite in their ozone scavenging system. The reaction between hopcalite and CO is exothermic and may produce heat sufficient to melt or ignite an ozone scavenging cassette. Hopcalite traps should not be used in conjunction with the copper/cysteine/CO assay (i.e., the “3C” assay): the extract should be vented to an optimally functioning fume hood. Additionally, it is mandatory to 1) have an environmental CO alarm to warn investigators of a CO leak in the system; 2) have tight couplings at all points in the circuit; and 3) stop CO gas flow and flush the system with inert gas before opening any part of the system to the atmosphere [14]. Again, we would emphasize the importance of not modifying the erythrocytic hemoglobin in its in vivo environment before performing the assay [14, 38–40]. Ultimately, it will be valuable to trap Hb reactants in intact erythrocytes using transnitrosation reactions: these sorts of mass spectrometric methods [38,41–44] will be discussed in more detail below.
Fig. 3.
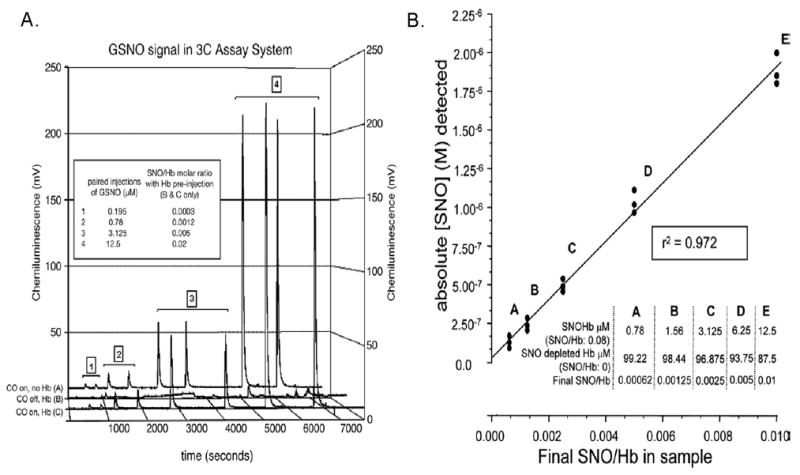
Reductive-chemiluminescence in the presence of CO allows measurement of SNOs in the presence of human hemoglobin. (A) Chemiluminescence signal after assay in 3C for paired injections, as indicated, of a GSNO dilution series (without CO) (series A), or the same injections of GSNO as for series A after preinjection of NO-depleted Hb into the reflux chamber (series B). The mixture of Hb and GSNO in the reflux chamber simulates the noted SNO/Hbs; the signal for GSNO is lost, presumably to capture of NO by heme Fe. (series C) The signal for GSNO as in series A returns after adding carbonyl-purged CO to the inert gas stream, resolving the signal attenuation shown in series B. (B) Detection (3C assay) of SNO is linear over varying SNO/Hb ratios. SNO/Hb was varied systematically by dilution of SNOHb into Hb, as noted in Inset. Absolute SNO detected is plotted against final SNO concentration/Hb in the sample mixtures. Since the concentration of Hb in the sample mixtures was fixed, this plot demonstrates linear assay fidelity for a series of known SNO injections across a range of SNO/Hb (0.01 – 0.00062). From ref. [13], with permission.
Note that this 3C assay has been used to measure the SNO content of intact, human erythrocytes [14]. This is important because any modification of erythrocytic hemoglobin – even removing it from the erythrocyte – can alter protein allostery and, therefore, alter the distribution of NO-Hb species and the concentration of SNO-Hb [14, 19, 24, 39, 40, 43]. This assay does not detect nitrite [14,32]. Human arterial SNO/Hb molar ratios are ~ 3 × 10⁻⁴; venous levels are less [14]. Levels are higher in human septic shock [14].
2.4. Nitrite assay in potassium iodine following HgCl2-mediated displacement of NO+ from RSNO
Reduction is performed in a He or Ar stream using a fitted purge vessel containing 1 wt.% KI solution (in glacial acetic acid) (conventionally, the NOA 280: Sievers Instruments; Boulder, CO); NO is measured continuously by chemiluminescence. The procedure is repeated following pretreatment with excess HgCl2 in biological samples and the SNO dependent signal is calculated as the difference between the augmented signal with HgCl2 to the baseline signal without HgCl2 [5]. For higher SNO concentrations, it is wise to repeat the assay with a doubled concentration of HgCl2 to be certain that there is no further signal alteration. This will result in artifactual detection of NO2−. Note that the sample should not be pre-treated with acidified sulfanilamide to remove NO2−, because this creates competing reactions that can both distort the conformation of the protein being studied and create and destroy SNO bonds artifactually [24]. This assay can be adapted for use in tandem with HPLC, as with the CuCl/Cys assay. Note that reduction with iodide (I−) – even in the absence of I2 – has the potential to produce artifactually the potent nitrosative agent, NOI, which can dramatically distort results [24]. This is particularly an issue when studying hemoglobin [19, 24,39, 40] and could, along with issues of pre-treatment artifact, possibly account for discrepancies between iodine-based SNO-hemoglobin assays and all other SNO-hemoglobin assays [12, 24]. Therefore, assays containing iodide should be considered complementary at best; generally, they should be avoided. Indeed, accumulating evidence suggests that the use of these iodine-based assays has led to unnecessary controversy in the field of hemoglobin S-nitrosylation biology [2,11,14,17,18,17–21,24].
3. Colorimetry-based assay, or “the Saville assay”
Colorimetric assays for SNO bonds are generally unsatisfactory for biological SNOs because the limit of defection (approximately 500 nM) is ordinarily close to biological concentrations [16,24,26]. HgCl2 displacement of NO+ can be used followed colorimetric (Griess reagents) determination of the NO2− concentration: as with the chemiluminescence-based assay (above), the difference between NO2− concentrations with and without addition of HgCl2 is taken as the concentration of SNO (Fig. 4) [12,13]. The Saville reaction yields highly reproducible SNO signals in the presence of 10–60 (Fig. 4)[13]. Sulfanilamide [SA; 3.4% (wt./vol.)] in 0.4 M HCl is fold excess NO2− 0.1% (wt./vol.) of N-(1-prepared with and without 1% (wt./vol.) HgCl2, as isnaphthyl)ethylenediamine (NED). Standard (or sample) is mixed with SA with or without and then reacted with NED. The concentration of SNO is determined from the HgCl2 difference in absorbance at 540 nm. This assay has a limit of detection of approximately 500 nM and is, therefore, generally not useful for assay of many biological SNOs [5,14,31].
Fig. 4.
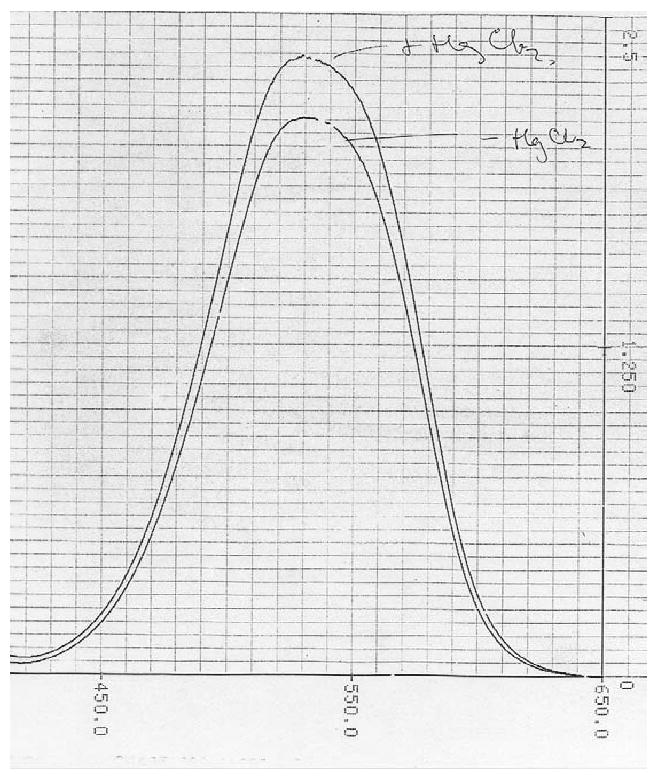
Colorimetric assay of SNOs in the presence of excess nitrite in airway living fluid. Raw chromatogram of the first Saville assay performed in human bronchoalveolar lavage fluid: this sample was from a patient with pneumonia. The total S-nitrosothiol content (“⊕HgCl2” minus “⊖ HgCl2”) was about 10% that of the nitrite concentration (⊖HgCl2 alone). Note that, though S-nitrosothiol/nitrite ratios 1/2 to 1/5 this magnitude are readily detected, lower S-nitrosothiol levels (particularly < 500 nM) are difficult to distinguish from background nitrite. Therefore, this assay is complementary, at best, for most biological samples.
4. Assays based on mass spectrometry
4.1. Intact SNO species can be measured by MS as long as the preparatory phase preserves the S-NO bond
In particular, this requires that the liquid chromatography (LC) phase be in relatively rapid, cool, and inert solvent. If the solvent is acid, it is particularly important to do controls in which the corresponding reduced thiol is injected, to be certain that there is not artifactual formation of the SNOs from nitrite on the column. Matched S-nitrosothiol standards using RS-15NO (as well as 15NO2− controls) are critical for internal controls (in which the sample is spiked) [16,25,29,38,41,42].
Example: LC-MS analysis for GSNO in a biological sample
Biological samples eluted isocratically (90 vol.% of 0.1% formic acid, 10 vol.% methanol, 1.5 ml/min) over a C18 column (such as Waters Symmetry 7.8 × 150 mm) are collected, lyophilized and reconstituted [40]. Because the pH of this mobile phase is 2, it is critical to perform a control experiment in which the corresponding reduced thiol is added to the reconstituted mixture to be sure the signal does not increase. Use of photolysis and/or HgCl2 pre-treatment represent mandatory experiments. Eluted samples are injected onto a C18 microbore column (1.0 × 150 mm) and analyzed by electrospray ionization MS (for example, using a Finnigan LCQ Duo system). GSNO cations are monitored by selective ion monitoring at a mass-to-charge ratio (m/z) of 336.9 (Fig. 5). Other SNOs can be similarly measured at appropriate m/z values. For MS/MS fragmentation in tandem MS, GSNO cations are dissociated in the ion trap, and the product ions are monitored within a m/z range of 90 350. GS15NO (or corresponding RS-15NO) is used as a positive control and internal standard for quantitation. In our experience, this assay is reasonable for quantitation of SNOs in biological solutions with a limit of detection of ~ 200 nM [43].
Fig. 5.
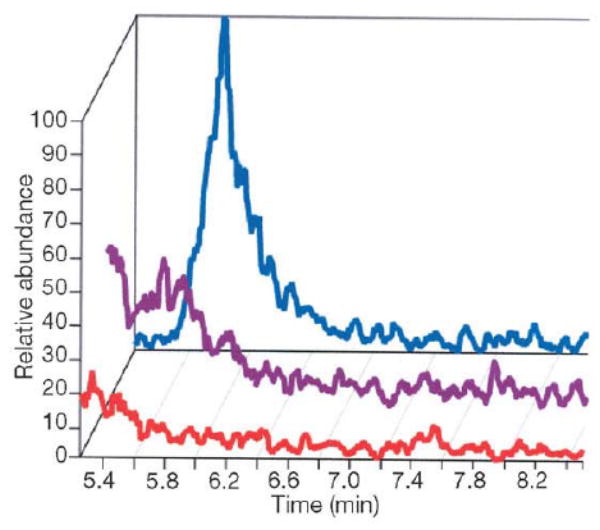
LC-MS was performed on plasma from blood that was reacted immediately ex vivo (under physiological conditions) with 400 μM GSH that had been pre-treated in 1:1000 volume of phosphate buffered saline in a heparinized phlebotomy syringe to determine whether there was a difference between oxygenated and deoxygenated blood with regard to NO+ transfer to GSH. Deoxygenated blood was maintained under argon and oxygenated blood in room air. Samples underwent centrifugation to remove the cellular fraction, then ultracentrifugation (10 kDa cutoff). The filtrate underwent LC-MS as described in the text. GSNO eluted at 5.82 min, m/z = 336.9 in positive ion mode. The GS15NO peak in the deoxygenated blood-derived plasma (top) was attenuated after ultraviolet treatment (middle) and is not evident in the oxygenated blood-derived plasma (bottom). Positive identification of the GSNO peak was determined by co-elution of the sample with a GSNO standard. Also, retention time and both MS and MS/MS spectra of the endogenous species were identical to exogenous GSNO plus the endogenous species. These observations demonstrate that deoxygenated blood reacts with reduced thiol species to form ultraviolet-labile SNO species, whereas oxygenated blood does not. Transfer intermediated from deoxyhemoglobin are possible. From ref. [38], with permission.
4.2. Mass spectrometry can be used to identify SNO modified proteins in which the SNO bond is replaced by biotin substitution according to the method of Jaffrey or modifications of this method
S-Nitrosylated proteins can be isolated from cell extracts by the biotin substitution method of Jaffrey et al. [44]. Thiols are blocked using an alkylating agent, such as methyl methanethiosulfanate, then SNO bonds are reduced using 1 mM ascorbate. Newly reduced thiols are biotinylated using N-[6-biotinamido)hexyl]-3′-(2′-pyridyldithio)propionamide (biotin-HPDP). Biotinylated proteins are then purified using streptavidin-agarose beads and eluted with β-mercaptoethanol. This ascorbate-mediated reduction may be inefficient for SNO-albumin and, perhaps, other proteins [39]; alternative reducing agents, such as DTT, may be used. However, DTT can, like all other preparatory steps, have undesirable consequences such as reduction of NO+ to NO− [9]. Note that this assay may be somewhat insensitive and non-specific for particular proteins which may be related to the slow time course of the recovery step [46] and the general caveat that the more in vitro preparatory steps involved before the defection step for an SNO bond, the less reliable the yield [46,47]. Once isolated, protein samples are dissolved in 100 mM ammonium acetate buffer (pH 8.9) and digested with trypsin (protein:trypsin molar ratio ca. 20:1) at 37°C overnight [32]. Approximately 1 μg of digested protein is loaded onto a 10-cm C18 column 360-μm o.d. × 100-μm i.d. fused silica (Polymicro Technologies, Phoenix, AZ) precolumn. This column is washed with 0.1% acetic acid and then butt-connected with a Teflon sleeve to a 10-cm long self-packed C18 (5 μm YMC ODS-AQ) 360-μm o.d. × 50-μm i.d. analytical column with a pulled nanospray tip (1–2 μm orifice). Peptides are eluted using a HPLC apparatus (Agilent 1100, Agilent Technologies, Palo Alto, CA) and a binary solvent gradient (solvent A: 0.1 vol.% acetic acid and B: 0.1 vol.% acetic acid - 70 vol.% acetonitrile) of 0–60% B (80 min) and 60–100%B (10 min). The eluted peptides are electrosprayed into an LTQ linear quadruple ion trap mass spectrometer at 50–100 nl/min. The LTQ is operated with a top 10 data-dependent analysis method consisting of a repeated data acquisition full mass spectrum cycle (m/z 300–2000) followed by MS/MS spectra corresponding to fragmentation mass spectra of the 10 most abundant ions from the MS. For peptide identification, the MS/MS spectra are searched with appropriate algorithms against non-species-specific protein databases [35].
4.3. Further mass spectrometry-based methods
S-Nitrosoalbumin has been determined quantitatively in human plasma by GC-MS-based methodologies [16,25,29,41]. These methods are based on the use of 15N-labelled S-nitrosoalbumin as the internal standard, affinity chromatography extraction of endogenous and of the externally added 15N-labelled S-nitrosoalbumin from plasma, the conversion of the S-nitroso groups into nitrite and 15N-labelled nitrite by HgCl2 [16,25,29]) and on the final GC-MS detection of unlabeled and 15N-labelled nitrite as pentafluorobenzyl derivatives by GC-MS. These GC-MS methods have been thoroughly validated [16,41]. Measurement by these GC-MS methods of S-nitrosoalbumin in plasma of healthy humans at the basal state revealed concentrations of the order of 150 to 200 nM with high precision (RSD < 11 %) and accuracy (recovery, 93 – 104%) in quality control samples [16,41].
Pre-analytical factors such as anticoagulants, which may influence the stability of S-nitrosoalbumin, were found not to affect quantification of S-nitrosoalbumin in human plasma by these methods. When plasma is generated immediately after blood taking under mild conditions (e.g. centrifugation at 4 °C, 1000 ×g, 10 min) the concentration of S-nitrosoalbumin in the native, untreated plasma does not change until sample treatment. The lowest concentration of S-[15N]nitrosoalbumin that could be detected by GC-MS as pentafluorobenzyl derivative of [15N]nitrite was 0.2 nM, which corresponds to an injected amount of 67 amol of S-[15N]nitroso groups [16]. Modification of the above mentioned GC-MS methods including HPLC separation allows for specific measurement of CSNO and GSNO [42].
In principle, derivatized S-nitrosothiols such as GSNO can be analyzed by LC-MS and LC-MS/MS [15]. However, the utility of these MS-based techniques for the quantitative determination of endogenous S-nitrosothiols in the circulation or in the urine of humans has not been demonstrated thus far.
5. Assays based on fluorescent labeling
5.1. 4,5-Diaminofluorescein (DAF-2) fluorescence assay
An assay for biological SNOs using transfer of NO+ equivalents to DAF-2 (Calbiochem) to yield a fluorescent triazolofluorescein (DAF-2T; excitation and emission, 485 and 520 nm) [48] can be adapted for detection of SNO proteins [14,49]. Isolated protein in 10 mM PBS (pH and 7.4), are incubated (10 min) with and without HgCl2 treated with acid (0.4 M HCl, final). The Hg2+ must be in significant molar excess to protein due to chelation of Hg2+ by non-SNO sites on proteins; moreover, in our alters the background DAF fluorescence [14], Hg2+ must be held experience HgCl2constant between wells by addition to the control wells following filtration. It is also possible to achieve transfer of NO+ equivalents from SNOs to DAF using high intensity UV light (310 –340 nm, ~ 5 min), CuCl, or CuSO4. In samples with complex protein mixtures (or with ion chelators in the buffer) Cu ions may be bound as well – limiting SNO decomposition to form DAF-2T. Pilot work exploring the optimum concentration of Cu+ or Hg2+ ions is required in this case. After conversion of the SNO to NO2−, proteins, which can cause background fluorescence or absorption, are excluded by filtration (10-kDa filters, spun at 10,600 × g for 20 min; Centricon). We typically mix filtrates with 150 μM DAF-2 (in 10 mM PBS, pH 7.4); however, care must be taken to maintain the ratio of DAF: estimated RSNO ≥ 10:1 after mixing. Moreover, the final pH of the mixture must remain low to maintain nitrosating equivalents for efficient triazole formation, thus if S-N cleavage has been achieved in the absence of acid (e.g. via UV light, rather than via HgCl) it must be added at this point (0.4 M HCl, final). Samples should be read in black microplates; DAF-2T, now formed, will fluoresce optimally after a last titration to pH 8 (NaOH) [14]. Plates are read in an FlX-800 fluorimeter and compared with synthetic DAF-2T (Calbiochem) and SNO protein standards or low mass SNO (e.g. GSNO) standards. These assays have been performed on biological samples [13,42] confirming hemoglobin S-nitrosylation and its allosteric regulation [14,49].
5.2. DAF-based development in conjunction with gel electrophoresis
Gradient gels are prerun for 30 min at 30 mA/gel in standard SDS–PAGE running buffer containing 1 mM EDTA prior to sample loading as described [50]. Ten μl of each sample (normally 20–30 μg of cell lysate) is diluted 1:1 (v/v) in non-reducing sample buffer (22% glycerol, 138 mM Tris, pH 6.8, 1% SDS) and loaded. It is important not to use reducing agents from the loading buffer to prevent reduction of S-NO bonds. 100 μM N-ethylmaleimide (NEM) can be added to block thiols, preventing transnitrosation reactions, if protein extraction or processing are slow [31]. However, it is generally best to minimize “blocking reactions” in SNO assays [24]. Gels are run at 15 A/gel, are removed from their glass plates and are rinsed with 1 mM EDTA in water. Gels are evenly coated with 0.5 ml of DAF-2 (40 μM) or DAF-FM (28 μM) in deionized water and incubated in the dark for 10 min. This assay requires less DAF-FM than of DAF-2 because DAF-FM is a more sensitive NO probe. The gel is exposed to UV light (312 nm) for 5 min in a Multimage Light Cabinet, photolytically cleaving NO groups from S-nitroso, N-nitroso, and O-nitroso compounds as well as from metal nitrosyls. The optimal wavelength for photolysis of S-nitrosylated albumin is 310 nm and 330–340 nm for GSNO. After UV light exposure, the gel is imaged either using the fluorescence mode of an Intelligent Dark Box II or a fluorimager with an excitation wavelength of 488 nm and an emission wavelength of 530 nm. They can also be imaged with a conventional UV transilluminator gel dock, although the sensitivity is lower (Fig. 5). Like the Saville assay, the DAF-based gel assay may not be sensitive enough to detect many biological SNOs that are present in biological samples at concentrations below 3 μM because the assay does not detect S-nitroso bovine serum albumin at concentrations below 3 μM.
6. Assays based on immunoblotting
6.1. S-NO protein isolation by biotin substitution followed by immunoblotting
Immunoblotting can be performed in place of MS analyses following isolation of SNO-modified proteins according to the method of Jaffrey (Fig. 2) [5,35,43,44].
6.2. Use of anti-S-nitrosocysteine antibody for immunohistochemistry
Both polyclonal and monoclonal antibodies have been isolated towards the SNO moiety [51,52]. These antibodies have demonstrated their greatest usefulness in immunohistochemical detection of SNO-proteins (Fig. 7). In principle their usage is not significantly different from other antibodies within immunohistochemical applications. However, the most important caveat in their usage is the need for positive and negative controls. Therefore, in most tissue-based applications SNO-antibody staining is conducted on serial sections in which the test section is flanked by both a positive and a negative control. In general the most effective positive control is chemical nitrosation using added nitrite in 0.4 M HCl. Although inorganic HgCl2 can be used as a negative control it is not always completely efficient at cleaving S-N bonds in situ. Therefore, it is advised to use treatment with an organic mercury compound, such as p-chloromercuribenzoate, as the negative control. Anti-S-nitrosocysteine does not immunostain reduced cysteines [51]. If visible staining in the test section cannot be visibly reduced in the negative control then it cannot be assigned as SNO detection, as there is (limited) cross-reactivity of these antibodies with other nitroso compounds.
Fig. 7.
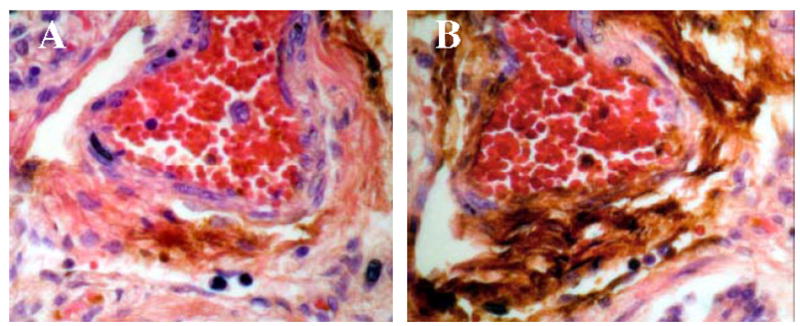
DAB Staining for SNO. A large blood vessel is shown within neonatal human lung tissue, extensive staining can be seen in the adventia and endothelium of the blood vessel (panel B). This staining is dramatically reduced by p-hydroxymercuribenzoate (pHMB) treatment (panel A).
7. Conclusion
Each of these assay techniques has its unique strengths and weaknesses (Table 2). Until more robust, universally applicable systems are available, several different, complementary assays should ordinarily be used, in conjunction with site-directed mutagenesis and biochemical and pharmacological characterization, to determine definitively whether an S-NO signaling process is relevant to a particular function in cell biology or physiology. These criteria have already been met adequately to demonstrate the relevance of S-NO signaling to a broad range of functions, ranging from Fas ligand- signaled caspase-3 activation [5,31] to iNOS-induced cyclooxygenase activation [7]. The rough outlines of a complex and previously unrecognized system of biochemical signaling can be seen using the relatively cumbersome techniques currently available. As the techniques improve, S-nitrosylation signaling will be more easily studied.
Fig. 6.
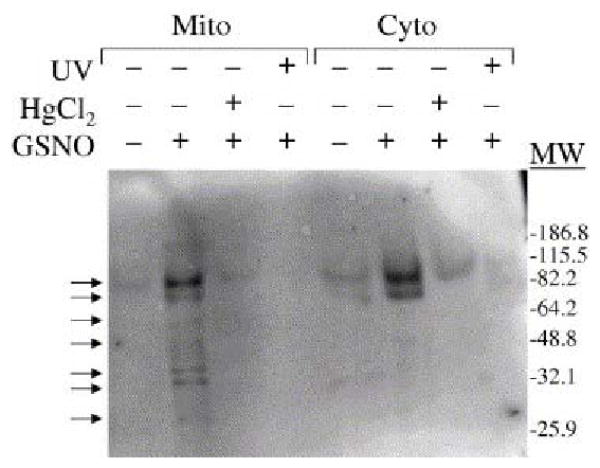
GSNO transnitrosylates more proteins in mitochondrial extracts than in cytoplasmic extracts. Equal concentrations (2–3 μg/μl) of mitochondrial and cytoplasmic lysates from PC12 cells treated with GSNO (300 μM), HgCl2 (2 mM), and/or UV light (312 nm) were evaluated on DAF gels. Significantly more proteins (as shown by the arrows) in the mitochondrial lysate than in the cytoplasmic lysate were S-nitrosylated by GSNO. One or two bands that were easily detected in the mitochondrial and cytoplasmic lysates after GSNO treatment were also faintly visible prior to GSNO treatment, suggesting that they represent endogenously nitrosylated proteins. Molecular weight markers are indicated on the right. The gel is representative of five separate experiments. From ref. [50], with permission.
Acknowledgments
The authors would like to express their appreciation to Dr. Tsikas for the substantial contributions he has made to this work while serving as editor.
Footnotes
This paper is part of a special issue entitled “Analysis of the L-arginine/NO pathway”, guest edited by D. Tsikas.
Publisher's Disclaimer: This is a PDF file of an unedited manuscript that has been accepted for publication. As a service to our customers we are providing this early version of the manuscript. The manuscript will undergo copyediting, typesetting, and review of the resulting proof before it is published in its final citable form. Please note that during the production process errors may be discovered which could affect the content, and all legal disclaimers that apply to the journal pertain.
References
- 1.Hess DT, Matsumoto A, Kim SO, Marshall HE, Stamler JS. Nat Rev Mol Cell Biol. 2005;6:150. doi: 10.1038/nrm1569. [DOI] [PubMed] [Google Scholar]
- 2.Gaston B, Singel D, Doctor A, Stamler J. Am J Respir Crit Care Med. 2006;173:1186. doi: 10.1164/rccm.200510-1584PP. [DOI] [PMC free article] [PubMed] [Google Scholar]
- 3.Stamler JS, Toone EJ, Lipton SA, Sucher NJ. Neuron. 1997;18:691. doi: 10.1016/s0896-6273(00)80310-4. [DOI] [PubMed] [Google Scholar]
- 4.Zhang H, Xu Y, Joseph J, Kalyanaraman B. J Biol Chem. 2005;280:40684. doi: 10.1074/jbc.M504503200. [DOI] [PubMed] [Google Scholar]
- 5.Mannick J, Schonhoff C, Papeta N, Ghafourifar P, Szibor M, Fang K, Gaston B. J Cell Biol. 2001;154:1111. doi: 10.1083/jcb.200104008. [DOI] [PMC free article] [PubMed] [Google Scholar]
- 6.Gaston B, Carver J, Doctor A, Palmer L. Mol Interventions. 2003;3:253. doi: 10.1124/mi.3.5.253. [DOI] [PubMed] [Google Scholar]
- 7.Kim SF, Huri DA, Snyder SH. Science. 2005;310:1966. doi: 10.1126/science.1119407. [DOI] [PubMed] [Google Scholar]
- 8.West MB, Hill BG, Xuan YT, Bhatnagar A. FASEB J. 2006;20:1715. doi: 10.1096/fj.06-5843fje. [DOI] [PubMed] [Google Scholar]
- 9.Arnelle DR, Stamler JS. Arch Biochem Biophys. 1995;318:279. doi: 10.1006/abbi.1995.1231. [DOI] [PubMed] [Google Scholar]
- 10.Xu X, Cho M, Spencer NY, Patel N, Huang Z, Shields H, King SB, Gladwin MT, Hogg N, Kim-Shapiro DB. Proc Nat Acad Sci USA. 2003;100:11303. doi: 10.1073/pnas.2033883100. [DOI] [PMC free article] [PubMed] [Google Scholar]
- 11.Doctor A, Gaston B. Blood. 2006;108:3225. doi: 10.1182/blood-2006-05-026047. [DOI] [PubMed] [Google Scholar]
- 12.Kim-Shapiro DB. Blood. 2006;108:3226. doi: 10.1182/blood-2006-05-026047. [DOI] [PubMed] [Google Scholar]
- 13.Gaston B, Reilly J, Drazen JM, Fackler J, Ramdev P, Arnelle D, Mullins N, Sugarbaker D, Chee C, Singel D, Loscalzo J, Stamler JS. Proc Natl Acad Sci USA. 1993;90:10957. doi: 10.1073/pnas.90.23.10957. [DOI] [PMC free article] [PubMed] [Google Scholar]
- 14.Doctor A, Platt R, Sheram ML, Eischeid A, McMahon T, Maxey T, Doherty J, Axelrod M, Gurka M, Gow A, Gaston B. Proc Natl Acad Sci USA. 2005;102:5709. doi: 10.1073/pnas.0407490102. [DOI] [PMC free article] [PubMed] [Google Scholar]
- 15.Kluge I, Gutleck-Amsler U, Zollinger M, Do KQ. J Neurochem. 1997;69:2599. doi: 10.1046/j.1471-4159.1997.69062599.x. [DOI] [PubMed] [Google Scholar]
- 16.Tsikas D, Sandmann J, Gutzki FM, Stichtenoth DO, Frölich JC. J Chromatogr B. 1999;726:13. [PubMed] [Google Scholar]
- 17.Angelo M, Singel DJ, Stamler JS. Proc Nat Acad Sci USA. 2006;103:8366. doi: 10.1073/pnas.0600942103. [DOI] [PMC free article] [PubMed] [Google Scholar]
- 18.Pawloski JR, Hess DT, Stamler JS. Nature. 2001;409:622. doi: 10.1038/35054560. [DOI] [PubMed] [Google Scholar]
- 19.Gow AJ, Stamler JS. Nature. 1998;391:169. doi: 10.1038/34402. [DOI] [PubMed] [Google Scholar]
- 20.Gladwin MT, Schechter AN, Shelhamer JS, Pannell LK, Conway DA, Hrinczenko BW, Nichols JS, Pease-Fye ME, Noguchi CT, Rodgers GP, Ognibene FP. J Clin Invest. 1999;104:937. doi: 10.1172/JCI7637. [DOI] [PMC free article] [PubMed] [Google Scholar]
- 21.Rogers SC, Khalatbari A, Gapper PW, Frenneaux MP, James PE. J Biol Chem. 2005;280:26720. doi: 10.1074/jbc.M501179200. [DOI] [PubMed] [Google Scholar]
- 22.Yang Y, Loscalzo J. Proc Natl Acad Sci USA. 2005;102:117. doi: 10.1073/pnas.0405989102. [DOI] [PMC free article] [PubMed] [Google Scholar]
- 23.Lancaster J, Gaston B. Am J Physiol Lung Cell Mol Physiol. 2004;287:465. doi: 10.1152/ajplung.00151.2004. [DOI] [PubMed] [Google Scholar]
- 24.Hausladen A, Rafikov R, Angelo M, Singel DJ, Nudler E, Stamler JS. Proc Natl Acad Sci USA. 2007 doi: 10.1073/pnas.0611191104. in press. [DOI] [PMC free article] [PubMed] [Google Scholar]
- 25.Tsikas D, Sandmann J, Rossa S, Gutzki FM, Frölich JC. J Chromatogr B. 1999;726:1. [PubMed] [Google Scholar]
- 26.Carver J, Palmer LA, Doctor A, Gaston B. Methods Enzymol. 2005;396:95. doi: 10.1016/S0076-6879(05)96010-2. [DOI] [PubMed] [Google Scholar]
- 27.Martin Feelisch, Jonathan S Stamler., editors. Methods in Nitric Oxide Research. John Wiley & Sons Ltd; West Sussex England: 1996. p. 521. [Google Scholar]
- 28.Sexton DJA, Muruganandam SJ, McKenney SJ, Mutus B. Photochem Photobiol. 1994;64:518. doi: 10.1111/j.1751-1097.1994.tb05065.x. [DOI] [PubMed] [Google Scholar]
- 29.Tsikas D, Raida M, Sandmann J, Rossa S, Forssmann WG, Frolich JC. J Chromatogr B. 2000;742:99. doi: 10.1016/s0378-4347(00)00141-9. [DOI] [PubMed] [Google Scholar]
- 30.Shishido SM, de Oliveira MG. Photochem Photobiol. 2000;71:273. doi: 10.1562/0031-8655(2000)071<0273:pgmrtr>2.0.co;2. [DOI] [PubMed] [Google Scholar]
- 31.Mannick JB, Hausladen A, Liu L, Hess DT, Zeng M, Miao QX, Kane LS, Gow AJ, Stamler JS. Science. 1999;284:651. doi: 10.1126/science.284.5414.651. [DOI] [PubMed] [Google Scholar]
- 32.Fang K, Ragsdale NV, Carey RM, Macdonald T, Gaston B. Biochem Biophys Res Commun. 1998;252:535. doi: 10.1006/bbrc.1998.9688. [DOI] [PubMed] [Google Scholar]
- 33.Gaston B, Sears S, Woods J, Hunt J, Ponaman M, McMahon T, Stamler J. Lancet. 1998;351:1317. doi: 10.1016/S0140-6736(97)07485-0. [DOI] [PubMed] [Google Scholar]
- 34.Dejam A, Kleinbongard P, Tienush R, Hamada S, Gharini P, Rodriguez J, Feelisch M, Kelm M. Free Radic Biol Med. 2003;35:1151. doi: 10.1016/j.freeradbiomed.2003.09.009. [DOI] [PubMed] [Google Scholar]
- 35.Zaman K, Carraro S, Doherty J, Henderson EM, Lendermon E, Liu L, Verghese G, Zigler M, Ross M, Park E, Palmer L, Doctor A, Stamler JS, Gaston B. J Mol Pharmacol. 2006;70:1435. doi: 10.1124/mol.106.023242. [DOI] [PubMed] [Google Scholar]
- 36.Tsikas D, Denker K, Frolich JC. J Chromatog A. 2001;925:107. doi: 10.1016/s0021-9673(01)00634-3. [DOI] [PubMed] [Google Scholar]
- 37.Stedman D, Tammaro D, Branch D, Pearson R. Anal Chem. 1979;51:2340. [Google Scholar]
- 38.Lipton A, Johnson M, Macdonald T, Lieberman M, Gozal D, Gaston B. Nature. 2001;413:171. doi: 10.1038/35093117. [DOI] [PubMed] [Google Scholar]
- 39.Winslow RM, Vandegriff KD. Oxygen-hemoglobin disassociation curve, Chapter 120. In: Crystal RG, West JB, Barnes PJ, Weibel ER, editors. The Lung: Scientific Foundations. 2. Philadelphia: Lippincott-Raven; 1997. [Google Scholar]
- 40.Brunori M, Coletta M. E Di Cera Biophys Chem. 1986;23:215. doi: 10.1016/0301-4622(86)85006-2. [DOI] [PubMed] [Google Scholar]
- 41.Tsikas D, Sandmann J, Rossa S, Frölich JC. J Chromatogr B. 2002;772:335. [Google Scholar]
- 42.Tsikas D, Sandmann J, Rossa S, Gutzki FM, Frölich JC. Anal Biochem. 1999;272:117. doi: 10.1006/abio.1999.4177. [DOI] [PubMed] [Google Scholar]
- 43.Chhabra P, Gaston B, Sheram ML, Doctor A, Kebede E, Palmer LA. N-acetyl cysteine induced pulmonary hypertension in mice is modulated by sex hormones. American Thoracic Society International Conference; San Diego CA. 2005. [Google Scholar]
- 44.Jaffrey SR, Erdjument-Bromage H, Ferris CD, Tempst P, Snyder SH. Nat Cell Biol. 2001;3:193. doi: 10.1038/35055104. [DOI] [PubMed] [Google Scholar]
- 45.Hao G, Derakhshan B, Shi L, Campagne F, Gross SS. Proc Nat Acad Sci USA. 2006;103:1012. doi: 10.1073/pnas.0508412103. [DOI] [PMC free article] [PubMed] [Google Scholar]
- 46.Huang B, Chen C. Free Radic Biol Med. 2006;41:557. doi: 10.1016/j.freeradbiomed.2006.03.006. [DOI] [PubMed] [Google Scholar]
- 47.Zhang Y, Keszler A, Broniowska KA, Hogg N. Free Radic Biol Med. 2005;38:874. doi: 10.1016/j.freeradbiomed.2004.12.012. [DOI] [PubMed] [Google Scholar]
- 48.Itoh Y, Ma FH, Hoshi H, Oka M, Noda K, Ukai Y, Kojima H, Nagano T, Toda N. Anal Biochem. 2000;287:203. doi: 10.1006/abio.2000.4859. [DOI] [PubMed] [Google Scholar]
- 49.McMahon TJ, Moon RE, Luschinger BP, Carraway MS, Stone AE, Stolp BW, Gow A, Pawloski JR, Watke P, Singel DJ, Piantadosi CA, Stamler JS. Nat Med. 2002;8:711. doi: 10.1038/nm718. [DOI] [PubMed] [Google Scholar]
- 50.King M, Gildemeister O, Gaston B, Mannick JB. Anal Biochem. 2005;346:69. doi: 10.1016/j.ab.2005.07.025. [DOI] [PubMed] [Google Scholar]
- 51.Gow AJ, Chen Q, Hess DT, Day BJ, Ischiropoulos H, Stamler JS. J Biol Chem. 2002;277:9637. doi: 10.1074/jbc.C100746200. [DOI] [PubMed] [Google Scholar]
- 52.Munson DA, Grubb PH, Kerecman JD, McCurnin DC, Yoder BA, Hazen SL, Shaul PW, Ishiropoulos H. Am J Respir Cell Mol Biol. 2005;33:582. doi: 10.1165/rcmb.2005-0182OC. [DOI] [PubMed] [Google Scholar]