

Abstract
Sp-family transcription factors (Sp1, Sp3 and Sp4) contain a zinc-finger domain that binds to DNA sequences rich in G-C/T. As assayed by RT-PCR analysis of mRNA, western blot analysis, immunofluorescence, and antibody-dependent “supershift” of DNA-binding assays, the prominent Sp-family factors in cerebral neurons were identified as Sp3 and Sp4. By contrast, glial cells were found to express Sp1 and Sp3. We previously showed that the pattern of G-C/T binding activity of Sp-family factors is rapidly and specifically altered by the calcium influx accompanying activation of glutamate receptors. Here, we demonstrate that Sp-factor activity is also lost after a cerebral ischemia/reperfusion injury in vivo. Consistent with its calcium-dependent nature, we found that glutamate’s effect on Sp-family factors could be blocked by inhibitors of calpains, neutral cysteine proteases activated by calcium. Purified calpain I cleaved Sp3 and Sp4 into products that retained G-C/T-binding activity, consistent with species observed in glutamate-treated neurons. These data provide details of an impact of glutamate-receptor activation on molecular events connected to gene expression.
Keywords: Astrocyte, Calcium, Excitotoxicity, Ischemia, Sp1
INTRODUCTION
Sp-family proteins are a group of transcription factors containing zinc-finger motifs that bind to G-C/T rich sequences (Suske 1999). Sp-factors regulate the expression of a large number of genes, including most of those known as “housekeeping” genes. Typically, Sp1 and Sp3 are considered to be ubiquitously expressed in mammalian cells. High levels of Sp4 expression are exclusively detected in the nervous system from later embryonic stages and beyond (Supp et al. 1996; Zhou et al. 2005), suggesting that its major functions are ascribed to neural systems. Sp2 and other homologous proteins appear to regulate a different set of genes from those controlled by Sp1, Sp3, and Sp4 (Bouwman and Philipsen 2002).
Despite conservation in their zinc-finger domains, Sp-factors display complex activity patterns. Sp1 is generally considered to be a transactivator (Bouwman and Philipsen 2002). Sp3, on the other hand, has well-documented functional versatility, acting as either an activator or a repressor of transcription in a manner dependent upon translation variants, post-translational modification, and the structure of the target gene promoter (Sapetschnig et al. 2004). Sp4 is also found to be either a transcriptional activator or repressor, but the mechanisms dictating the distinction are not known.
Whatever their precise functions, Sp-family proteins are crucial for development and survival. Sp1-knockout mice die at embryonic day 10 (E10) (Marin et al. 1997). The influence of Sp3 on development seems slightly less critical, as its genetic ablation permits survival through birth (though lethal respiratory defects arise thereafter) (Bouwman et al. 2000). Sp4-null male mice do not breed; but their reproductive systems appear normal (Supp et al. 1996; Gollner et al. 2001), suggesting that the responsible defect is in the nervous system (Zhou et al. 2005).
We previously found that treatment of cortical neurons with glutamate results in diminution of transcription dependent upon Sp-factors (Mao et al. 2002). This is accompanied by a loss of the characteristic pattern of DNA-binding by Sp-factors and the appearance of two smaller DNA-binding species, implying proteolytic degradation of the Sp-factors (Mao et al. 2002). This effect has been documented most extensively in response to toxic levels of glutamate, in a manner dependent on calcium influx via NMDA receptors (Mao et al. 1999). Although the precise roles of Sp-factors in neuronal viability are unknown, intact Sp1 can be neuroprotective when expressed transgenically (Ryu et al. 2003).
Here, we report that calcium-activated proteases of the calpain family can account for the degradation of Sp-factors after glutamate treatment of cortical neurons. Also, we identify Sp3 and Sp4 as the major neuronal Sp-factors, while Sp1 protein is nearly absent in neurons. On the other hand, Sp1 and Sp3 (but not Sp4) are highly expressed in glial cells. The two small DNA-binding fragments generated by glutamate appear to result from calpain cleavage of Sp3 and Sp4, respectively.
MATERIALS AND METHODS
Materials
Most polyclonal antibodies were purchased from Santa Cruz Biotechnology Inc. (Santa Cruz CA): Sp1 (cat.# sc-59 for western-blotting; cat.# sc-59x for supershift), Sp3 (cat.# sc-644x for both western and supershift), Sp4 (cat.# sc-645x for both western and supershift), actin (cat.# sc-1616), and calpain I (cat.# sc-13990). A polyclonal antibody recognizing the 76-kD autoproteolyzed form of calpain I (Zhang et al. 2003) was generously provided by T. Saido. Monoclonal antibody K0043 (Sakai et al. 1995) against RBP-Jκ was generously provided by Dr. T. Honjo (Kyoto University). The probes used for electrophoretic mobility shift assay (EMSA) were purchased from Promega (Madison WI). The probe for Sp-factors consisted of a double-stranded oligodeoxynucleotide comprising the following sequence and its reverse-complement (Sp-factor binding site underlined): 5′-ATT CGA TCG GGG CGG GGC GAG C. For detection of RBP-Jκ, the HIV κB site was used (RPB-Jκ-binding site underlined): 5′-AGT TGA GGG GAC TTT CCC AGG C. Invitrogen (Carlsbad CA) supplied oligonucleotide PCR primers. All proteases and cell-permeable protease inhibitors were purchased from Calbiochem (San Diego CA): cathepsin B (cat.# 219364), cathepsin L (cat.# 219418), cathepsin D (cat.# 219398), calpain I (cat.# 208712), calpain II (cat.# 208715), CA-074 methyl ester (cat.# 205531), E64d (cat.# 330005), cathepsin B inhibitor I (Z-FA-FMK, cat.# 342000), cathepsin L inhibitor I (Z-FF-FMK, cat.# 219421), cathepsin L inhibitor II (Z-FY-CHO, cat.# 219426), pepstatin A methyl ester (cat.# 516485), caspase 3 inhibitor I (DEVD-CHO, cat.# 235423), caspase inhibitor I (Z-VAD-FMK, cat.# 627610), calpain inhibitor I (ALLN, cat.# 208721) and calpain inhibitor III (MDL 28170 or Z-VF-CHO, cat.# 208722). Plasmids pPAC-Sp1 and pPAC-Sp3 were described elsewhere (Mao et al. 2002). A high-expression Sp4 plasmid (pPAC-HD-FLAG-Sp4) for SL2 cells was kindly provided by Dr. G. Suske (University of Marburg, Germany). A monoclonal antibody recognizing MAP2 was from Sigma (St. Louis MO; cat.# M-4403), a monoclonal antibody recognizing NeuN was from Chemicon (Temecula CA; cat.# MAB377), and a monoclonal antibody recognizing GFAP was from Chemicon (cat.# MAB3402). Secondary antibodies included goat anti-rabbit/FITC (cat.# AP132F) and donkey anti-mouse/Rhodamine (cat.# AP192R) and were also from Chemicon.
Transient focal ischemia
Ischemic stroke was induced in Sprague-Dawley rats by middle cerebral artery occlusion (MCAO) as previously described (Yang et al. 2002). Briefly, animals were anesthetized by intraperitoneal injection of ketamine (60 mg/kg) and xylazine (10 mg/kg). Rectal temperature was monitored and maintained between 36.5 and 37.5 °C during the procedure. With the aid of an operating microscope, the left common carotid artery (CCA), external carotid artery (ECA), and internal carotid artery (ICA) were exposed through a midline cervical skin incision. The CCA and ECA were permanently cauterized. A 3-0 monofilament suture was introduced into the ICA via the ECA lumen, and advanced until resistance was encountered. The distance between the CCA bifurcation and the resistive point was about 1.9 cm. The middle cerebral artery (MCA) was occluded for 1 h and then the suture was withdrawn for reperfusion for 1 or 4 h. The brains were then removed under anesthesia and immediately frozen in liquid nitrogen.
Cell cultures
For assays involving cell extracts or homogenates, primary cultures of rat cerebrum were highly enriched for neurons, astrocytes, or microglia by methods described previously (Moerman et al. 1999; Wu et al. 2004; Bodles and Barger 2005). Neuronal enrichment, in particular, involved a combination of serum-free medium with a transient (4-day) exposure to cytosine arabinoside (AraC; 2-5 μM) that resulted in cultures that were carefully documented to be greater than 99% neurons. For immunostaining, mixed cultures were established containing rat hippocampal neurons and astrocytes by maintenance in a serum-containing medium as described (Moerman et al. 1999). NTera2 cells are a human teratocarcinoma cell line that expresses many markers of neuronal lineage and were maintained in an undifferentiated state as described (Moerman and Barger 1999). N9 and BV2 cells are murine microglial lines and were maintained as described (Wu et al. 2004). The Drosophila melanogaster SL2 cells were maintained at room temperature in Schneider’s Drosophila medium (Invitrogen) supplemented with 10% FBS and 10 μg/ml gentamycin sulfate.
Western-blot analysis
The protocol has been described in detail elsewhere (Mao et al. 2002). Cell lysates containing 35–50 μg of total protein were resolved by SDS-PAGE, using acrylamide percentages of 10–12%, depending on the size of the protein of interest. The antibody dilutions were anti-Sp1 (sc-59): 1:100; anti-Sp3 (sc-644x): 1:10,000; anti-Sp4 (sc-645x): 1:2,000; anti-calpain I (both): 1:100. Binding was detected by colorimetric reaction as described. All data depicted are representative of at least three experiments.
Immunofluorescence
Adult Sprague-Dawley rats were euthanized by decapitation under a surgical level of anesthesia with isoflurane. The brains were rapidly removed, bisected sagitally, and one half was immersion-fixed in formalin. Rostrocaudally delimited blocks were dehydrated and embedded in paraffin, then 6-μ frontal sections were cut. Once mounted on subbed slides, the sections were deparaffinized, rehydrated, and blocked in PBS with normal goat serum. For NeuN detection, antigen retrieval was necessary; sections were submerged in boiling 10 mM citric acid (pH 6.0) for 5 min, then washed in PBS. Primary antibodies were applied overnight at 4 °C. Sections were then washed three times and incubated with fluorophore-conjugated secondary antibodies (1:100 dilution) for 2 h, followed by 10 min of staining with DAPI (Sigma).
For immunocytofluorescence, mixed cultures of rat hippocampus were cultured on coverslips in 24-well plates. Cells were fixed with 4% paraformaldehyde for 30 min at room temperature and then permeabilized with 0.2% Triton X-100 for 10 min. After a 30-min blocking period, primary antibodies were applied for 2–3 h. Cells were then washed three times and incubated with fluorophore-conjugated secondary antibodies (1:100 dilution) for one hour, followed by 10 min of staining with DAPI (Sigma).
Epifluorescence was visualized and recorded with 20X/0.5 Plan Fluor objective on a Nikon Eclipse E600 system, equipped with a Photometrics Coolsnap™ ES camera. The pictures were acquired through MetaVue™ software (Universal Imaging Corporation™) and further processed through this software and Adobe Photoshop CS for merging multiple wavelengths and fine adjustments of color balance and brightness. All data depicted are representative of at least three experiments.
Nuclear extraction, proteolysis and EMSA
Nuclear extraction and EMSA protocols have been provided elsewhere (Moerman et al. 1999). The cell-free proteolysis assay was modified from the original protocol. For cathepsin L or B proteolysis, 1 μl of 10-mM DTT and 1 μl of 10X reaction buffer (650 mM HOAC-NaOAC for buffer pH values 5.5–6.5; 650 mM Tris-HCl for pH values 7.0–7.4) was incubated with cathepsin L (2–10 mU) or cathepsin B (100–300 mU) for 10 min at 0 °C to activate the enzymes. Then, 1 μl of 5-mM ZnCl2 and nuclear extract (usually 3–5 μg in 1-2 μl) were added, followed by a 15-min incubation at 37 °C (total volume, 10 μl). The reaction was stopped by adding 18 μl of H2O and 7 μl of EMSA binding buffer containing 1.65 μg of poly(dI-dC); final concentrations of buffer components: 10 mM Tris-HCl, 4% glycerol, 1 mM MgCl2, 0.5 mM EDTA, 0.1% NP-40, pH 8.0 (the elevated pH of this buffer served to neutralize the acidic digestion conditions). Cathepsin D reactions were similar to cathepsin B and L except that DTT was omitted and 0.5–1 U of enzyme was used in each reaction. For calpain proteolysis, 1 μl of 3% β-mercaptoethanol, 3 μl of 50 mM CaCl2, calpain I (0.2–0.6 U), and 3 μl of reaction buffer (final concentration: 20 mM Tris-HCl, 20 mM KCl, pH 7.5) were incubated at room temperature for 10 min. Then, 3 μl of 5-mM ZnCl2 and nuclear protein were added (total volume, 30 μl). After a 15-min incubation at 37 °C, 7 μl of EMSA binding buffer (pH 7.4) with poly(dI-dC) was added. The remaining procedure was the same as our published EMSA protocol. For supershifts, the total antibody amount was 1.2 μg (0.6 μl) in each reaction, and the equivalent amount of each antibody was used in the reactions when multiple antibodies were present. Antibodies were added with EMSA binding buffer, and the length of the 0 °C preincubation was extended to 60 min (with periodic agitation) before addition of the probe. All data depicted are representative of at least five experiments.
Reverse transcription and polymerase chain reaction (RT-PCR)
The general protocol has been described elsewhere (Mao et al. 2002). Specific primers and PCR conditions were as follows. Sp1 upstream primer: 5′-CCC CAG GTG ATC ATG GAG C-3′; downstream primer: 5′-CTT CTC TCC TGT ATG TGT ACG-3′ (30 cycles, producing a 383-bp product). Sp3 upstream primer: 5′-CGG AGG GTG CTT GCA CCT GTC-3′; downstream primer: 5′-GGA TGT CTT GAT TGC TGG TGG C (27 cycles, producing a 445-bp product). Sp4 upstream primer: 5′-GGG ATG AGC GAT CAG AAG AAG G-3′; downstream primer: 5′-CCA CCG TCT GAA GTT GGG GG-3′ (33 cycles, producing a 520-bp product). Cyclophilin upstream primer: 5′-GCA AGT CCA TCT ACG GAG AGA A-3′; downstream primer: 5′-GCA ATC CTG CTA GAC TTG AAG G-3′ (23 cycles, producing a 433-bp product). Glyceraldehyde phosphate dehydrogenase (GAPDH) upstream primer: 5′-GAA CGG ATT TGG CCG TAT CG-3′; downstream primer: 5′-TGG GGG TAG GAA CAC GGA A-3′ (23 cycles, producing a 692-bp product). β-actin upstream primer: 5′-GTC CTC TGC CAT GTG GTT TTC-3′; downstream primer: 5′-GCT GCG CTC TCG TAA TTG TG-3′ (21 cycles, producing a 439-bp product). Annealing temperature for all reactions was 60 °C. The cycle numbers and other conditions were optimized to achieve linear rates of amplification. All data depicted are representative of at least three experiments.
Luciferase reporter assays
Primary rat cortical neurons were plated at 1 × 10⁵/cm2 in 24-well plates and highly enriched by AraC treatment. On culture day 9, the neurons were transfected in triplicate with Lipofectamine 2000 complexed with 1 μg total DNA per well, including 0.88 μg inert carrier DNA and 0.02 μg of a Renilla luciferase reference reporter (pRL-CMV; Promega); the remaining 0.1 μg was provided by the firefly luciferase reporters pNRL356, pNRL356mtSp1×2, or pGL3-promΔ (Mao et al. 2002). The pNRL356 plasmid contains the NMDA receptor NR1 subunit promoter region −356 to −1 inserted into pGL2-Basic (Promega); in pNRL356mtSp1×2, two Sp-factor binding sites located at −299 to −267 have been specifically mutated (Bai and Kusiak 1997). Transfection mixtures were added to the existing media, and washed off after 90 min of incubation. After an overnight recovery, glutamate (15 μM) was added with or without a pretreatment of 10 μM ALLN or MDL28170. A dual-luciferase reporter assay system (Promega) was used to detect both firefly and Renilla luciferase activities 20 h later through a Veritas luminometer (Promega). Firefly luciferase values were normalized to the Renilla values, and the normalized pNRL356mtSp1×2 values were subtracted from those for pNRL356 to remove any effects arising from sequences outside the Sp-factor sites. The data reported were confirmed with two repetitions.
RESULTS
Loss of Sp-factor integrity during an excitotoxic challenge in vivo
We previously reported that excitotoxic stress imposed by glutamate could cause a loss of DNA-binding activity by intact Sp-factors in cultures of hippocampal or neocortical neurons (Mao et al. 2002). To test the relevance of this phenomenon to excitotoxic conditions in vivo, we assayed Sp-factor activity in extracts from rats subjected to transient forebrain ischemia by middle cerebral artery occlusion (MCAO); this stroke model involves a robust elevation of glutamate that peaks near the time of reperfusion and is responsible for most of the ensuing neurodegeneration. Rats were subjected to MCAO for 1 h, then the suture blocking the MCA was removed and reperfusion ensued for an additional 1 or 4 h. Tissue from the ischemic (ispsilateral) or unoccluded (contralateral) side of the cerebrum was prepared for extraction of nuclear proteins, and EMSA was used to measure binding to a G-C/T (“Sp1 consensus”) probe (Figure 1). There was an insignificant trend towards a reduction of Sp-factor activity at 1 h of reperfusion. By 4 h of reperfusion a significant loss of DNA-binding by intact Sp-factors was observed. Densitometry of the EMSA bands produced the following values (arbitrary units): control, 322.7 ± 92.93; ischemia, 137.6 ± 57.60; p=0.007 (paired t-test). As a control for specificity of the effect we analyzed RBP-Jκ, a widely expressed transcription factor that binds the 3′ end of the HIV/immunoglobulin κB enhancer element. DNA binding by this protein was not altered by ischemia/reperfusion.
Figure 1. Loss of DNA-binding activity by Sp-factors during ischemia/reperfusion.

Rats were subjected to a 1-h occlusion of the middle cerebral artery, then reperfusion for 1 or 4 h. Brains were removed and immediately frozen in liquid nitrogen. Regions of the cerebrum most likely to be affected on the side ipsilateral to the injury (I) were thawed in lysis buffer for extraction of nuclei; the same procedure was performed for the corresponding region from the contralateral, unoperated side (C). EMSA was performed on extracts equilibrated for total protein, using a radiolabeled probe containing an optimal target sequence for Sp1 and related factors (top) or for RBP-Jκ (bottom). Each pair of lanes represents the contralateral and ipsilateral sample from the same brain in adjacent lanes.
Calpain inhibitors block the loss of Sp-factors by glutamate
The replication of Sp-factor deficits in a clinically relevant model, combined with prior evidence of proteolysis (Mao et al. 2002), prompted a more mechanistic analysis of this phenomenon in cell culture. Initial screening for proteases involved application of protease inhibitors to primary cultures of neurons from rat neocortex to test the ability of individual inhibitors to protect against the glutamate-evoked changes in Sp-factor activity in EMSA (Figure 2). Inhibitors included those for two major lysosomal cathepsins (B and L), for aspartyl lysosomal cathepsin D, for caspases, and for calpains. A 1-h exposure to 50 μM glutamate resulted in loss of the typical Sp-factor complexes and a concomitant production of smaller complexes that retained DNA binding activity (Figure 2, compare lanes 1 and 2). Inhibitors for caspases (caspase inhibitor I and DEVD) and cathepsin D (pepstatin A) were unable to block the effect of glutamate on Sp-factors. Cathepsin B inhibitor I was able to block the cleavage of Sp-factors (data not shown), but another cathepsin B inhibitor, CA-074, had no effect, suggesting that cathepsin B inhibitor I might target some other proteases. Cathepsin L inhibitor I prevented the glutamate-evoked changes in Sp-factors. Compound E64d, effective against both cathepsin B/L and calpains (Ray et al. 2000), was also very effective. Calpain inhibitors ALLN and MDL28170 were able to completely block glutamate’s effects.
Figure 2. Calpain inhibitors block the loss of Sp-factors triggered by glutamate.

Protease inhibitors (ALLN and MDL28170, 3 μM; remainder, 10 μM) were applied to neocortical neurons 30 min before glutamate exposure (50 μM, 60 min). Nuclear proteins were extracted, and protein-DNA interactions were assessed by EMSA with a Sp-factor probe. Two apparent proteolytic fragments (arrowheads) arose after glutamate treatment. (The band marked “Sp3Δ” is consistent with a smaller variant of Sp3 derived from internal translation initiation site.)
As a functional test of the role of calpain we performed a luciferase reporter assay. Primary cortical neurons were transfected with a plasmid containing firefly luciferase driven by the promoter for the NMDA receptor NR1 subunit. This promoter has previously been shown to include a Sp-factor binding site that confers negative regulation by glutamate (Mao et al. 2002). We confirmed that glutamate reduced the Sp-factor-dependent expression of this promoter (Table I). Furthermore, when the transfected cultures were treated with ALLN and MDL28170, these calpain inhibitors blocked the effect of glutamate on NR1 promoter activity.
Table I.
Role of calpain in glutamate-induced suppression of Sp-factor-dependent transcription.
| Treatment | Relative luciferase activity(mean ± SEM) |
|---|---|
| Control | 5.250 ± 0.3713 |
| Glutamate (15 μM) | 3.291 ± 0.0552* |
| Glutamate + ALLN (10 μM) | 6.439 ± 0.1723 |
| Glutamate + MDL (10 μM) | 5.187 ± 0.4083 |
p ≤ 0.003 vs. all other conditions (Student’s t-test)
Calpain and glutamate produce a similar pattern of Sp-factor digestion
The above data indicated that cathepsin L and/or calpains might be activated by glutamate to cleave Sp-factors. However, because none of these peptidergic inhibitors can be considered specific for a single protease intracellularly, direct cleavage experiments with purified enzymes were required to confirm those results. We used purified cathepsins and calpains in a cell-free proteolysis assay to test which enzyme(s) could create the same cleavage pattern seen in glutamate-treated neurons. Nuclear extracts were prepared from untreated cultures of neocortical neurons and incubated with proteases as described in Materials and Methods. The proteolytic products were then subjected to EMSA analysis. Cathepsin L was able to create two Sp-fragments in a dose-dependent manner (Figure 3). However, these two fragments did not show the same pattern as seen in glutamate-treated neurons. First, extracts from glutamate-treated neurons produced more distinct bands than the cathepsin L-generated products, which appeared as more of a smear. This is consistent with the ability of cathepsin L to act as both an endopeptidase and an exopeptidase, generating multiple products. Second, the smaller fragment was not the same size as seen in extracts from glutamate-treated neurons. Cathepsin B, another major lysosomal cysteine protease, was unable to create any clear DNA-binding product. Cathepsin D, a very potent aspartyl protease, was able to create two fragments reminiscent of those seen in glutamate-treated neurons. However, the optimal conditions for both cathepsins depended on very low pH; there was little activity for cathepsin D or L in pH 6.0 or greater (Figure 3, lanes 13–21). Also, there was very little of the smaller fragment after cathepsin D treatment, even after extended cleavage time and with elevated protease concentration. In summary, both cathepsin L and cathepsin D were able to cleave neuronal Sp-factors into two fragments. One fragment was consistent with a corresponding fragment seen in glutamate-treated neurons. However, the smaller band was either nearly missing (cathepsin D) or larger (cathepsin L) than that created by glutamate exposure.
Figure 3. Calpain I cleavage of neuronal Sp-factors in vitro approximates that produced in situ by glutamate exposure.

Nuclear extract from untreated neurons was incubated with commercial preparations of cathepsin B, D, L or calpain I at varying concentrations of the proteases (lanes 3–12 and 22–24) or at varying pH (lanes 13–21). The reactions in lanes 3–12 were performed at pH 5.5 and calpain I cleavage (lanes 22–24) was performed at pH 7.0. After protease digestion, reactions were returned to neutral pH for DNA-binding reactions, followed by resolution on an EMSA gel. The initial, undigested extract (lane 1) was also compared to a similar extract from glutamate-treated neurons (lane 2) for comparison to the typical degradation pattern, characterized by the two prominent products (arrowheads). (None of the protease preparations showed any reaction with the probe itself in control experiments not depicted here.)
In contrast to these inconsistencies, cell-free assays of calpain I produced the exact pattern seen in glutamate-treated neurons. Two fragments were generated with precisely the same sizes and in similar ratios as those seen in extracts from glutamate-treated cultures. Calpain II created the same pattern as calpain I, but a much higher amount of enzyme was required (data not shown). Together with the inhibitor studies performed in intact cells (above), these EMSA profiles of cell-free cleavage assays (Figure 3) indicate that calpains are the relevant proteases attacking Sp-factors in glutamate-treated neurons.
Calpain I in neurons
To assess the expression pattern of calpain I, we utilized double immunofluorescence in neuronglia mixed cultures from rat hippocampus, combining the anti-calpain antibody with one against a neuronal marker (MAP2). Calpain I expression was substantially more detectable in neurons than in MAP2− cells (primarily astrocytes) (Figure 4A). Calpain I was localized throughout the cell, showing clear colocalization with both MAP2 (cytosolic) and DAPI staining (nuclear). After glutamate treatment, MAP2 staining was substantially reduced (Figure 4B). MAP2 is a calpain substrate (Buddle et al. 2003; Takano et al. 2005); thus, its loss serves as additional evidence that the glutamate treatment applied here activated calpain. (Other substrates were not analyzed because of the wealth of data explicating calpain activation by glutamate receptor agonists.) Calpain inhibitor was able to block the reduction in MAP2 immunofluorescence (not shown). To confirm that calpain was compartmentalized in manner consistent with attack of nuclear proteins, western blot analysis was performed on nuclear extracts from neocortical neurons (Figure 4C). These assays also showed a slight reduction in full-length nuclear calpain I levels (large subunit, ~80 kD) after glutamate treatment.
Figure 4. Calpain I expression in neural cultures.

Mixed neuronglia cultures from hippocampus were fixed without treatment (A) or following exposure to 50 μM glutamate for 60 min (B). Immunofluorescence was performed with antibodies against MAP2 (red) and calpain I (green); nuclei were subsequently stained with DAPI (blue). C: Nuclear proteins were extracted from control or glutamate-treated neocortical neurons, and 35 μg protein was subjected to western-blot analysis of calpain I (large subunit, ~80 kD); NeuN was detected to assure equivalency of loading.
We also examined cathepsin expression and distribution in basal and glutamate-treated neuronal cultures. Cathepsin D was visualized using BODIPY-conjugated pepstatin A, which binds cathepsin D specifically (Chen et al. 2000). The distribution of cathepsin L was examined by immunofluorescence. In contrast to the diffuse localization of calpain immunoreactivity, cathepsin D appeared in a punctate pattern consistent with lysosomal localization (not shown). Anti-cathepsin L immunolocalization was more diffuse, but generally excluded from the nucleus (not shown). These markers of cathepsin localization were largely unaltered after exposure of cells to glutamate.
Sp3 and Sp4 are the main Sp-factors in neurons
Previous reports have suggested that the prominence of Sp1 as a G-C/T-binding transcription factor is widespread, and studies of neurons have emphasized this member of the Sp family. However, when attempts were made to reconstitute cell-free proteolysis patterns using individual Sp-factors as substrates, we found that calpain cleavage of Sp1 produced products discordant with those generated in situ by glutamate treatment of neurons (below). Therefore, several other approaches were taken to examine the expression of Sp1, Sp3, and Sp4 in neurons. Immunofluorescence was performed on tissue sections from adult Sprague-Dawley rats. Antibodies specific for individual Sp-factors were combined in double-labeling analyses with a marker for neurons (NeuN) or astrocytes (GFAP). In the cerebral neocortex, cells positive for NeuN were generally immunoreactive for Sp4 but not Sp1 (Figure 5, B vs. D), whereas GFAP+ cells were generally immunoreactive for Sp1 but not Sp4 (Figure 5, A vs. C). In the hippocampus, the distinction was even more apparent, with regions of densely packed pyramidal neurons, such as the stratum pyramidalis of CA1, staining positive for Sp4 and negative for Sp1 (Figure 6, B vs. D). Here again, astrocytes showed the reciprocal staining (Figure 6, A vs. C). Definitive localization of Sp1 to glia was also present in analysis of white-matter tracts, which are devoid of neuronal nuclei (data not shown). Essentially all cells in neocortex and hippocampus showed immunofluorescence for Sp3 (data not shown).
Figure 5. Cell-type specificity of Sp-factors in cerebral cortex.
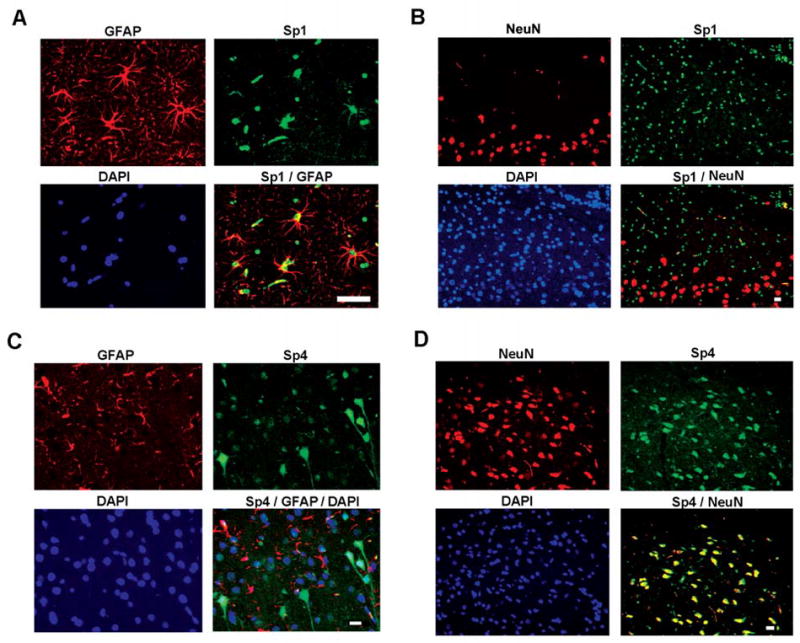
Immunofluorescence was performed on frontal sections of rat cerebral cortex with antibodies against GFAP or NeuN (red), Sp1 or Sp4 (green). Sections were also stained with DAPI to localize total cellular nuclei. Double overlay is depicted for localization of the Sp-factors to neurons (NeuN+) or astrocytes (GFAP+); triple overlays incorporate DAPI staining as well. Scale bars represent 10 μ.
Figure 6. Cell-type specificity of Sp-factors in hippocampus.

Immunofluorescence was performed on frontal sections of rat brain with antibodies against GFAP or NeuN (red), Sp1 or Sp4 (green). Sections were also stained with DAPI to localize total cellular nuclei. Double overlay is depicted for localization of the Sp-factors to neurons (NeuN+) or astrocytes (GFAP+); triple overlays incorporate DAPI staining as well. Images depict CA1 of the hippocampus; scale bars represent 10 μ.
Mixed neuronglia cultures were also examined by immunofluorescence so that expression patterns could be interpreted under conditions where the cells were more sparsely distributed. Astrocytic cells were again identified by anti-GFAP, but neurons were labeled with anti-MAP2. All GFAP-positive cells were Sp1-positive, but all MAP2-positive cells were relatively deficient in Sp1 (Figure 7). A few GFAP-negative cells were Sp1-positive, but these did not have neuronal morphology and were interpreted to be astrocytes with lower expression levels of GFAP or other glial cell types. On the other hand, Sp4 was only detected in MAP2-positive cells and was absent in all MAP2-negative cells. Together, the data indicated that Sp1 and Sp4 show reciprocal expression in glia and neurons, with the former containing Sp1 and the latter Sp4. The reactivity of Sp3 was clearly expressed in every cell present (data not shown).
Figure 7. Cell-type specificity of Sp-factors in culture.
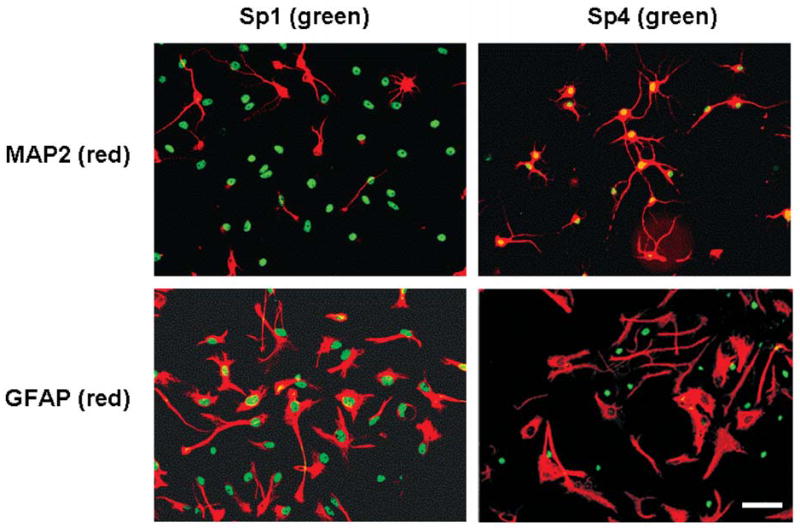
Mixed hippocampal cultures were analyzed by immunofluorescence with antibodies against GFAP or MAP2 (red), Sp1 or Sp4 (green). Double overlay is depicted for localization of the Sp-factors to neurons (MAP2+) or astrocytes (GFAP+). Scale bar represents 30 μ.
The specificity of Sp1 and Sp4 expression, apparent from immunolocalization, was confirmed by western blot analysis of cellular lysates of primary cultures highly enriched for astrocytes or neocortical neurons (Figure 8). For this approach, we expanded our survey to several cell lines, including a microglial cell line (BV2) and a human teratocarcinoma cell line (NTera2) that expresses some markers of neurons, even prior to differentiation. Sp1 proteins (95 and 105 kD) were highly expressed in astrocytes, NTera2, and BV2 but were nearly absent in primary neurons (Figure 8A). All cell types showed Sp3 proteins; these were apparent as multiple bands ranging from 70–110 kD (Figure 8B), consistent with previous reports of alternative translation initiation sites and SUMOylation (Sapetschnig et al. 2004). Sp4 protein was highly expressed in primary neurons and NTera2 cells but much less abundant in astrocytes and BV2 cells (Figure 8C).
Figure 8. Expression of Sp-factors in neurons and/or glia as detected by western-blot analysis.

Whole-cell lysates of astrocytes, neocortical neurons, NTera2 neuronal cells, and BV2 microglial cells was subjected to western-blot analysis (35 μg protein per lane) with antibodies against Sp1 (A), Sp3 (B), Sp4 (C), or actin (D). Arrows mark bands consistent with the mobilities of reported variants of each respective Sp-factor. The blots were over-developed to detect low levels of the various proteins in cell types in which they were scarce. [One 55-kD band (‘N.S.’) was nonspecifically detected in neuronal lysates with every antibody.]
We also examined Sp-factor expression by RT-PCR analysis of mRNA (Figure 9). RT-PCR for Sp1 mRNA in neurons showed significantly lower levels than those in astrocytes (p<0.001), while Sp4 mRNA in neurons was significantly more abundant than in astrocytes (p<0.05). However, Sp3 mRNA was almost equivalently expressed in both types of cells. Interestingly, while the cell-type differences in mRNA were clear, the degree to which they were different was somewhat less impressive than the nearly exclusive expression pattern seen at the protein level. Initial controls for equilibration were attempted with β-actin; however, this gene product appeared to be differentially expressed in neurons and glia, so cyclophilin and GAPDH were also quantified.
Figure 9. Expression of Sp-factor mRNAs in neurons and glia.

Total RNA was extracted from cultures of astrocytes or neocortical neurons. RT-PCR was used to semiquantitatively compare the mRNA levels of Sp1, Sp3, and Sp4 (A). Equilibration was confirmed by amplification of three constitutive genes: cyclophilin, GAPDH, and β-actin. The reaction products were quantified by densitometry (B). The relative level of each mRNA in glia was set as 100% and the levels in neurons were normalized to glial values. (**p < 0.001, *p < 0.05, by Student’s t-test).
To assess the ramifications of these differences for transcriptional activity, supershift experiments were used to test the contributions of the Sp-proteins to DNA binding in different cells (Figure 10). Sp1 antibody was unable to supershift or reduce a significant portion of Sp-factor complexes from neocortical neurons. Sp3 and Sp4 antibodies, by contrast, were very efficient in neuronal extracts (Figure 10A), and a combination of Sp3 and Sp4 antibodies was able to supershift the DNA-binding complex nearly completely. To confirm that Sp1 antibody was able to react with rat Sp1 protein, nuclear extract from rat astrocytes was examined. Sp1 and Sp3 but not Sp4 antibodies were able to supershift DNA-binding proteins in astrocytes (Figure 10C). We also tested the supershift profiles in NTera2 cells (Figure 10B), rat primary microglia (Figure 10D), and two mouse microglial cell lines (BV2, Figure 10E; N9, Figure 10F). In NTera2 cells, all three factors were present in substantial amounts. This was consistent with the western blot analysis (above). However, all glial cells lacked reactivity with Sp4 antibody, regardless of cell type and species.
Figure 10. Expression of Sp-factors in neurons and/or glia as detected by EMSA.

Nuclear proteins were extracted from various cell types (A: primary neurons; B: NTera2 neuronal cells; C: primary astrocytes; D: primary microglia; E: BV2 microglial cells; F: N9 microglial cells) and analyzed by EMSA. Antibodies against Sp1, Sp3, and Sp4 were used to supershift Sp-binding proteins. For each supershift, 1.2 μg of total antibody was added, and an equal amount of each antibody was used when combined. (arrows: full length of Sp-proteins; arrowheads: Sp3Δ; the asterisk indicates a band observed only in NTera2 cells and sensitive to Sp1 antibody).
Calpains cleave Sp1, Sp3 and Sp4
Having established that Sp3 and Sp4 would be the primary Sp-factors affected by excitotoxic proteolysis in neurons, we applied the cell-free proteolysis/EMSA paradigm to these proteins systematically by expressing the Sp-factors individually. Sp1, Sp3, and Sp4 were transfected individually into Drosophila SL2 cells, which have no endogenous Sp-proteins. The expression level of each protein was determined by EMSA, and relatively equal DNA-binding activities of Sp1, Sp3, and Sp4 were used in cell-free assays of calpain proteolysis. Multiple bands were observed from each digestion, and the sizes of proteolytic products decreased with the each increment of enzyme concentration (Figure 11A). For any given Sp-factor, there were at least five bands in early stages of cleavage by calpain I (data not shown). The sizes of these fragments suggested that the relevant proteolytic sites were concentrated near the amino- and carboxyterminal borders of each protein’s zinc-finger region. As suspected from its restricted expression pattern, Sp1 did not produce a cleavage pattern consistent with the fragments created in neurons by glutamate treatment. On the other hand, one major fragment from Sp3 cleavage and one major fragment from Sp4 cleavage were in agreement with the sizes of the two prominent bands created in glutamate-treated neurons. When both Sp3 and Sp4 were combined in a calpain reaction, the cleavage pattern was almost identical to that of neuronal nuclear extract treated with calpain (Figure 11B). Although there were some subtle differences between the two reactions, these may arise from species differences (human cDNAs were expressed in the SL2 cells) and, potentially, different post-translational modifications of the proteins in these cell types.
Figure 11. Calpain I cleavage of Sp3 and Sp4 can account for the Sp-factor degradation pattern in neurons.
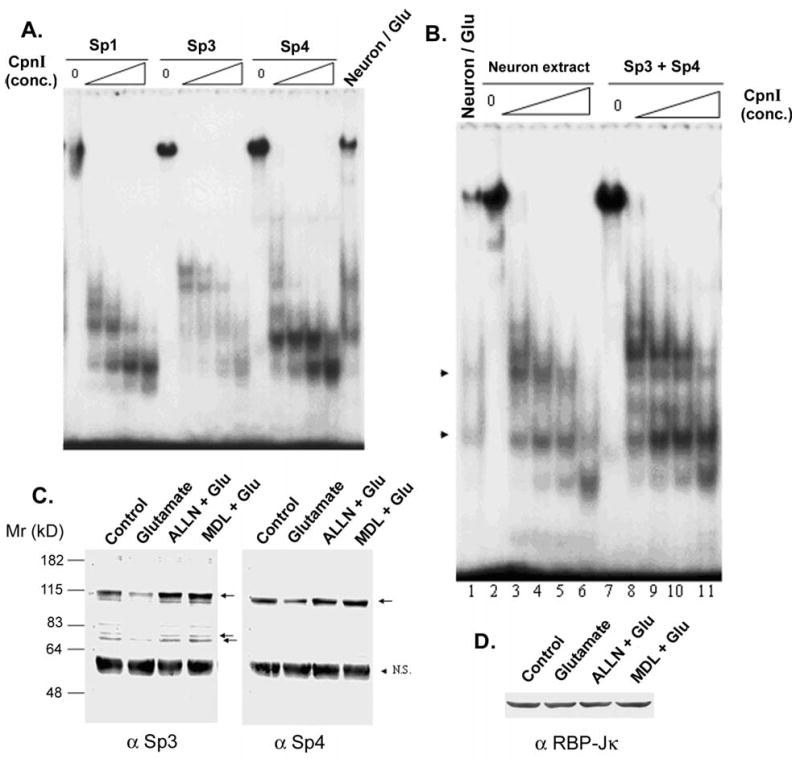
A. Sp1, Sp3, and Sp4 were individually expressed in SL2 cells, then nuclear extracts were made. A SL2 nuclear extract containing each indicated Sp-factor was incubated with various concentrations of calpain I, and the degradation patterns were resolved by EMSA. (Extracts from untransfected SL2 showed no reaction with the probe in control assays not depicted here.) B. Nuclear extract from neocortical neurons was subjected to cell-free proteolysis with various concentrations of calpain I (lanes 2–6), and the degradation pattern was compared to that occurring in situ after treating intact cells with glutamate (lane 1). These degradation patterns were also compared to that produced by calpain I incubation with a mixture of extracts from Sp3- and Sp4-transfected SL2 cells (lanes 7–11) (arrowheads: two fragments derived from glutamate treatment). C. Neocortical neurons were lysed with or without exposure to glutamate, and 50 μg of total protein were subjected to western-blot analysis with antibody recognizing Sp3 or Sp4. Glutamate was applied at 50 μM for 60 min; ALLN and MDL (MDL28170) were applied at 10 μM, 30 min prior to glutamate application. Arrows mark bands consistent with the mobilities of reported variants of each respective Sp-factor. ‘N.S.’: a protein detected nonspecifically in neuronal lysates with every antibody. D. The samples analyzed in panel C were probed for RBP-Jκ as a control for loading and specificity of the effect.
We also analyzed calpain cleavage of Sp3 and Sp4 by western-blot analysis. The predominant Sp3 and Sp4 species were diminished by toxic glutamate treatment, an event completely blocked by calpain inhibitors ALLN and MDL28170 (Figure 11C). Interestingly, the minor species of Sp3 were also diminished by glutamate treatment, suggesting that calpain attacks its substrate at multiple sites. (The antibody recognizes an epitope outside the zinc-finger domain apparently responsible for the Sp3 fragment detected by EMSA.)
DISCUSSION
In these studies we have extended our analysis of proteolysis of the family of transcription factors exemplified by Sp1. Loss of DNA-binding activity during ischemia/reperfusion was consistent with our prior study showing a glutamatergic impact on this transcription factor family, inspiring a more thorough mechanistic analysis. Consistent with emerging data from other sources (Zhou et al. 2005), Sp4 appeared to be an important member of the Sp-family in neurons. More surprising was evidence that Sp1 is nearly absent from neurons. The three Sp factors analyzed here showed distinct expression patterns in brain cells: Sp1 was present in glial cells but not neurons; Sp3 appeared ubiquitously in glia and neurons; Sp4 was highly enriched in neurons but undetectable in glia. These data informed our analysis of the proteases involved in Sp-factor degradation after a brief exposure to glutamate, culminating in the replication of the glutamate-triggered cleavage pattern with cell-free assays of calpain I.
Together, western-blot analyses, immunolocalization, and EMSA supershift results consistently indicated that Sp1 was almost completely restricted to nonneuronal cells, whereas Sp4 was enriched in neurons. A neuronal role for Sp4 is consistent with a recent report (Zhou et al. 2005), but most investigators have assumed a strong expression of Sp1 in neurons, as well. Indeed, we previously reported a 78-kD band in western blot analysis of neuronal cultures that was immunoreactive with anti-Sp1 antibody (Mao et al. 2002), but that determination was without the benefit of a comparison to other cell types. It should be noted that even in that prior study, we observed no influence of anti-Sp1 antibody in EMSA analyses using a Sp-factor probe. Transcriptional crosstalk between Sp1 and Sp4 may contribute to their mutual exclusion. Reporter-gene analyses have shown that the Sp1 promoter is auto-induced (Nicolas et al. 2003), whereas the Sp4 promoter is suppressed by Sp1 (Song et al. 2001). Sp3 does not appear to influence either Sp1 or Sp4 promoter activity. However, the cell-type differences in expression of Sp1 and Sp4 protein were more pronounced than those for the mRNAs, suggesting that some of the cell type-specificity of Sp-factors arises at the level of translation or protein stability. If the low expression of Sp1 in neurons is indeed a consequence of Sp4 repression, Sp1 might be disinhibited after glutamate-triggered reductions in Sp4, at least temporarily. We did not observe any induction of Sp1 at twenty-four hours after glutamate treatment (Mao & Barger, unpublished results), but it is possible that this reflects a selection artifact; the analysis is specific for live cells and may thus select for those that never suffered a substantial calpain activation.
It is interesting that the NTera2 cells showed expression of both Sp1 and Sp4. In their undifferentiated state, these cells express ionotropic glutamate receptors and other neuronal markers (Pleasure and Lee 1993; Hardy et al. 1994), but their morphology and growth properties are scarcely recognizable as neuronal. They may reside at some intermediate stage in neuronal differentiation, requiring expression of both neuronal and nonneuronal genes. Their expression of Sp1 is consistent with reports of Sp1 in undifferentiated P19 cells (Okamoto et al. 2002; Liu et al. 2004), which are similarly neuropotent.
It is difficult to predict the consequences of Sp1 scarcity in neurons, but the general tendencies toward transcriptional activation or repression by the various family members would suggest the balance is tipped toward repression in neurons. One implication for neuronal differentiation is suggested by the ability of Sp3 to inhibit transcription of Sp1-induced genes critical for mitosis (Birnbaum et al. 1995). This effect is dependent upon the presence of multimeric cis elements containing adjacent binding sites for Sp factors; thus, Sp3 activity may be heavily influenced by coexpression of Sp1 or Sp4. The factors dictating Sp4’s functional properties are even more mysterious. Sp4 has been reported as an activator (Hagen et al. 1995) or a repressor (Kwon et al. 1999). Additional issues are raised by the fact that Sp-factors are able to interact with sites conventionally known as binding sites for NFκB, as no bona fide NFκB activity can be detected in pure neuronal cultures (Barger et al. 2005).
The proteins binding to a Sp-factor target sequence showed reduced activity after a cerebral ischemia/reperfusion model in vivo. This type of injury entails a considerable degree of glutamate-mediated damage (Simon et al. 1984). Our previous findings with neuronal cultures had indicated that excessive glutamatergic stimulation generated smaller Sp-factor fragments consistent with proteolysis. We confirmed that effect here and documented strong indications of a role for calpain. Though similar proteolysis probably explains the effect of ischemia/reperfusion on Sp-factors, the smaller fragments of Sp3 and Sp4 apparent on EMSA analysis of cultured neurons were not apparent in EMSA analysis of ischemic tissue. This may be a problem of sensitivity. The overall intensity of the DNA-binding products detectable in EMSA is diminished by glutamate treatment of cultured neurons; the smaller fragments are short-lived and somewhat more difficult to detect than is the activity of full-length Sp1, 3, or 4. Compared to the uniformity of exposure and responses of cultured neurons, a relatively small fraction of cells in the ischemic cerebrum are damaged by this insult. Furthermore, Sp1 and −3 present in the non-neuronal cell types of the cerebrum contribute to the total activity of full-length factors and are insensitive to glutamatergic stress. For these reasons, the proteolytic fragments would be expected to constitute a small fraction of the DNA-binding activity in the ischemic cerebrum, even a smaller fraction than the degree by which the full-length activity was diminished. Thus, a more reliable test of calpain’s role in the loss of Sp-factor activity in vivo would be application of calpain inhibitors in the ischemia/reperfusion model, and these studies are planned.
In addition to the calpain proteolysis documented here, other circumstances entail Sp1 cleavage by other proteases. Caspases are responsible for Sp1 proteolysis in lymphocytes (Piedrafita and Pfahl 1997; Rickers et al. 1999), and the DNA-binding patterns of these cleavage products are distinct from what was observed here. Caspase inhibitors can actually block calpain (Knoblach et al. 2004) or cathepsins (Gray et al. 2001), which may occasionally lead to the mistaken interpretation of a role for caspases when there is none. Even when the inhibitors specifically inhibit caspases, they can additionally inhibit calpain by stabilizing its inhibitor calpastatin (Wang et al. 1998). Regarding the cathepsins, these lysosomal proteases work optimally at a pH below 6.0. Neuronal cytosol is generally acidified by glutamate treatment; but it is not likely to be lower than pH 6.0, and the initial acidification recovers quickly (Hartley and Dubinsky 1993). It has also been reported that Sp1 can be cleaved by the proteasome at an aminoterminal site (Su et al. 1999). However, removal of such a small portion of a Sp-factor would have produced a DNA-binding remnant much larger than those we observed in glutamate-treated neurons. Moreover, proteasome activity is reportedly unaffected (Wei et al. 2005) or inhibited (Bobba et al. 2002) by glutamate receptor stimulation. Together, the data indicate that the G-C/T-binding species produced from Sp3 and Sp4 under our experimental conditions are not produced by caspases, cathepsins, or proteasomes. This is not to say that these proteases never attack Sp-factors, but they do not appear to contribute to the glutamate-triggered conversion of sequence-specific DNA binding by neuronal Sp-factors.
Emerging evidence indicates that calpains are important for a caspase-independent form of apoptosis associated with glutamate-evoked excitotoxicity. A considerable body of work has documented a form of programmed cell death that is unaffected by caspase inhibitors but depends on mitochondrial release of apoptosis-inducing factor (AIF) and endonuclease G (reviewed in Dawson and Dawson 2004). More recently, excitotoxicity via glutamate-receptor activation has been connected to this AIF pathway (Wang et al. 2004). The role of calpains in excitotoxic neuronal death is well documented (Siman et al. 1989; Brorson et al. 1994; Lankiewicz et al. 2000; Lee et al. 2000). Indeed, activation of calpain during excitotoxicity has been shown to block the conversion of pro-caspases into their active forms, thereby fostering caspase-independent pathways (Lankiewicz et al. 2000), and calpain can directly trigger the release of AIF from isolated mitochondria (Polster et al. 2005). The early and specific nature of calpain’s effects on Sp3 and Sp4 suggests a similarly “intentional” (physiologically appropriate) role for this event. This could reflect either a need for contained and nondisruptive neuronal removal or a compensatory attempt at neuroprotection (below).
There are two major calpains, defined by the calcium concentration required for their activities. These two enzymes differ in their large (catalytic) subunit, but they share the small (regulatory) subunit. Calpain I, also known as μ(mu)-calpain, needs only micromolar calcium, while calpain II (m-calpain) requires millimolar calcium for its activity. However, these calcium affinities were determined with purified enzymes in vitro, and several factors may dramatically affect these values in intact cells (Goll et al. 2003); roles for each calpain have been clearly established in vivo, even though intracellular calcium levels are thought never to exceed 10−5 M. Except for the differential calcium requirements, both calpains function similarly, including a nearly identical substrate preference. We found that calpain I and calpain II were both capable of degrading neuronal Sp-factors, but calpain II required higher concentrations. It is not clear whether this relationship reflects differences in enzyme preparation or purity. An array screening of the neocortical cells in our cultures showed more abundant detection of mRNA for calpain II than for calpain I (A. Moerman-Herzog & Barger, unpublished results), consistent with their relative expression levels in brain tissue (Li et al. 1996).
Calpain activity has been implicated in a wide variety of vertebrate neurodegenerative conditions, including ischemic conditions like those modeled here (reviewed in Ray and Banik 2003). Together with the dependence of excitotoxicity on calcium, these findings support a role for excitotoxicity as a common contributor to many neurodegenerative conditions, both acute and chronic. Calpain seems particularly relevant to Alzheimer’s disease and models thereof. Alzheimer brains show evidence of calpain hyperactivity (Saito et al. 1993), and calpains mediate neurotoxicity of amyloid β-peptide (Aβ) (Lee et al. 2000), the primary constituent of pathognomonic Alzheimer plaques. The excitotoxin kainic acid activates calpains to cause pathological changes in Tau protein (Higuchi et al. 2005), which forms another key component of Alzheimer pathology. Furthermore, considerable evidence now suggests that Alzheimer pathogenesis involves inflammatory activation of microglia, and we have documented mechanisms through which such “malactivated” microglia release the cooperative excitotoxins glutamate (Barger and Basile 2001) and D-serine (Wu et al. 2004). These NMDA receptor agonists would be expected to elevate intraneuronal calcium levels and, thus, calpain activity.
The data reported here represent substantial characterization of the effect of glutamate on Sp-factors. As in our previous studies, glutamate’s effect on neuronal Sp-factor activity was associated only with treatment conditions that are neurotoxic, suggesting that this process has limited application to normal physiological events. The proteolysis of these transcription factors could cause a detrimental loss-of-function effect, as proposed for Sp1 sequestration in Huntington’s disease (Dunah et al. 2002) and myotonic dystrophy (Ebralidze et al. 2004). It is also possible that the proteolysis of Sp3 and Sp4 represents a compensatory response, e.g., to reduce NR1 expression. Although ectopic expression of Sp1 in neurons is protective, Sp3 and Sp4 have distinct functions and might be counter-productive under conditions of stress. Notably, we have recently observed that the Sp-factors in neurons suppress transcription dependent upon a cis element in the gene for superoxide dismutase-2 (Mao et al., manuscript under review), a key neuroprotective antioxidant.
Acknowledgments
This work was supported by NIH grant R01NS046439.
References
- Bai G, Kusiak JW. Nerve growth factor up-regulates the N-methyl-D-aspartate receptor subunit 1 promoter in PC12 cells. J Biol Chem. 1997;272:5936–5942. doi: 10.1074/jbc.272.9.5936. [DOI] [PubMed] [Google Scholar]
- Barger SW, Basile AS. Activation of microglia by secreted amyloid precursor protein evokes release of glutamate by cystine exchange and attenuates synaptic function. J Neurochem. 2001;76:846–854. doi: 10.1046/j.1471-4159.2001.00075.x. [DOI] [PubMed] [Google Scholar]
- Barger SW, Moerman AM, Mao X. Molecular mechanisms of cytokine-induced neuroprotection: NFκB and neuroplasticity. Curr Pharm Des. 2005;11:985–998. doi: 10.2174/1381612053381594. [DOI] [PubMed] [Google Scholar]
- Birnbaum MJ, van Wijnen AJ, Odgren PR, Last TJ, Suske G, Stein GS, Stein JL. Sp1 trans-activation of cell cycle regulated promoters is selectively repressed by Sp3. Biochemistry. 1995;34:16503–16508. doi: 10.1021/bi00050a034. [DOI] [PubMed] [Google Scholar]
- Bobba A, Canu N, Atlante A, Petragallo V, Calissano P, Marra E. Proteasome inhibitors prevent cytochrome c release during apoptosis but not in excitotoxic death of cerebellar granule neurons. FEBS Lett. 2002;515:8–12. doi: 10.1016/s0014-5793(02)02231-7. [DOI] [PubMed] [Google Scholar]
- Bodles AM, Barger SW. Secreted β-amyloid precursor protein activates microglia via JNK and p38-MAPK. Neurobiol Aging. 2005;26:9–16. doi: 10.1016/j.neurobiolaging.2004.02.022. [DOI] [PubMed] [Google Scholar]
- Bouwman P, Philipsen S. Regulation of the activity of Sp1-related transcription factors. Mol Cell Endocrinol. 2002;195:27–38. doi: 10.1016/s0303-7207(02)00221-6. [DOI] [PubMed] [Google Scholar]
- Bouwman P, Gollner H, Elsasser HP, Eckhoff G, Karis A, Grosveld F, Philipsen S, Suske G. Transcription factor Sp3 is essential for post-natal survival and late tooth development. Embo J. 2000;19:655–661. doi: 10.1093/emboj/19.4.655. [DOI] [PMC free article] [PubMed] [Google Scholar]
- Brorson JR, Manzolillo PA, Miller RJ. Ca2+ entry via AMPA/KA receptors and excitotoxicity in cultured cerebellar Purkinje cells. J Neurosci. 1994;14:187–197. doi: 10.1523/JNEUROSCI.14-01-00187.1994. [DOI] [PMC free article] [PubMed] [Google Scholar]
- Buddle M, Eberhardt E, Ciminello LH, Levin T, Wing R, DiPasquale K, Raley-Susman KM. Microtubule-associated protein 2 (MAP2) associates with the NMDA receptor and is spatially redistributed within rat hippocampal neurons after oxygen-glucose deprivation. Brain Res. 2003;978:38–50. doi: 10.1016/s0006-8993(03)02758-6. [DOI] [PubMed] [Google Scholar]
- Chen CS, Chen WN, Zhou M, Arttamangkul S, Haugland RP. Probing the cathepsin D using a BODIPY FL-pepstatin A: applications in fluorescence polarization and microscopy. J Biochem Biophys Methods. 2000;42:137–151. doi: 10.1016/s0165-022x(00)00048-8. [DOI] [PubMed] [Google Scholar]
- Dawson VL, Dawson TM. Deadly conversations: nuclear-mitochondrial cross-talk. J Bioenerg Biomembr. 2004;36:287–294. doi: 10.1023/B:JOBB.0000041755.22613.8d. [DOI] [PubMed] [Google Scholar]
- Dunah AW, Jeong H, Griffin A, Kim YM, Standaert DG, Hersch SM, Mouradian MM, Young AB, Tanese N, Krainc D. Sp1 and TAFII130 transcriptional activity disrupted in early Huntington’s disease. Science. 2002;296:2238–2243. doi: 10.1126/science.1072613. [DOI] [PubMed] [Google Scholar]
- Ebralidze A, Wang Y, Petkova V, Ebralidse K, Junghans RP. RNA leaching of transcription factors disrupts transcription in myotonic dystrophy. Science. 2004;303:383–387. doi: 10.1126/science.1088679. [DOI] [PubMed] [Google Scholar]
- Goll DE, Thompson VF, Li H, Wei W, Cong J. The calpain system. Physiol Rev. 2003;83:731–801. doi: 10.1152/physrev.00029.2002. [DOI] [PubMed] [Google Scholar]
- Gollner H, Bouwman P, Mangold M, Karis A, Braun H, Rohner I, Del Rey A, Besedovsky HO, Meinhardt A, van den Broek M, Cutforth T, Grosveld F, Philipsen S, Suske G. Complex phenotype of mice homozygous for a null mutation in the Sp4 transcription factor gene. Genes Cells. 2001;6:689–697. doi: 10.1046/j.1365-2443.2001.00455.x. [DOI] [PubMed] [Google Scholar]
- Gray J, Haran MM, Schneider K, Vesce S, Ray AM, Owen D, White IR, Cutler P, Davis JB. Evidence that inhibition of cathepsin-B contributes to the neuroprotective properties of caspase inhibitor Tyr-Val-Ala-Asp-chloromethyl ketone. J Biol Chem. 2001;276:32750–32755. doi: 10.1074/jbc.M103150200. [DOI] [PubMed] [Google Scholar]
- Hagen G, Dennig J, Preiss A, Beato M, Suske G. Functional analyses of the transcription factor Sp4 reveal properties distinct from Sp1 and Sp3. J Biol Chem. 1995;270:24989–24994. doi: 10.1074/jbc.270.42.24989. [DOI] [PubMed] [Google Scholar]
- Hardy M, Younkin D, Tang CM, Pleasure J, Shi QY, Williams M, Pleasure D. Expression of non-NMDA glutamate receptor channel genes by clonal human neurons. J Neurochem. 1994;63:482–489. doi: 10.1046/j.1471-4159.1994.63020482.x. [DOI] [PubMed] [Google Scholar]
- Hartley Z, Dubinsky JM. Changes in intracellular pH associated with glutamate excitotoxicity. J Neurosci. 1993;13:4690–4699. doi: 10.1523/JNEUROSCI.13-11-04690.1993. [DOI] [PMC free article] [PubMed] [Google Scholar]
- Higuchi M, Tomioka M, Takano J, Shirotani K, Iwata N, Masumoto H, Maki M, Itohara S, Saido TC. Distinct mechanistic roles of calpain and caspase activation in neurodegeneration as revealed in mice overexpressing their specific inhibitors. J Biol Chem. 2005;280:15229–15237. doi: 10.1074/jbc.M500939200. [DOI] [PubMed] [Google Scholar]
- Knoblach SM, Alroy DA, Nikolaeva M, Cernak I, Stoica BA, Faden AI. Caspase inhibitor z-DEVD-fmk attenuates calpain and necrotic cell death in vitro and after traumatic brain injury. J Cereb Blood Flow Metab. 2004;24:1119–1132. doi: 10.1097/01.WCB.0000138664.17682.32. [DOI] [PubMed] [Google Scholar]
- Kwon HS, Kim MS, Edenberg HJ, Hur MW. Sp3 and Sp4 can repress transcription by competing with Sp1 for the core cis-elements on the human ADH5/FDH minimal promoter. J Biol Chem. 1999;274:20–28. doi: 10.1074/jbc.274.1.20. [DOI] [PubMed] [Google Scholar]
- Lankiewicz S, Marc Luetjens C, Truc Bui N, Krohn AJ, Poppe M, Cole GM, Saido TC, Prehn JH. Activation of calpain I converts excitotoxic neuron death into a caspase-independent cell death. J Biol Chem. 2000;275:17064–17071. doi: 10.1074/jbc.275.22.17064. [DOI] [PubMed] [Google Scholar]
- Lee MS, Kwon YT, Li M, Peng J, Friedlander RM, Tsai LH. Neurotoxicity induces cleavage of p35 to p25 by calpain. Nature. 2000;405:360–364. doi: 10.1038/35012636. [DOI] [PubMed] [Google Scholar]
- Li J, Grynspan F, Berman S, Nixon R, Bursztajn S. Regional differences in gene expression for calcium activated neutral proteases (calpains) and their endogenous inhibitor calpastatin in mouse brain and spinal cord. J Neurobiol. 1996;30:177–191. doi: 10.1002/(SICI)1097-4695(199606)30:2<177::AID-NEU1>3.0.CO;2-2. [DOI] [PubMed] [Google Scholar]
- Liu A, Hoffman PW, Lu W, Bai G. NF-kappaB site interacts with Sp factors and up-regulates the NR1 promoter during neuronal differentiation. J Biol Chem. 2004;279:17449–17458. doi: 10.1074/jbc.M311267200. [DOI] [PubMed] [Google Scholar]
- Mao X, Moerman AM, Barger SW. Neuronal κB-binding factors consist of Sp1-related proteins: Functional implications for autoregulation of NR1 expression. J Biol Chem. 2002;277:44911–44919. doi: 10.1074/jbc.M204292200. [DOI] [PubMed] [Google Scholar]
- Mao X, Moerman AM, Lucas MM, Barger SW. Inhibition of the activity of a neuronal κB-binding factor (NKBF) by glutamate. J Neurochem. 1999;73:1851–1858. [PubMed] [Google Scholar]
- Marin M, Karis A, Visser P, Grosveld F, Philipsen S. Transcription factor Sp1 is essential for early embryonic development but dispensable for cell growth and differentiation. Cell. 1997;89:619–628. doi: 10.1016/s0092-8674(00)80243-3. [DOI] [PubMed] [Google Scholar]
- Moerman AM, Barger SW. Inhibition of AMPA responses by mutated presenilin 1. J Neurosci Res. 1999;57:962–967. [PubMed] [Google Scholar]
- Moerman AM, Mao X, Lucas MM, Barger SW. Characterization of a neuronal B-binding factor distinct from NF-κB. Mol Brain Res. 1999;67:303–315. doi: 10.1016/s0169-328x(99)00091-1. [DOI] [PubMed] [Google Scholar]
- Nicolas M, Noe V, Ciudad CJ. Transcriptional regulation of the human Sp1 gene promoter by the specificity protein (Sp) family members nuclear factor Y (NF-Y) and E2F. Biochem J. 2003;371:265–275. doi: 10.1042/BJ20021166. [DOI] [PMC free article] [PubMed] [Google Scholar]
- Okamoto S, Sherman K, Bai G, Lipton SA. Effect of the ubiquitous transcription factors, SP1 and MAZ, on NMDA receptor subunit type 1 (NR1) expression during neuronal differentiation. Brain Res Mol Brain Res. 2002;107:89–96. doi: 10.1016/s0169-328x(02)00440-0. [DOI] [PubMed] [Google Scholar]
- Piedrafita FJ, Pfahl M. Retinoid-induced apoptosis and Sp1 cleavage occur independently of transcription and require caspase activation. Mol Cell Biol. 1997;17:6348–6358. doi: 10.1128/mcb.17.11.6348. [DOI] [PMC free article] [PubMed] [Google Scholar]
- Pleasure SJ, Lee VM. NTera 2 cells: a human cell line which displays characteristics expected of a human committed neuronal progenitor cell. J Neurosci Res. 1993;35:585–602. doi: 10.1002/jnr.490350603. [DOI] [PubMed] [Google Scholar]
- Polster BM, Basanez G, Etxebarria A, Hardwick JM, Nicholls DG. Calpain I induces cleavage and release of apoptosis-inducing factor from isolated mitochondria. J Biol Chem. 2005;280:6447–6454. doi: 10.1074/jbc.M413269200. [DOI] [PubMed] [Google Scholar]
- Ray SK, Banik NL. Calpain and its involvement in the pathophysiology of CNS injuries and diseases: therapeutic potential of calpain inhibitors for prevention of neurodegeneration. Curr Drug Targets CNS Neurol Disord. 2003;2:173–189. doi: 10.2174/1568007033482887. [DOI] [PubMed] [Google Scholar]
- Ray SK, Matzelle DC, Wilford GG, Hogan EL, Banik NL. E-64-d prevents both calpain upregulation and apoptosis in the lesion and penumbra following spinal cord injury in rats. Brain Res. 2000;867:80–89. doi: 10.1016/s0006-8993(00)02260-5. [DOI] [PubMed] [Google Scholar]
- Rickers A, Peters N, Badock V, Beyaert R, Vandenabeele P, Dorken B, Bommert K. Cleavage of transcription factor SP1 by caspases during anti-IgM-induced B-cell apoptosis. Eur J Biochem. 1999;261:269–274. doi: 10.1046/j.1432-1327.1999.00273.x. [DOI] [PubMed] [Google Scholar]
- Ryu H, Lee J, Zaman K, Kubilis J, Ferrante RJ, Ross BD, Neve R, Ratan RR. Sp1 and Sp3 are oxidative stress-inducible, antideath transcription factors in cortical neurons. J Neurosci. 2003;23:3597–3606. doi: 10.1523/JNEUROSCI.23-09-03597.2003. [DOI] [PMC free article] [PubMed] [Google Scholar]
- Saito K, Elce JS, Hamos JE, Nixon RA. Widespread activation of calcium-activated neutral proteinase (calpain) in the brain in Alzheimer disease: a potential molecular basis for neuronal degeneration. Proc Natl Acad Sci (USA) 1993;90:2628–2632. doi: 10.1073/pnas.90.7.2628. [DOI] [PMC free article] [PubMed] [Google Scholar]
- Sakai T, Furukawa T, Iwanari H, Oka C, Nakano T, Kawaichi M, Honjo T. Loss of immunostaining of the RBP-J kappa transcription factor upon F9 cell differentiation induced by retinoic acid. J Biochem (Tokyo) 1995;118:621–628. doi: 10.1093/oxfordjournals.jbchem.a124955. [DOI] [PubMed] [Google Scholar]
- Sapetschnig A, Koch F, Rischitor G, Mennenga T, Suske G. Complexity of translationally controlled transcription factor Sp3 isoform expression. J Biol Chem. 2004;279:42095–42105. doi: 10.1074/jbc.M404989200. [DOI] [PubMed] [Google Scholar]
- Siman R, Noszek JC, Kegerise C. Calpain I activation is specifically related to excitatory amino acid induction of hippocampal damage. J Neurosci. 1989;9:1579–1590. doi: 10.1523/JNEUROSCI.09-05-01579.1989. [DOI] [PMC free article] [PubMed] [Google Scholar]
- Simon RP, Swan JH, Griffiths T, Meldrum BS. Blockade of N-methyl-D-aspartate receptors may protect against ischemic damage in the brain. Science. 1984;226:850–852. doi: 10.1126/science.6093256. [DOI] [PubMed] [Google Scholar]
- Song J, Mangold M, Suske G, Geltinger C, Kanazawa I, Sun K, Yokoyama KK. Characterization and promoter analysis of the mouse gene for transcription factor Sp4. Gene. 2001;264:19–27. doi: 10.1016/s0378-1119(01)00328-6. [DOI] [PubMed] [Google Scholar]
- Su K, Roos MD, Yang X, Han I, Paterson AJ, Kudlow JE. An N-terminal region of Sp1 targets its proteasome-dependent degradation in vitro. J Biol Chem. 1999;274:15194–15202. doi: 10.1074/jbc.274.21.15194. [DOI] [PubMed] [Google Scholar]
- Supp DM, Witte DP, Branford WW, Smith EP, Potter SS. Sp4, a member of the Sp1-family of zinc finger transcription factors, is required for normal murine growth, viability, and male fertility. Dev Biol. 1996;176:284–299. doi: 10.1006/dbio.1996.0134. [DOI] [PubMed] [Google Scholar]
- Suske G. The Sp-family of transcription factors. Gene. 1999;238:291–300. doi: 10.1016/s0378-1119(99)00357-1. [DOI] [PubMed] [Google Scholar]
- Takano J, Tomioka M, Tsubuki S, Higuchi M, Iwata N, Itohara S, Maki M, Saido TC. Calpain mediates excitotoxic DNA fragmentation via mitochondrial pathways in adult brains: evidence from calpastatin mutant mice. J Biol Chem. 2005;280:16175–16184. doi: 10.1074/jbc.M414552200. [DOI] [PubMed] [Google Scholar]
- Wang H, Yu SW, Koh DW, Lew J, Coombs C, Bowers W, Federoff HJ, Poirier GG, Dawson TM, Dawson VL. Apoptosis-inducing factor substitutes for caspase executioners in NMDA-triggered excitotoxic neuronal death. J Neurosci. 2004;24:10963–10973. doi: 10.1523/JNEUROSCI.3461-04.2004. [DOI] [PMC free article] [PubMed] [Google Scholar]
- Wang KK, Posmantur R, Nadimpalli R, Nath R, Mohan P, Nixon RA, Talanian RV, Keegan M, Herzog L, Allen H. Caspase-mediated fragmentation of calpain inhibitor protein calpastatin during apoptosis. Arch Biochem Biophys. 1998;356:187–196. doi: 10.1006/abbi.1998.0748. [DOI] [PubMed] [Google Scholar]
- Wei FY, Tomizawa K, Ohshima T, Asada A, Saito T, Nguyen C, Bibb JA, Ishiguro K, Kulkarni AB, Pant HC, Mikoshiba K, Matsui H, Hisanaga S. Control of cyclin-dependent kinase 5 (Cdk5) activity by glutamatergic regulation of p35 stability. J Neurochem. 2005;93:502–512. doi: 10.1111/j.1471-4159.2005.03058.x. [DOI] [PubMed] [Google Scholar]
- Wu S-Z, Bodles AM, Porter MM, Griffin WST, Basile AS, Barger SW. Induction of serine racemase expression and D-serine release from microglia by amyloid β peptide. J Neuroinflammation. 2004;1:2–12. doi: 10.1186/1742-2094-1-2. [DOI] [PMC free article] [PubMed] [Google Scholar]
- Yang SH, Perez E, Cutright J, Liu R, He Z, Day AL, Simpkins JW. Testosterone increases neurotoxicity of glutamate in vitro and ischemia-reperfusion injury in an animal model. J Appl Physiol. 2002;92:195–201. doi: 10.1152/jappl.2002.92.1.195. [DOI] [PubMed] [Google Scholar]
- Zhang J, Miyamoto K, Hashioka S, Hao HP, Murao K, Saido TC, Nakanishi H. Activation of μ-calpain in developing cortical neurons following methylmercury treatment. Dev Brain Res. 2003;142:105–110. doi: 10.1016/s0165-3806(03)00057-9. [DOI] [PubMed] [Google Scholar]
- Zhou X, Long JM, Geyer MA, Masliah E, Kelsoe JR, Wynshaw-Boris A, Chien KR. Reduced expression of the Sp4 gene in mice causes deficits in sensorimotor gating and memory associated with hippocampal vacuolization. Mol Psychiatry. 2005;10:393–406. doi: 10.1038/sj.mp.4001621. [DOI] [PubMed] [Google Scholar]