

Abstract
To investigate the role of BAX in chemotherapy-induced apoptosis, we transfected the SW626 human ovarian cancer cell line, which lacks functional p53, with a cDNA encoding for murine BAX. Immunoblotting revealed that BAX transfectants expressed a mean of 10-fold increased levels of BAX compared with neo-transfected control clones, with similar levels of BCL-2 and BCL-xL. The cytotoxicity of paclitaxel, vincristine, and doxorubicin was significantly enhanced in BAX transfectants compared with control clones, whereas the cytotoxicity profile of carboplatin, etoposide, and hydroxyurea was unchanged. Increased paclitaxel-induced cytotoxicity of BAX clones was associated with enhanced apoptosis, as assessed by morphologic and flow cytometric criteria. These data suggest that sufficient levels of BAX may bypass the need for upstream molecules such as p53 in the process of chemotherapy-induced apoptosis.
Keywords: drug resistance, chemotherapy, ovarian, cancer
Apoptosis is a form of cell death characterized by active cellular suicide during T-cell clonal deletion, embryogenesis, and DNA damage. Apoptotic cell death is often associated with distinctive characteristics, such as nuclear fragmentation, cytoplasmic blebbing, and internucleosomal fragmentation of DNA (1). Whether a cell becomes committed to apoptosis partly depends upon the balance between proteins that mediate cell death, such as BAX, and proteins that promote cell viability, such as BCL-2 or BCL-xL (2, 3, 4). Overexpression of BAX has been shown to accelerate the cell death of murine FL5.12 cells after interleukin 3 withdrawal, an effect that is associated with the formation of BAX/BAX homodimers (2). Conversely, overexpression of antiapoptotic proteins such as BCL-2 and BCL-xL represses the death function of BAX, which is associated with the formation of BCL-2/BAX or BCL-xL/BAX heterodimers. Thus, the ratio of BAX to either BCL-2 or BCL-xL appears to be a critical determinant of a cell’s threshold for undergoing apoptosis (3). Although the proximal mechanisms for activating the expression and function of BCL-2, BCL-xL, and BAX are not fully understood, it is possible that the p53 molecule plays a role in this process. For instance, it has been shown that wild-type p53 is capable of both down-regulating BCL-2 and up-regulating BAX, thereby predisposing to programmed cell death (5, 6).
It is now known that the cytotoxic effects of many forms of chemotherapy and ionizing radiation are mediated through a final common pathway that involves the activation of apoptosis (7, 8). For instance, exposure of cells to a variety of cytotoxic agents including platinum analogs and taxanes is associated with morphologic changes of apoptosis and, in some cases, internucleosomal DNA fragmentation (9, 10). These observations have lead to the hypothesis that an intact apoptotic pathway is necessary for chemotherapy-induced cell death and, conversely, that abnormalities in the ability of a cell to undergo apoptosis may lead to the development of chemotherapy resistance. In this regard, it has been shown that cells that are functionally deficient in p53 or that express elevated levels of either BCL-2 or BCL-xL are relatively resistant to cytotoxic agents such as platinum analogs (8, 9, 11).
Ovarian cancer is an epithelial malignancy that demonstrates a high degree of chemosensitivity to drugs such as paclitaxel and platinum analogs (such as cisplatin or carboplatin; ref. 12). Interestingly, mutations of the p53 gene are commonly observed in ovarian cancer, despite the fact that this tumor is often responsive to chemotherapy (13). This observation raises the possibility that downstream molecules such as BAX may bypass the need for p53 in some forms of chemotherapy-induced apoptosis. In this report, we have investigated the effects of BAX on the sensitivity of ovarian cancer cells to a variety of chemotherapeutic agents, including paclitaxel. We now demonstrate that BAX enhances apoptotic cell death in response to paclitaxel in a p53-independent manner. The implications for the development of drug resistance in ovarian cancer are discussed.
METHODS
Source of Cells and Reagents.
The SW626 ovarian epithelial carcinoma cell line used for transfection and drug sensitivity studies was obtained from the American Type Culture Collection. Cells were cultured in Dulbecco’s modified Eagle’s medium (DMEM; Sigma) supplemented with 10% fetal calf serum (FCS; HyClone). Propidium iodide used for assessment of DNA content was purchased from Sigma. Paclitaxel, carboplatin (CBDCA), and etoposide were purchased from Bristol-Myers Squibb. Doxorubicin was purchased from Pharmacia. Vincristine was purchased from Eli Lilly. The previously described plasmid encoding the temperature-sensitive (ts) val135 mutant of p53 under the control of the Harvey sarcoma virus long terminal repeat was a kind gift of Moshe Oren (Weizmann Institute, Rehovot, Israel; ref. 14).
Generation of Stable Transfectants.
Lipofection was used to generate stable SW626 clones expressing either pSV2-neo alone (a kind gift of Michel Streuli, Dana–Farber Cancer Institute) or the previously described murine BAX cDNA present in an hemagglutinin (HA)/pSFFV-expression vector (HA-BAX; ref. 2). For some experiments, stable transfectants expressing the tsp53 protein were also generated for use as positive controls for p53 expression and function. SW626 cells were grown to 50% confluence in the presence of 10% FCS/DMEM in 35-mm diameter tissue culture dishes. For each lipofection, a total of 2 μg of DNA (10:1 ratio of HA-BAX/pSV2-neo cDNA) was added to 100 μl of serum-free medium comprised of Iscove’s modified Dulbecco’s medium (IMDM) containing 1 μg of insulin per ml, 5 μM transferrin, 10 μg of cholesterol per ml (Sigma), followed by addition of 110 μl of lipofectAMINE solution (Life Technologies, Gaithersburg, MD). After incubation at room temperature for 45 min, 800 μl of serum-free medium was added to the DNA mixture, bringing the total volume to ≈1 ml. The adherent cells were washed twice in serum-free medium, followed by addition of the 1-ml DNA mixture to the culture dish. After incubation for 6 hr (37°C, 5% CO2), the cells were washed once in 10% FCS/DMEM (without antibiotics), followed by addition of 2 ml of the same medium. After an 18-hr incubation (37°C, 5% CO2), the medium was replaced with fresh 10% FCS/DMEM, containing 50 units of penicillin and streptomycin per ml. After an additional 24-hr incubation at 37°C, fresh medium was provided containing 500 μg of G418 per ml, followed by continued incubation for up to 3 weeks, during which neomycin-resistant cells were identified and cloned by limiting dilution.
Antibodies.
Primary antibodies used for characterization of SW626 transfectants in immunoblot analysis are as follows: Murine anti-HA monoclonal antibody (1:2000 dilution; Boehringer Mannheim); rabbit anti-human BAX polyclonal antibody (1:1000 dilution; Santa Cruz Biotechnology); murine anti-human BCL-2 (1:1000 dilution; Dako); murine anti-human BCL-xL (1:2000 dilution, clone 2A1; a kind gift of Craig Thompson, University of Chicago, Chicago, IL); rabbit anti-human p21 (clone C19, 1:1000 dilution; Santa Cruz Biotechnology); murine anti-mammalian p53 monoclonal antibody (1:2000 dilution, clone PAb240; Oncogene Science); murine anti-human mdm-2 (1:100 dilution, clone SMP14; Santa Cruz Biotechnology); and murine anti-human tubulin (1:10,000 dilution; Sigma). Secondary antibodies were either goat anti-rabbit-Ig conjugated to horseradish peroxidase (1:3000 dilution; Caltag, South San Francisco, CA) or sheep anti-mouse Ig conjugated to horseradish peroxidase (1:5000 dilution; Amersham), as appropriate. The 4E3 murine anti-human MDR-1 antibody reactive with P-glycoprotein was used in flow cytometric analysis as previously described and was a kind gift of James Croop (Dana–Farber Cancer Institute; ref. 15).
Immunoblotting.
Lysates (50 μg per lane) were resolved by one-dimensional SDS-PAGE under reducing conditions, followed by transfer onto a 0.45-μm polyvinylidene difluoride (PVDF) membrane (Millipore) in transfer buffer at 0.2 A for 2 hr (16). A 12.5% polyacrylamide concentration was used to permit adequate resolution of molecules migrating in the 20- to 30-kDa range. After transfer, residual binding sites were blocked by incubating the membrane in Tris-buffered saline (TBS) containing 10% nonfat dry milk for 1 hr at RT. The blots were then incubated with the appropriate primary antibody in TBS with 0.05% Tween-20 (TBST) containing 5% nonfat dry milk for 16 hr at 4°C. The blots were then washed three times for 10 min in TBST, followed by incubation with the secondary antibody conjugated to horseradish peroxidase in TBST containing 5% nonfat dry milk for 1 hr at room temperature. After three washes for 10 minutes in TBST, the blots were developed using the enhanced chemiluminescence (ECL) detection system (Amersham) according to the manufacturer’s protocol and exposed to x-ray film (Eastman Kodak).
Cytotoxicity Assay.
The relationship between drug dose and cytotoxicity was determined for each SW626 transfectant in suspension culture during continuous exposure to drug. Cells were seeded (2.5 × 10⁴ cells per well) in 24-well plates (Falcon) in 10% FCS/DMEM in the presence or absence of a variety of cytotoxic drugs over a broad concentration range, followed by incubation (37°C, 5% CO2) and daily assessment of viable cell numbers by trypan blue exclusion. For some experiments, cytotoxicity was assessed at day 3 over a broad drug concentration range, and in other experiments, a fixed dose of drug was used over a 5-day treatment course. Cell counts were performed in duplicate for each drug dose and time point, with the SEM typically being <15%. The percent survival was defined as 100 × [viable cell number(drug)/viable cell number(medium)] at the identical time point. This definition allows direct comparison of viability in the drug-treated group to what would be expected in the absence of either a cytotoxic or cytostatic insult. In addition to cell counts, cytocentrifuge preparations were made and stained with Wrights–Giemsa, followed by assessment of morphologic evidence of apoptosis as previously described (1).
Quantitation of Sub-G0 DNA Content by Propidium Iodide (PI) Staining.
The fraction of cells containing a sub-G0 DNA content has been shown to correlate with apoptotic cell death and was quantitated by flow cytometry as previously described (17). Briefly, 0.5 × 10⁶ cells per sample were pelletted and resuspended in 50 μg of PI per ml (Sigma) in 0.1% sodium citrate and 0.1% Nonidet P-40, resulting in lysis of the cell membrane while maintaining integrity of the nucleus. After a 10-min incubation at room temperature, 10,000 cells per sample were analyzed by flow cytometry on an Epics V cell sorter (Coulter), with quantitation of the fraction of cells present in the sub-G0/G1 peak.
Statistical Analysis.
Data are expressed as mean ± SEM where appropriate. Significance levels for comparison of LD50 values were determined using the two-sided Student’s t test for unpaired samples.
RESULTS
Characterization of p53 Status in the SW626 Ovarian Cancer Cell Line.
SW626 ovarian cancer cells were selected for this study, since pilot experiments using several ovarian cancer cell lines (SW626, CAOV-3, SKOV-3, OVCAR-3, and UPN36T; ref. 16) revealed that SW626 cells demonstrated high transfection efficiency of BAX cDNA. Since one of our goals was to determine whether BAX could bypass the need for p53 in mediating chemotherapy-induced apoptosis, it was necessary to ensure that SW626 cells lacked functional p53. Wild-type p53 is rapidly up-regulated after radiation-induced DNA damage, associated with transactivation of the p21 and mdm-2 genes (18, 19). Therefore, we exposed SW626 cells to 1000 R of ionizing radiation, followed by assessment of p53, p21, and mdm-2 expression over 72 hr by immunoblot analysis. Fig. 1A shows expression of p53 in irradiated SW626 cells, as well as in two SW626 clonal transfectants, using the PAb 240 antibody, which recognizes both mutant and wild-type mammalian p53 on immunoblotting (20). There was no detectable expression of p53 in the irradiated SW626 parent cell line over a 72-hr period (Fig. 1A). The p53 protein was also absent in SW626 cells transfected with pSV2-neo cDNA (clone neo B10) but easily detectable in cells transfected with the tsp53val135 mutant cDNA (tsp53 H10 clone), as expected (Fig. 1A). Expression of the p53-inducible proteins p21 and mdm-2 was next examined in Fig. 1B. Consistent with the absence of inducible p53 in SW626 cells, irradiated SW626 cells failed to demonstrate transactivation of p21 or mdm-2 over a 72-hr period. The tsp53 clone H10 was used as a control for p53 transactivation, which occurs when the mutant protein acquires wild-type function at the permissive temperature of 32°C (but not at 37°C). As expected, tsp53 clone H10 demonstrated inducible expression of p21 and mdm-2 when incubated for 18 hr at 32°C, but not at 37°C. This served as a positive control for detection of p21 and mdm-2, as well as for the ability of SW626 cells to express these proteins in the presence of functional p53. Lysate quality and equivalency of loading was confirmed in Fig. 1 A and B by tubulin staining. Taken together, these data demonstrate lack of p53 protein and function in SW626 cells.
Figure 1.
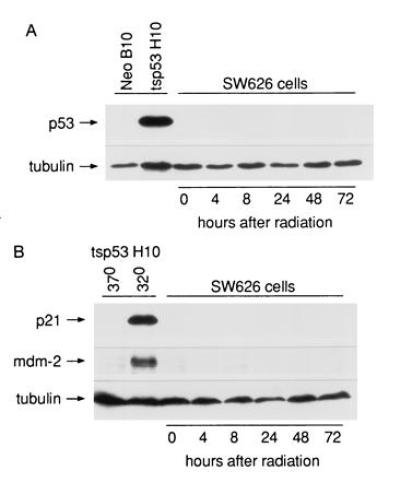
p53 expression and function in SW626 cells. SW626 cells were treated with 1000 R of ionizing radiation and incubated for up to 72 hr, followed by immunoblot analysis for detection of p53, p21, mdm-2, and tubulin as indicated. This dose of radiation kills over 50% of SW626 cells, as assessed by trypan blue exclusion at 72 hr (data not shown). SW626 transfectants expressing the neomycin resistance gene (neo clone B10) or the tsp53val135 cDNA (tsp53 clone H10) were used as controls for p53 expression (A) or for p21 and mdm-2 expression (B). (A) Immunoblot of SW626 lysates developed using the PAB240 anti-p53 antibody, which recognizes both wild-type and mutant forms of mammalian p53. (B) Immunoblot analysis of p21 and mdm-2 expression in irradiated SW626 cells. The expression of p21 and mdm-2 in SW626 tsp53 clone H10 at the permissive temperature (32°C) demonstrates that SW626 cells are capable of expressing these proteins in the presence of functional p53.
Characterization of BAX Transfectants.
SW626 cells were transfected by lipofection with either pSV2-neo cDNA alone (neo-control cells) or with the previously described cDNA for HA-murine BAX (10:1 ratio of HA-BAX/pSV2-neo cDNA; ref. 2). A total of six clonal transfectants were characterized for the expression of BAX by immunoblotting with a polyclonal anti-BAX antibody, with the results shown in Fig. 2. The blots were stripped and reprobed for tubulin to correct for differences in protein loading between SW626 clones. Three neo-control transfectants (neo A10, B10, and F8) expressed relatively low levels of the expected p21 product characteristic of endogenous BAX (BAX/tubulin ratio by densitometry of 0.064, 0.036, and 0.15 for neo clones A10, B10, and F8, respectively; mean = 0.083 ± 0.05). In contrast, the three BAX transfectants (BAX A9, D7, and D8) displayed an intense band in the range of ≈24 kDa, characteristic of the HA-BAX protein. The identity of the 24-kDa species as HA-BAX was confirmed by performing immunoblotting with an anti-HA antibody, which revealed selective reactivity with only the 24-kDa species (data not shown). Quantitation of total BAX (endogenous p21 BAX plus transfected HA-BAX) revealed BAX/tubulin ratios of 0.632, 0.719, and 1.068 for HA-BAX clones A9, D7, and D8, respectively; mean = 0.81 ± 0.19). Thus, the relative levels of BAX in the three HA-BAX-expressing clones are ≈10-fold higher than those observed in neo-control clones. Total number of viable cells and the percentage of nonviable cells as assessed by trypan blue exclusion were similar for all clones over a 5-day incubation period, suggesting that HA-BAX overexpression did not significantly alter the growth rate of SW626 transfectants (data not shown). Finally, since the MDR-1 protein is known to mediate the resistance of multiple structurally unrelated cytotoxic drugs, including paclitaxel, we assessed the expression of this protein in SW626 transfectants by flow cytometry with the 4E3 monoclonal antibody (15). The MDR-1 protein was not expressed by any of the clones used in this study (percent specific reactivity with 4E3 antibody <5% for each clone; data not shown).
Figure 2.
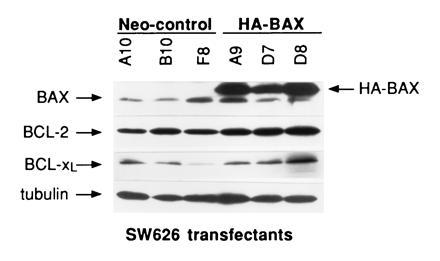
Characterization of BAX, BCL-2, and BCL-xL levels in SW626 transfectants. Immunoblot analysis was performed to compare BAX, BCL-2, and BCL-xL levels in neo-control clones to those in HA-BAX clones as indicated. Tubulin signals were also obtained to ensure equivalency of protein loading. The molecular masses of HA-BAX, BAX, BCL-2, BCL-xL, and tubulin were 24, 21, 26, 30, and 55 kDa, respectively. After correction for tubulin, the mean level of BAX in HA-BAX clones was ≈10-fold greater than that in neo-control clones (0.81 ± 0.19 versus 0.083 ± 0.05; P < 0.001). There was no evidence for decreased expression of BCL-2 or BCL-xL in HA-BAX clones compared with neo-control clones.
The Cytotoxicity of Paclitaxel, but Not CBDCA, Is Significantly Enhanced in the Presence of BAX.
To determine the effects of BAX expression on the sensitivity of ovarian cancer cells to paclitaxel and carboplatin, SW626 transfectants were grown in the presence of paclitaxel (0–0.2 μM) or CBDCA (0–25 μM) for 72 hr, with the percent viable cells determined by trypan blue exclusion. The data are shown in Fig. 3 and are expressed as the cumulative mean percent survival of HA-BAX clones A9, D7, and D8 compared with that of neo-control clones A10, B10, and F8. As shown in Fig. 3A, HA-BAX transfectants were significantly more sensitive to paclitaxel compared with neo-control clones. Specifically, the mean LD50 of paclitaxel in neo-control cells was 0.2 ± 0.03, compared with a value of 0.02 ± 0.01 in HA-BAX clones, corresponding to a 10-fold enhancement in chemosensitivity (mean ± SEM, P = 0.001, n = 3 separate experiments). In contrast, the dose response of SW626 cells to CBDCA was not affected by the presence of HA-BAX, with a mean LD50 of CBDCA in neo-control cells of 9.5 ± 2.0, compared with a mean value of 12.0 ± 3.0 in HA-BAX clones (Fig. 3B, mean ± SEM, P = 0.2, n = 3 experiments). To determine the effects of more prolonged paclitaxel exposure on cell kill, we assessed the cytotoxicity of a fixed dose of this drug (0.05 μM) over a 5-day period in a neo-control clone (A10) and an HA-BAX clone (A9). As shown in Fig. 3C, minimal cytotoxicity was observed for neo-control cells for up to 120 hr of drug exposure, whereas the majority of HA-BAX expressing cells were killed during this time period.
Figure 3.
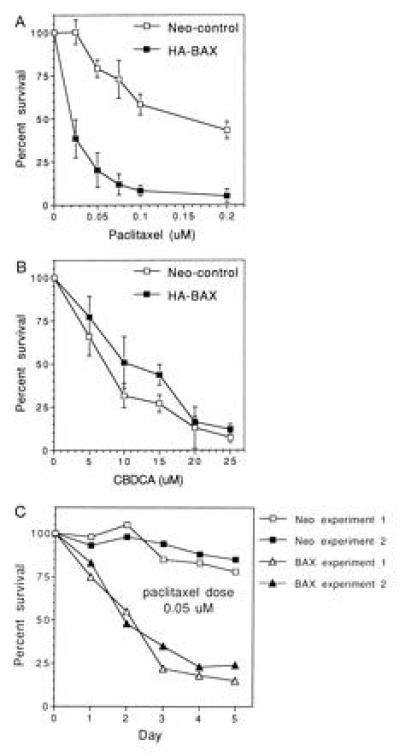
Cytotoxicity of paclitaxel and CBDCA in HA-BAX versus neo-control clones. SW626 transfectants were seeded onto 24-well plates and exposed to a range of paclitaxel and CBDCA concentrations as indicated. Cells were trypsinized and counted on day 3 (A and B) or daily for 5 days (C). Percent survival was assessed by trypan blue exclusion and expressed as the percentage of viable cells present in the treatment group compared with cells grown in medium alone at the identical time point. For A and B, data are expressed as the mean ± SEM percent survival of HA-BAX clones A9, D7, and D8 and of neo-control clones A10, B10, and F8. Data obtained for C are derived by using HA-BAX clone A9 and neo-control clone A10 and represent results from two separate experiments.
To further define the sensitivity profile of SW626 transfectants to chemotherapy, dose–response curves were generated in the presence of vincristine, doxorubicin, etoposide, and hydroxyurea, with the results presented in Table 1. As observed for paclitaxel, HA-BAX clones were significantly more sensitive to the effects of vincristine and doxorubicin, but not etoposide or hydroxyurea, than were neo-control clones.
Table 1.
Mean LD50 values for neo-control and HA-BAX SW626 transfectants
| Drug | LD50,* μM
|
P value† | LD50(neo)/ LD50(BAX) | |
|---|---|---|---|---|
| neo-control | HA-BAX | |||
| Paclitaxel | 0.20 ± 0.03 | 0.02 ± 0.01 | 0.001 | 10.0 |
| Vincristine | 0.142 ± 0.11 | 0.006 ± 0.001 | 0.0001 | 23.7 |
| Doxorubicin | 0.21 ± 0.07 | 0.035 ± 0.02 | 0.001 | 6.0 |
| CBDCA | 9.5 ± 2.0 | 12.0 ± 3.0 | 0.2 | 0.79 |
| VP-16 | 2.8 ± 0.8 | 2.6 ± 0.9 | 0.2 | 1.08 |
| Hydroxyurea | 0.025 ± 0.005 | 0.026 ± 0.009 | 0.2 | 0.96 |
Cells were grown at subconfluent density in plastic wells over a 3-day period in the presence of various drugs as indicated, followed by trypsinization and assessment of viability by trypan blue exclusion. LD50 values reflect the amount of drug necessary to achieve 50% cell kill compared to cells grown in medium alone. Data are expressed as mean ± SEM LD50 for either neo-control clones (n = 3, clones B10, A10, and F8) or HA-BAX clones (n = 3, clones D8, A9, and D7), as indicated.
P values determined by two-sided Student’s t test. Significant enhancement of cytotoxicity was observed in HA-BAX-expressing clones treated with paclitaxel, vincristine, and doxorubicin.
Paclitaxel-Induced Cell Death in HA-BAX Clones Is Mediated by Apoptosis.
In pilot experiments, we were unable to demonstrate the formation of internucleosomal DNA fragments in SW626 cells exposed to agents known to induce apoptotic cell death (such as platinum, paclitaxel, or ionizing radiation). This is consistent with previous reports demonstrating that internucleosomal DNA fragmentation is not always observed during apoptosis (9, 21, 22, 23). Consequently, to quantitate the degree of apoptosis occurring in SW626 cells exposed to paclitaxel, we determined the fraction of cells demonstrating morphologic changes characteristic of apoptosis and expressing a sub-G0 content of DNA by propidium iodide analysis as previously described (17). After a 48-hr incubation with paclitaxel (0.05 μM), significant morphologic evidence of apoptosis was observed only for HA-BAX-expressing clones, with representative morphology and propidium iodide analysis shown in Fig. 4. The mean percentage of cells with nuclear fragmentation and cytoplasmic blebbing was 3.3 ± 1.2% for the three neo-control clones, compared with a corresponding value of 26.3 ± 7% for the three HA-BAX-expressing clones (P = 0.01). Similarly, the mean fraction of sub-G0 cells after 48 hr of paclitaxel treatment (0.05 μM) was 7 ± 4% for the three neo-control clones, compared with 45 ± 4% for the three HA-BAX-expressing clones (P = 0.001; Fig. 4). These data suggest that the enhanced sensitivity of HA-BAX clones to paclitaxel is mediated by apoptosis.
Figure 4.
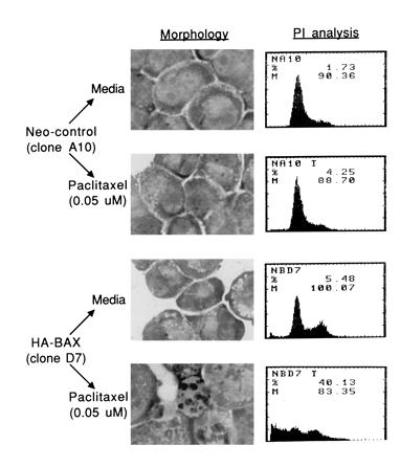
Effects of HA-BAX on morphology and sub-G0 content of SW626 cells treated with paclitaxel. Neo-control clone A10 and HA-BAX clone D7 were grown for 48 hr in the presence of medium alone or paclitaxel (0.05 μM), followed by morphologic assessment (Wrights–Giemsa staining) and quantitation of the sub-G0 fraction by propidium iodide staining as described. Significant amounts of nuclear fragmentation and an increased fraction of sub-G0 cells are observed for HA-BAX clone D7 compared with neo-control cells, consistent with paclitaxel-mediated apoptosis. Representative data from one of three separate experiments are shown.
Expression of BCL-2 and BCL-xL in SW626 Transfectants.
We considered the possibility that the enhanced sensitivity to paclitaxel observed in HA-BAX clones might be mediated through down-regulation of anti-apoptotic molecules such as BCL-2 or BCL-xL. To determine the role of these molecules in this phenomenon, we first quantitated the levels of BCL-2 and BCL-xL proteins in control and HA-BAX-expressing clones by immunoblotting. As shown in Fig. 2, baseline levels of BCL-2 and BCL-xL were not decreased in HA-BAX compared with neo-control clones. The mean ratio of BCL-2/tubulin was 1.12 ± 0.37 for the three HA-BAX clones, compared with 0.70 ± 0.14 for neo-control clones. Likewise, the mean ratio of BCL-xL/tubulin was 0.74 ± 0.4 for HA-BAX clones compared with 0.26 ± 0.14 for neo-control clones. The neo-control clone F8 expressed lower levels of BCL-xL than the other five clones studied, although the dose response of this clone to paclitaxel was identical to that of the other two neo-control clones. To determine whether exposure to paclitaxel mediated its effects through down-regulation of BCL-2 or BCL-xL, or up-regulation of BAX, SW626 cells (neo clone B10) were treated with either medium or paclitaxel for up to 48 hr (1.0 μM), followed by assessment of BCL-2, BCL-xL, and BAX levels by immunoblotting. SW626 neo-control cells were used for these experiments, since we were interested in determining the effects of paclitaxel on the expression of BCL-2, BCL-xL, and BAX under physiologic conditions, in the absence of BAX overexpression. A paclitaxel dose of 1.0 μM was chosen, since this dose was shown in pilot studies to produce >50% cell death in SW626 neo-control cells over a 48-hr period. As shown in Fig. 5, there was no evidence of BCL-2 or BCL-xL down-regulation, or of BAX up-regulation, in SW626 cells exposed to paclitaxel over a 48-hr time period.
Figure 5.
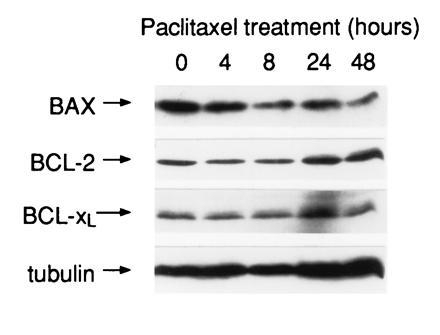
Effects of paclitaxel on the expression of BAX, BCL-2, and BCL-xL. Neo-control clone B10 was treated with paclitaxel (1.0 μM) for up to 48 hr, followed by immunoblot analysis as previously described. The dose of paclitaxel chosen for this experiment resulted in over 50% cytotoxicity of clone B10 at 48 hr of culture. There was no evidence of BCL-2 or BCL-xL down-regulation, or of BAX up-regulation, in the presence of paclitaxel.
DISCUSSION
The data presented in this study suggest an important role for the BAX molecule in the process of chemotherapy-induced apoptosis. This phenomenon was noted in three separate clonal transfectants that overexpressed BAX, making selection artifact unlikely as a cause of the enhanced sensitivity to paclitaxel observed for BAX transfectants. Also, each of the six clones used in this study expressed similar levels of BCL-2 and BCL-xL, which did not change in the presence of paclitaxel, making it unlikely that diminished expression of these molecules is responsible for the observed effect. Interestingly, there was a predominance of BCL-2 compared with BCL-xL in each of the clones used in this study, consistent with previous observations suggesting that an inverse relationship exists between these two proteins in lymphoid cells (24). The fact that none of the lines expressed the MDR-1 protein (p170), a protein known for its ability to mediate paclitaxel resistance through enhanced drug efflux, excludes a role for this molecule in the observed effects of BAX on paclitaxel cytotoxicity (15). It is interesting that the growth and viability of HA-BAX transfectants was indistinguishable from that of neo-control cells, suggesting that the presence of high levels of BAX by itself is not sufficient to trigger apoptosis without an additional stimulus provided by a cytotoxic agent such as paclitaxel. This observation is consistent with previous work, which demonstrated that BAX overexpression did not alter the proliferation of FL5.12 cells under conditions of optimal growth, but facilitated apoptotic cell death upon withdrawal of interleukin 3 (2). It should be noted that apoptosis of SW626 cells in these experiments was documented by characteristic morphologic and flow cytometric criteria (Fig. 4), in the absence of internucleosomal DNA fragmentation. The absence of DNA laddering in cells undergoing apoptotic death has been previously observed and suggests that this finding may be an epiphenomenon rather than a causal event of programmed cell death (9, 21, 22, 23).
Other investigators have observed that paclitaxel is capable of partly mediating cell death in a p53-independent fashion, although the mechanism for this phenomenon is not clear (25). Although our data suggest that the BAX molecule is involved in this process, direct regulation of the protein levels of BAX, BCL-2, or BCL-xL does not appear to be the primary mechanism by which this effect occurs (Fig. 5). In addition, the recently observed association between paclitaxel-induced apoptosis and BCL-2 phosphorylation, presumably leading to BCL-2 inactivation, was not a feature of our system (26, 27). Thus, it appears that BCL-2 phosphorylation is not always a necessary component of the apoptotic response to paclitaxel in all cell types. The possibility that paclitaxel may exert its effects in p53-deficient cells by fostering the formation of BAX:BAX homodimers, without a change in protein levels, will require further investigation.
It is interesting that the ability of BAX to sensitize cells to apoptotic cell death appears to be stimulus-dependent. For example, although BAX overexpression enhances the sensitivity of cells to paclitaxel, vincristine, and doxorubicin, this molecule had no effect on the dose response of cells to CBDCA, hydroxyurea, or etoposide (Table 1). Both paclitaxel and vincristine affect the function of microtubules during mitotic spindle formation, suggesting that BAX may function as a monitor of damage occurring at a G2/M checkpoint. However, our data do not exclude the possibility that BAX may mediate the cytotoxicity of DNA-damaging agents such as CBDCA, but only in the presence of an intact p53 pathway. For instance, BAX overexpression in thymocytes from transgenic mice has been recently shown to enhance radiation-induced apoptosis, but only in the presence of functional p53 (28). Alternatively, damage induced by agents such as CBDCA may result in the activation of distinct apoptotic pathways that are BAX-independent. In this regard, it is important to note that other molecules are capable of functioning in a BAX-like manner, including the recently discovered proteins BAK and BIK (29, 30, 31). Both BAX, BAK, and BIK possess a highly conserved region referred to as the BH3 domain, which appears to be critical to their death-promoting function (32). We are currently investigating whether proteins such as BAK and BIK are differentially activated by specific classes of chemotherapy agents, such as CBDCA.
The potential importance of BAX in mediating chemosensitivity has been indirectly suggested by previous reports that have correlated decreased levels of BAX in the malignant cells of breast cancer patients with poor response to chemotherapy (33, 34). Our future studies will attempt to determine whether BAX levels are diminished in ovarian cancer tissue obtained from patients who have developed clinical resistance to paclitaxel. Our data demonstrate that sufficient levels of BAX may bypass the need for upstream apoptotic molecules such as p53 and suggest that the development of agents that mimic the function of BAX may enhance the effectiveness of paclitaxel in the treatment of patients with ovarian cancer.
Acknowledgments
We would like to thank Dr. Peter Adams (Dana–Farber Cancer Institute) and Dr. James D. Griffin (Dana–Farber Cancer Institute) for helpful discussions during the course of this study. S.A.C. is supported in part by Public Health Service Grant CA 60670.
Footnotes
The publication costs of this article were defrayed in part by page charge payment. This article must therefore be hereby marked “advertisement” in accordance with 18 U.S.C. §1734 solely to indicate this fact.
Abbreviations: FCS, fetal calf serum; ts, temperature-sensitive; HA, hemagglutinin; PI, propidium iodide.
References
- 1.Wyllie A H. Anticancer Res. 1985;5:131–136. [PubMed] [Google Scholar]
- 2.Oltvai Z N, Milliman C L, Korsmeyer S J. Cell. 1993;74:609–619. doi: 10.1016/0092-8674(93)90509-o. [DOI] [PubMed] [Google Scholar]
- 3.Oltvai Z N, Korsmeyer S J. Cell. 1994;79:189–192. doi: 10.1016/0092-8674(94)90188-0. [DOI] [PubMed] [Google Scholar]
- 4.Reed J C. J Cell Biol. 1994;124:1–6. doi: 10.1083/jcb.124.1.1. [DOI] [PMC free article] [PubMed] [Google Scholar]
- 5.Miyashita T, Krajewski S, Krajewska M, Wang H G, Lin H K, Liebermann D A, Hoffman B, Reed J C. Oncogene. 1994;9:1799–1805. [PubMed] [Google Scholar]
- 6.Miyashita T, Reed J C. Cell. 1995;80:293–299. doi: 10.1016/0092-8674(95)90412-3. [DOI] [PubMed] [Google Scholar]
- 7.Fisher D E. Cell. 1994;78:539–542. doi: 10.1016/0092-8674(94)90518-5. [DOI] [PubMed] [Google Scholar]
- 8.Lowe S W, Ruley H E, Jacks T, Housman D E. Cell. 1993;74:957–967. doi: 10.1016/0092-8674(93)90719-7. [DOI] [PubMed] [Google Scholar]
- 9.Dole M G, Jasty R, Cooper M J, Thompson C B, Nunez G, Castle V P. Cancer Res. 1995;55:2576–2582. [PubMed] [Google Scholar]
- 10.Bhalla K, Ibrado A M, Tourkina E, Tang C, Mahoney M E, Huang Y. Leukemia. 1993;7:563–568. [PubMed] [Google Scholar]
- 11.Lowe S W, Bodis S, McClatchey A, Remington L, Ruley H E, Fisher D E, Housman D E, Jacks T. Science. 1994;266:807–810. doi: 10.1126/science.7973635. [DOI] [PubMed] [Google Scholar]
- 12.Cannistra S A. N Engl J Med. 1993;329:1550–1559. doi: 10.1056/NEJM199311183292108. [DOI] [PubMed] [Google Scholar]
- 13.Kupryjanczyk V, Thor A D, Beauchamp R, Merritt V, Edgerton S M, Bell D A, Yandell D W. Proc Natl Acad Sci USA. 1993;90:4961–4965. doi: 10.1073/pnas.90.11.4961. [DOI] [PMC free article] [PubMed] [Google Scholar]
- 14.Yonish-Rouach E, Resnitzky D, Lotem J, Sachs L, Kimchi A, Oren M. Nature (London) 1991;352:345–347. doi: 10.1038/352345a0. [DOI] [PubMed] [Google Scholar]
- 15.Arceci R J, Stieglitz K, Bras J, Schinkel A, Baas F, Croop J. Cancer Res. 1993;53:310–317. [PubMed] [Google Scholar]
- 16.Cannistra S A, Kansas G S, Niloff J, DeFranzo B, Kim Y, Ottensmeier C. Cancer Res. 1993;53:3830–3838. [PubMed] [Google Scholar]
- 17.Darzynkiewicz Z, Bruno S, Del-Bino G, Gorcyzyca W, Hotz M A, Lassota P, Traganos F. Cytometry. 1992;13:795–808. doi: 10.1002/cyto.990130802. [DOI] [PubMed] [Google Scholar]
- 18.Barak Y, Juven T, Haffner R, Oren M. EMBO J. 1993;12:461–468. doi: 10.1002/j.1460-2075.1993.tb05678.x. [DOI] [PMC free article] [PubMed] [Google Scholar]
- 19.El-Deiry W S, Tokino T, Velculescu V E, Levy D B, Parsons R, Trent J M, Lin D, Mercer W E, Kinzler K W, Vogelstein B. Cell. 1993;75:817–825. doi: 10.1016/0092-8674(93)90500-p. [DOI] [PubMed] [Google Scholar]
- 20.Gannon J V, Greaves R, Iggo R, Lane D P. EMBO J. 1990;9:1595–1602. doi: 10.1002/j.1460-2075.1990.tb08279.x. [DOI] [PMC free article] [PubMed] [Google Scholar]
- 21.Schulze-Osthoff K, Walczak H, Dröge W, Krammer P H. J Cell Biol. 1994;127:15–20. doi: 10.1083/jcb.127.1.15. [DOI] [PMC free article] [PubMed] [Google Scholar]
- 22.Falcieri E, Martelli A M, Bareggi R, Cataldi A, Cocco L. Biochem Biophys Res Commun. 1993;193:19–25. doi: 10.1006/bbrc.1993.1584. [DOI] [PubMed] [Google Scholar]
- 23.Huang P, Robertson L E, Wright S, Plunkett W. Clin Cancer Res. 1995;1:1005–1013. [PubMed] [Google Scholar]
- 24.Chao D T, Linette G P, Boise L H, White L S, Thompson C B, Korsmeyer S J. J Exp Med. 1995;182:821–828. doi: 10.1084/jem.182.3.821. [DOI] [PMC free article] [PubMed] [Google Scholar]
- 25.Fisher D E, Bodis S, Lowe S, Takemoto C, Housman D, Jacks T. Blood. 1994;84:111a. (abstr.). [Google Scholar]
- 26.Blagosklonny M V, Schulte T, Nguyen P, Trepel J, Neckers L M. Cancer Res. 1996;56:1851–1854. [PubMed] [Google Scholar]
- 27.Haldar S, Nilamani J, Croce C M. Proc Natl Acad Sci USA. 1995;92:4507–4511. doi: 10.1073/pnas.92.10.4507. [DOI] [PMC free article] [PubMed] [Google Scholar]
- 28.Brady H J, Salomons G S, Bobeldijk R C, Berns A J. EMBO J. 1996;15:1221–1230. [PMC free article] [PubMed] [Google Scholar]
- 29.Chittenden T, Harrington E A, O’Connor R, Flemington C, Lutz R J, Evan G I, Guild B C. Nature (London) 1995;374:733–736. doi: 10.1038/374733a0. [DOI] [PubMed] [Google Scholar]
- 30.Kiefer M C, Brauer M J, Powers V C, Wu J J, Umansky S R, Tomei L D, Barr P J. Nature (London) 1995;374:736–739. doi: 10.1038/374736a0. [DOI] [PubMed] [Google Scholar]
- 31.Boyd J M, Gallo G J, Elangovan B, Houghton A B, Malstrom S, Avery B J, Ebb R G. Oncogene. 1995;11:1921–1928. [PubMed] [Google Scholar]
- 32.Chittenden T, Flemington C, Houghton A B, Ebb R G, Gallo G J, Elangovan B, Chinnadurai G, Lutz R J. EMBO J. 1995;14:5589–5596. doi: 10.1002/j.1460-2075.1995.tb00246.x. [DOI] [PMC free article] [PubMed] [Google Scholar]
- 33.Krajewski S, Blomqvist C, Franssila K, Krajewska M, Wasenius V M, Niskanen E, Nordling S, Reed J C. Cancer Res. 1995;55:4471–4478. [PubMed] [Google Scholar]
- 34.Bargou R C, Daniel P T, Mapara M Y, Bommert K, Wagener C, Kallinich B, Royer H D, Dorken B. Int J Cancer. 1995;60:854–859. doi: 10.1002/ijc.2910600622. [DOI] [PubMed] [Google Scholar]