

Abstract
GABAA receptor subtypes comprising the α1 and α3 subunits change with development and have a specific anatomical localization in the adult brain. These receptor subtypes have been previously demonstrated to greatly differ in deactivation kinetics but the underlying gating mechanisms have not been fully elucidated. Therefore, we expressed rat α1β2γ2 and α3β2γ2 receptors in human embryonic kidney 293 cells and recorded current responses to ultrafast GABA applications at macroscopic and single-channel levels. We found that the slow deactivation of α3β2γ2-mediated currents is associated with a relatively small rate and extent of apparent desensitization. In contrast, responses mediated by α1β2γ2 receptors had faster deactivation and stronger desensitization. α3β2γ2 receptors had faster recovery in the paired-pulse agonist applications than α1β2γ2 channels. The onset of currents mediated by α3β2γ2 receptors was slower than that of α1β2γ2 for a wide range of GABA concentrations. Single-channel analysis did not reveal differences in the opening/closing kinetics of α1β2γ2 and α3β2γ2 channels but burst durations were longer in α3β2γ2 receptors. Simulation with a previously reported kinetic model was used to explore the differences in respective rate constants. Reproduction of major kinetic differences required a smaller desensitization rate as well as smaller binding and unbinding rates in α3β2γ2 compared with α1β2γ2 receptors. Our work describes the mechanisms underlying the kinetic differences between two major GABAA receptor subtypes and provides a framework to interpret data from native GABA receptors.
Keywords: GABA, kinetics, patch clamp, rat, subunit
Introduction
GABAA receptors (GABAARs) are pentameric structures and as many as 20 subunits (α1–6, β1–4, γ1–3, δ, ρ1–3, ε, π and θ) have been cloned so far (Fritschy & Brunig, 2003). The kinetics and pharmacology of GABAARs strictly depend on their subunit composition (Whiting, 2003). α subunits are critical determinants of ligand binding and of activation, deactivation and desensitization kinetics of GABA-induced responses of native and recombinant GABAARs (Verdoorn, 1994; Gingrich et al., 1995; Lavoie et al., 1997; McClellan & Twyman, 1999; Bohme et al., 2004). Such α subunit dependence of GABAAR function appears to be associated with differential localization and the specific functions of these receptors in the central nervous system (Pirker et al., 2000; for review see Rudolph & Mohler, 2004). Receptors containing the α3 subunit are characterized by slow deactivation, slow desensitization onset and low affinity (Verdoorn, 1994; Gingrich et al., 1995). Such a peculiar kinetic pattern has been shown to play an important role in the regulation of the network temporal resolution in the early development stage (Ortinski et al., 2004). α3-containing receptors have been shown to be abundant in serotoninergic neurons in Raphe nuclei (Gao et al., 1993) and Browne et al. (2001) attributed the slow GABAergic current kinetics observed in thalamic neurons to the presence of the α3 subunit. Although the physiological relevance of the spatial and temporal differential expression of α3-containing receptors in the brain is still unclear, it is likely that the α3 subunit could efficiently serve as a prolonged and sustained synaptic GABAergic control. Thus, it is convenient to investigate the kinetic features of α3β2γ2 receptors in comparison to the α1β2γ2 receptor subtype that has been extensively studied and is believed to be most abundantly expressed among all GABAARs in the central nervous system (Whiting, 2003). Verdoorn (1994) and Gingrich et al. (1995) have analysed the currents elicited by exogenous GABA applications and found profound differences in activation, deactivation and desensitization kinetics between currents mediated by α1 and α3 subunit-containing receptors. Although Verdoorn (1994) did not address a detailed determination of receptor gating, Gingrich et al. (1995) adapted the model of Twyman et al. (1990) and concluded that the differences between binding and unbinding rates were nearly sufficient to account for the functional differences between α1β2γ2 and α3β2γ2 receptors observed in their experiments. However, a limited temporal resolution of these recordings (application time < 30 ms, Gingrich et al., 1995) might have precluded detection of the fastest current components. For instance, in some neuronal and recombinant GABAARs, the onset of rapid desensitization occurs within a millisecond time scale (Jones & Westbrook, 1995; McClellan & Twyman, 1999; Mozrzymas et al., 2003a,b). Furthermore, rapid desensitization has been demonstrated to play a pivotal role in shaping deactivation and synaptic decay of GABAergic currents (Jones & Westbrook, 1995). Thus, we further explored the gating mechanisms of α3 subunit-containing GABAARs at high temporal resolution and thoroughly addressed the role of the desensitization process in shaping deactivation kinetics (Jones & Westbrook, 1995). We used ultrafast GABA applications to elicit macroscopic and single-channel currents mediated by recombinant α1β2γ2 and α3β2γ2 receptors, expressed in human embryonic kidney 293 cells. The study of such currents revealed that these two receptor subtypes differ in both affinity and gating properties. We conclude therefore that, with respect to α1β2γ2, α3β2γ2 receptors are characterized by both a slower binding/unbinding rate constant and a slower desensitization onset.
Based on our model simulations, as a matter of speculation, we also propose that both receptor types might experience transitions between singly- and doubly-bound desensitized states.
Materials and methods
Human embryonic kidney 293 cell line
Human embryonic kidney 293 cells (no. CRL1573, American Type Culture Collection, Rockville, MD, USA) were grown in minimal essential medium (Invitrogen Corporation, Carlsbad, CA, USA), supplemented with 10% fetal bovine serum, 100 units/mL penicillin and 100 units/mL streptomycin (Invitrogen Corporation), in a 5% CO2 incubator. Exponentially growing cells were dispersed with trypsin, seeded at 2 × 10⁵ cells/35 mm dish in 1.5 mL of culture medium and plated on 12 mm glass coverslips (Fisher Scientific, Pittsburgh, PA, USA).
cDNA transient transfection
Rat α1, β2 and γ2S GABAAR subunit cDNAs were individually subcloned into the expression vector pGW1 and were kindly provided by Dr Trevor Smart (University College London, UK). Rat α3 subunit was subcloned into the expression vector pRK5 and was a gift of Dr Hartmut Lűddens (University of Mainz, Germany). Human embryonic kidney 293 cells were transfected using the calcium phosphate precipitation method (Chen & Okayama, 1987). The following plasmid combinations were mixed: α1:β2:γ2 and α3:β2:γ2 (1 µg for α and β cDNAs, respectively, and 3 µg for γ cDNA) and the coprecipitates were added to culture dishes containing 1.5 mL minimal essential medium for 12–16 h at 37 °C under 3% CO2. The medium was removed, and the cells were rinsed twice with culture medium and finally incubated in the same medium for 24 h at 37 °C under 5% CO2. Cotransfection with the plasmid pEGFP (Invitrogen Corporation) allowed easy recognition of transfected cells expressing this fluorescent marker. More than 90% of the cells expressing enhanced green fluorescent protein also expressed GABAARs.
Electrophysiological recordings
At a GABA concentration of at least 100 µm, current responses were recorded in the outside-out configuration of the patch-clamp technique using the Axopatch 200B amplifier (Molecular Device Corporation, Sunnyvale, CA, USA). However, in the excised patch mode, currents elicited by 30 µm GABA (or lower) were often too small to reliably quantify their time course (especially onset kinetics) and, for this GABA concentration range, recordings were preferentially made in the whole-cell configuration selecting cells with small diameter and capacitance of less than 8 pF (small lifted cells). Kinetics of current responses recorded from excised patches and from lifted cells did not show any clear difference and were pooled together. In all experiments, the pipette voltage was set at −70 mV. Patch electrodes, formed from thin borosilicate glass (Wiretrol II, Drummond Scientific, Broomall, PA, USA), had a resistance of 6–8 MΩ when filled with an intracellular solution containing (in mm): CsCl, 145; CaCl2, 1; 1,2-bis(2- aminophenoxy)ethane-N,N,N′-tetra-acetic acid, 11; MgATP, 4; HEPES, 10 (pH 7.2 with CsOH). The composition of the external solution was (in mm): NaCl, 145; KCl, 5; CaCl2, 1; MgCl2, 1; glucose, 5; HEPES, 5 (pH 7.4 with NaOH). All experiments were performed at room temperature (22–24 °C). Single-channel currents were recorded in the outside-out configuration of the patch-clamp technique. Patches with a low number of channels (apparently one to three channels) were used for single-channel recordings. The occurrence of such patches was rare, only one out of 10–20. For the analysis requiring a high temporal resolution (e.g. rise time kinetics of evoked currents), the signals were low-pass filtered at 10 kHz with an eight-pole Bessel filter, sampled at 50–125 kHz using the analog-to-digital converter Digidata 1322A (Molecular Device Corporation) and stored on the computer hard disk. pclamp 9.2 (Molecular Device Corporation) software was used for acquisition and data analysis. The single-channel currents were acquired at 50 kHz. Single-channel current records in figures were filtered at 0.9 kHz for display purposes.
Drug application
GABA-containing solution was applied to excised patches using an ultrafast perfusion system based on a piezoelectric-driven theta-glass application pipette (Jonas, 1995). The piezoelectric translator used was the P-245.30 Stacked Translator (Physik Instrumente, Waldbronn, Germany) and theta glass tubing was from Hilgenberg (Malsfeld, Germany). The open tip recordings of the liquid junction potentials revealed that the 10–90% exchange of solution occurred within 60–100 µs. The speed of the solution exchange was also estimated around the excised patch by the 10–90% onset of the membrane depolarization induced by application of high (25 mm) potassium saline. In this case, the 10–90% rise time value (70–120 µs) was very close to that found for the open tip recordings. Amplitude and deactivation kinetics were within 5% of the initial values in most experiments. Recordings with greater changes were discarded.
Analysis
The decaying phase of the currents was fitted with a function in the form:
| (1) |
where Ai are the fractions of respective components (ΣAi = 1) and τi are the time constants. The deactivation time course was well fitted with a sum of three exponentials (n = 3). The averaged deactivation time constant τw was calculated using the formula τw = ΣAiτi. The time course of desensitization onset was described using Eq. 1 (sum of exponential functions) with a constant value representing the steady-state current during a continuous application of saturating [GABA].
A standard paired-pulse protocol (pulse duration 2 ms and saturating [GABA]) was used to study the recovery process. The extent of recovery was expressed in terms of the recovery parameter (R) given by the following formula:
| (2) |
where I1 is the first peak amplitude, I2 is the second peak amplitude and I3 is the current value immediately before the application of the second pulse.
The rate of onset was calculated as a reciprocal of the time constant of exponential function fitted to the current rising phase. The relationship between the time constant describing the current onset and the 10–90% rise time is:
The kinetic modeling was performed with the Channel Lab 2.0 software (developed by S. Traynelis for Synaptosoft, Decatur, GA, USA), which converted the kinetic model (Fig. 8) into a set of differential equations and solved them numerically assuming, as the initial condition, that at t = 0 no bound or open receptors were present.
Fig. 8.

Model simulations of α1β2γ2 and α3β2γ2 receptor-mediated currents. (A) Model of GABAA receptor gating (Jones et al., 1998). Thick arrows depict binding and unbinding transitions between singly-and doubly-bound desensitized states. These transitions were found to play an important role in shaping currents mediated by these receptors (see Model simulations and Discussion). Simulations were performed for the following rate constants for α1β2γ2 receptor: kon = 3.0/ms/mm, koff = 0.1/ms, d2 = 1.5/ms, r2 = 0.02/ms, β2 = 2.5/ms, α2 = 0.284/ms, q = 0.1/ms/mm, p = 0.005/ms, d1 = 0.013/ms, r1 = 0.00013/ms, β1 = 0.2/ms, α2 = 1.11/ms and for α3β2γ2 receptor: kon = 0.3/ms/mm, koff = 0.045/ms, d2 = 0.3/ms, r2 = 0.02/ms, β2 = 2.5/ms, α2 = 0.284/ms, q = 0.00087/ms/mm, p = 0.00013/ms, d1 = 0.013/ms, r1 = 0.00013/ms, β1 = 0.2/ms, α1 = 1.11/ms. In B–F, currents simulated for α1β2γ2 receptors are drawn with a thin line and those for α3β2γ2 channels with a thick line. In all graphs currents are normalized. (B) Simulations of current responses to brief (2 ms) applications of saturating [GABA]. A slower deactivation for α3β2γ2 receptors is well reproduced (compare with Fig. 3). (C) Simulated current responses to prolonged application of saturating [GABA]. A smaller rate and extent of apparent desensitization in α3β2γ2 receptor-mediated currents is well reproduced (compare with Fig. 4). (D) Simulated currents elicited using paired-pulse protocol (pair of 2 ms pulses of saturating [GABA] separated by a 75 ms gap) for α1β2γ2 (left) and α3β2γ2 (right) receptors. A larger recovery of the second pulse for α3β2γ2 receptors is properly reproduced (compare with Fig. 5). (E) Simulation of the rising phases of currents elicited by saturating [GABA]. A slower onset rate for α3β2γ2 receptors is correctly reproduced (compare with Fig. 2). (F) Simulations of current responses to a non-saturating GABA concentration (300 µm). A dramatically slower onset of currents mediated by α3β2γ2 receptors properly reproduces the experimental findings (compare with Fig. 1).
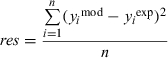
For each protocol used, we compared point-by-point the normalized individual simulated traces with the normalized and averaged experimentally recorded traces. The goodness of fit was estimated by calculating the normalized residuals (sum of squares differences divided by the number of samples) according to the formula
 |
(3) |
where y mod and yexp are the modelled and experimentally measured values, respectively, and n is the number of samples in the traces (Traynelis, Channel Lab). Using such a procedure, we compared the experimental traces with the outputs of the frame model of Jones & Westbrook (1995); the overall normalized residuals values obtained for the tested protocols were 2.2 × 10⁻³ and 9.7 × 10⁻³ for α1β2γ2 and α3β2γ2 receptors. By using the frame model of Jones et al. (1998) the normalized residuals were 1.9 × 10⁻³ and 2.7 × 10⁻³ for α1β2γ2 and α3β2γ2 receptors, respectively. These values indicate that the frame model of Jones et al. (1998) provided a better reproduction of our experimental data.
Single-channel analysis
For off-line analysis of single-channel events, current traces were low-pass filtered at 2 kHz with the digital Bessel filter at −3 dB cutoff frequency of pclamp 9.2 software. Open and closed events were distinguished by applying the 50% criterion. Occasionally, openings at lower conductance or substates were observed but their frequency was less than 1% and they were discarded. The overlapping events present in the considered records were excluded from the analysis. Dead time used to define the minimal detectable event duration with our filter setting was 0.09 ms (Colquhoun & Sigworth, 1995). To define the end-burst critical closed times, the closed time distributions were constructed and fitted with four or five exponential components (confidence interval 95%). For each receptor subtype, in all considered distributions, the two shortest components (∼0.4 and 1.9 ms) were almost always much shorter with respect to the slower components. Moreover, the slower time constants showed substantial variability depending on the number of channels in the patch. Thus, the two shortest components were interpreted as intraburst closures and the critical time (Tcrit) was calculated by equalizing the proportion of misclassifications using the following formula (Colquhoun & Sakmann, 1985):
| (4) |
All experiments were performed at room temperature (22–24 °C). Data are expressed as mean ± SEM and unpaired Student's t-tests were used for data comparison.
Results
Slower GABA binding rate for α3β2γ2 compared with α1β2γ2 receptor
The activation of GABAAR (as of any other ligand-gated channel) consists of at least two kinetically distinct steps including binding of the agonist to the receptor and the conformational transitions of bound receptor. Although the binding rate is assumed to be proportional to the agonist concentration, the rates of the conformational changes are concentration independent. Thus, at sufficiently low agonist concentration, the receptor activation would critically depend on the binding rate and therefore the current onset kinetics is expected to show a strong agonist concentration dependence. To assess differences in the binding rate, current responses to non-saturating [GABA] in the range 10–300 µm were recorded for α1β2γ2 or α3β2γ2 receptors. As shown in Fig. 1, at each GABA concentration used, currents mediated by α3β2γ2 receptors were characterized by onset rates slower by more than one order of magnitude than those of α1β2γ2 receptors. These data provide strong evidence that the binding rate of α3β2γ2 receptors is much slower than that of α1β2γ2 channels. However, it needs to be considered that, even at non-saturating [GABA], the time course of the current onset phase is not shaped exclusively by the binding rate. For instance, as previously pointed out by Mozrzymas et al. (2003a), the rising phase of currents elicited by a wide range of GABA concentrations may be affected by rapid desensitization as well as by opening/closing transitions between bound states. Moreover, at low [GABA], current onset is additionally shaped by the unbinding rate (Maconochie et al., 1994). Thus, precise comparison of binding properties of these two receptor types requires additional information on kinetic properties of these channels.
Fig. 1.

Comparison of rise time for currents elicited by non-saturating GABA in α1β2γ2 and α3β2γ2 channels. (A) Typical examples of normalized α1β2γ2- and α3β2γ2-mediated current responses to a non-saturating (300 µm) GABA concentration. (B) Summary of data derived for the assessment of the onset rate of current elicited at four increasing non-saturating GABA concentrations in at least five patches excised from human embryonic kidney cells expressing α1β2γ2 and α3β2γ2 receptors. *P < 0.05 indicates a significant difference. Note that the difference in the onset rate is so large between the two combinations that the vertical axis is shown in logarithmic scale.
Onsets of saturated responses are slower for α3β2γ2 than for α1β2γ2 channels
Although at non-saturating [GABA] the onset of current responses is strongly dependent on agonist concentration, when applying saturating [GABA] the binding step occurs very quickly and the current onset reflects the kinetics of conformational transitions between bound states. We first analysed the 10–90% rise time of current evoked pulses of 10 mm GABA, a concentration known to saturate the onset kinetics of α1β2γ2-mediated currents. We found that the α3β2γ2-mediated currents showed a rise time significantly slower than that in α1β2γ2-mediated currents (0.29 ± 0.02 and 1.01 ± 0.08 ms, respectively, P < 0.05, Fig. 2A and B). However, as reported above, the α3β2γ2 receptor binding rate constant (kon) is much slower than in α1β2γ2 channels. Thus, 10 mm GABA might be insufficient to saturate the rising phase of responses mediated by α3β2γ2 receptors. In order to test this possibility, the GABA concentration was increased up to 30, 50 and 60 mm. As expected, the rise time of the α1β2γ2-mediated current evoked by 30 mm GABA was not significantly different from that elicited by 10 mm GABA (0.27 ± 0.02 ms, n = 4 and 0.29 ± 0.02 ms, n = 4, respectively, Fig. 2A and B), confirming that 10 mm GABA is saturating for these receptors. In contrast, the 10–90% rise times of α3β2γ2-mediated currents obtained at 30 and 50 mm GABA were significantly accelerated with respect to that at 10 mm GABA (0.59 ± 0.05 ms, n = 6, P < 0.05 and 0.41 ± 0.01 ms, n = 4, P < 0.05, Fig. 2A and B). The decrease in the 10–90% rise time was significant between applications of 30 and 50 mm GABA (P < 0.05). A further increase of [GABA] from 50 to 60 mm did not significantly accelerate the current onset kinetics (0.42 ± 0.04 ms, n = 6), indicating that saturation of the activation process was reached. Altogether, the rising phase of currents elicited by saturating [GABA] is significantly slower for responses mediated by α3β2γ2 than α1β2γ2 receptors, indicating that the conformational changes underlying the onset of α3β2γ2-mediated currents are slower than those in α1β2γ2 receptors. This finding might suggest that α3β2γ2 channels are endowed with a slower opening/closing kinetics of fully-bound receptors. However, the onset of currents evoked by saturating [GABA] may depend additionally on desensitization kinetics (Mozrzymas et al., 2003a).
Fig. 2.

Comparison of rise time currents elicited by high GABA concentration between α1β2γ2 and α3β2γ2 channels. (A) Typical examples of normalized α1β2γ2- and α3β2γ2-mediated current responses to high GABA concentrations. Arrows point to responses to a distinct concentration for distinct subunit combinations. Note that whereas for α1β2γ2 10 mm GABA saturates the onset rate, in α3β2γ2-mediated responses onset saturation is achieved at 50 mm GABA. (B) Summary of data deriving for the assessment of the 10–90% rise time of current elicited at three distinct concentrations as indicated in at least four patches excised from human embryonic kidney cells expressing α1β2γ2 and α3β2γ2 receptors. *P < 0.05 indicates a significant difference between subunits.
It should additionally be noted that, although for α1β2γ2 and α3β2γ2 receptors a saturation of the onset kinetics is reached at ∼10 and 50 mm, respectively, saturation of the peak amplitude is achieved at agonist concentration one order of magnitude lower. Thus, 10 mm GABA represents a dose able to saturate the peak of currents mediated by both α1β2γ2 and α3β2γ2 receptors. Moreover, no differences in deactivation of currents mediated by α3β2γ2 receptors were observed when applying 10, 30 or 50 mm GABA (not shown).
α3β2γ2-mediated currents show slower deactivation kinetics with respect to α1β2γ2-mediated currents
To compare the deactivation kinetics of α1β2γ2 and α3β2γ2 receptors, current responses elicited by brief (2 ms) pulses of saturating GABA concentration were analysed (Fig. 3A, for reasons explained above, 10 mm was used for α1β2γ2 and 50 mm for α3β2γ2). The decaying phase of currents mediated by α1β2γ2 or α3β2γ2 channels was best fitted with a triple exponential function. Currents mediated by α3β2γ2 receptors showed a markedly slower decay kinetics than in the case of the α1β2γ2 channels, with decay weighted time constants (τw) of 185.3 ± 30.1 and 52.5 ± 2.9 ms, respectively (P < 0.05, Fig. 3F). The fast (τ1), middle (τ2) and slow (τ3) time constants obtained for α1β2γ2 currents were 2.8 ± 0.3, 33.4 ± 4.6 and 221.35 ± 14.9 ms (n = 6), respectively (Fig. 3C–E), and the weight of the fast component (A1) was predominant with respect to the middle (A2) and the slow (A3), being 0.57 ± 0.04, 0.23 ± 0.02 and 0.20 ± 0.03, respectively (Fig. 3B). The decay time constants for currents mediated by α3β2γ2 channels were roughly three times slower than those determined for α1β2γ2 receptor-mediated responses (8.4 ± 0.7, 77.5 ± 9.3 and 645.1 ± 73.6 ms, n = 9, for τ1, τ2 and τ3, respectively, Fig. 3C–E, P < 0.05 for comparison of each respective time constant). Moreover, similarly to that observed for α1β2γ2 receptors (although to a lesser extent), the weight of the fast component (A1) in responses mediated by α3β2γ2 channels was predominant with respect to A2 and A3 (0.47 ± 0.03, 0.29 ± 0.02 and 0.24 ± 0.02, respectively, n = 9, Fig. 3B). However, the relative weight of the fast component observed for α1β2γ2 (0.57 ± 0.04, n = 6) was significantly larger than that in α3β2γ2 receptor-mediated currents (0.47 ± 0.03, n = 9, P < 0.05, Fig. 3B).
Fig. 3.

Comparison of deactivation kinetics for currents elicited by brief GABA pulses between α1β2γ2 and α3β2γ2 channels. (A) Normalized average of 10 responses induced by 2 ms applications of saturating GABA (GABA sat.) to a patch excised from human embryonic kidney cells expressing α1β2γ2 (10 mm GABA) and α3β2γ2 (50 mm GABA) receptors Average currents are shown superimposed with a thick line for α1β2γ2 receptors and a thin line for α3β2γ2 receptors. Inset: the same currents at an expanded time scale. (B–E) Summary of the parameters derived from a triple exponential fitting of decay of α1β2γ2 and α3β2γ2 receptor GABA-gated currents with (in B) the relative contribution of each component to peak amplitude (A1–A3) and (in C–E) each of the time constants. (F) Weighted averages of deactivation time constants are shown for α1β2γ2- and α3β2γ2-mediated currents. Each bar represents the mean ± SEM of six patches for α1β2γ2 receptors and nine patches for α3β2γ2 receptors studied. Traces are normalized to the same peak amplitude. *P < 0.05 indicates a significant difference between subunits.
The pronounced differences in decay kinetics determined for α1β2γ2 and α3β2γ2 receptors indicate profound differences in the gating properties of these two receptor subtypes. As a saturating GABA concentration was used, the time evolution of currents is expected to depend mainly on the kinetics of conformational transitions between bound states and on the unbinding rate. In particular, such a substantial difference in the slow deactivation components (Fig. 3) potentially represents differences in the opening/closing, desensitization/resensitization and unbinding rates. However, the analysis of the deactivation kinetics alone cannot provide sufficient information to reliably estimate so many distinct rate constants and therefore additional results from different experimental protocols were needed.
Faster rate and larger extent of apparent desensitization for α1β2γ2 compared with α3β2γ2 receptors
The deactivation time course has been shown to critically depend on the desensitization kinetics (Jones & Westbrook, 1995). Moreover, as already mentioned above, different onset rates of currents elicited by saturating [GABA] for α1β2γ2 and α3β2γ2 receptors (Fig. 2) might involve differences in the desensitization process in the two receptors. Thus, in order to explore the gating properties of these two receptors it is crucial to describe their desensitization kinetics. For this purpose, currents evoked by prolonged applications of saturating [GABA] were studied. Figure 4A shows examples of currents evoked by long pulses (3 s) of saturating [GABA]. Currents mediated by α1β2γ2 and α3β2γ2 channels (in the 3 s time window considered) showed a sharp peak followed by fading, characterized by at least three exponential components. However, the apparent desensitization time courses observed in α1β2γ2 and α3β2γ2 receptor-mediated currents were remarkably different. In particular, α1β2γ2-mediated currents showed a pronounced fast component with respect to α3β2γ2 (Fig. 4A insert). The fast time constants (τ1) obtained in α1β2γ2 and α3β2γ2 currents were 2.9 ± 0.1 (n = 7) and 7.5 ± 0.7 ms (n = 7), respectively (P < 0.05) and the relative weight of the fast component (A1) in α1β2γ2 was more than three times larger than that observed in α3β2γ2 (0.56 ± 0.025, n = 7 and 0.19 ± 0.03, n = 7, respectively, P < 0.05, Fig. 4B). The middle (τ2) and slow (τ3) time constants were also much faster in α1β2γ2 with respect to α3β2γ2 (Fig. 4C). Moreover, the relative weight of the steady-state component was significantly larger in α3β2γ2-mediated currents when compared with the α1β2γ2 currents (0.286 ± 0.04, n = 7 and 0.076 ± 0.013, n = 7 in α3β2γ2 and α1β2γ2, respectively, P < 0.05, Fig. 4B). These data show that, following prolonged GABA application, α1β2γ2 receptors are quickly absorbed into the desensitized state(s) (in ∼3 ms the current is reduced by more than one half). Moreover, a very low steady state to peak ratio in α1β2γ2-mediated currents indicates that these receptors are efficiently trapped into the desensitized state(s). In contrast, α3β2γ2 receptors are characterized by a markedly slower rate and smaller extent of apparent desensitization (Fig. 4). According to the prediction of the model of Jones & Westbrook (1995), a stronger desensitization would favor prolongation of the slow deactivation component. However, the fact that deactivation of α1β2γ2-mediated currents is markedly faster than that of α3β2γ2 receptors (Fig. 3) should not be regarded as a discrepancy as deactivation could be additionally shaped by other rate constants that might differ between considered receptor types. In particular, the impact of desensitization on current deactivation is largely determined by the rate of the agonist unbinding (koff) that, as suggested by channel burst analysis (see later), is slower in α3β2γ2 receptors. The combination of slower unbinding and weaker desensitization in α3β2γ2 receptors is considered in detail in the Model simulations section below. It is likely that these differences in desensitization kinetics underlie, at least partially, faster onset kinetics in α1β2γ2-mediated currents evoked by saturating [GABA] (Fig. 2, see also Model simulations section below).
Fig. 4.

Comparison of desensitization of currents elicited by GABA applications between α1β2γ2 and α3β2γ2 channels. (A) Normalized average of five responses induced by 3 s applications of saturating GABA (GABA Sat.) to a patch excised from human embryonic kidney cells expressing α1β2γ2 (10 mm GABA) and α3β2γ2 (50 mm GABA) receptors. Average currents are shown superimposed with a thick line illustrating current from α1β2γ2 receptors and a thin line illustrating that from α3β2γ2 receptors. The initial phase of the GABA currents is shown at an expanded scale in an inset at the bottom right. Traces are normalized to the peak amplitude. (B) Summary of the relative contributions of each component to the peak amplitude (A1–A3 and steady-state) of triple exponential curves used to fit the decay of α1β2γ2 and α3β2γ2 receptor GABA-gated currents to a steady-state value (SS). (C) Each of the three time constants used for the fitting is reported for α1β2γ2 and α3β2γ2 receptors. Each bar represents the mean ± SEM of three patches for α1β2γ2 receptors and seven patches for α3β2γ2 receptors studied per each subunit combination. *P < 0.05 indicates a significant difference between subunits.
In addition, we studied the kinetics of the current relaxation after a long (3 s) pulse. The deactivation process was markedly slower in α3β2γ2 with respect to α1β2γ2 receptors, with weighted time constants of 743.3 ± 73.7 and 364 ± 40 ms, respectively (n = 7). These results produce further evidence that the coupling between desensitization and deactivation kinetics is similar in both α1β2γ2 and α3β2γ2 receptors.
α3β2γ2-mediated currents show faster recovery in paired-pulse experiments
In order to further explore the impact of desensitization and unbinding rate on α1β2γ2- and α3β2γ2-mediated currents evoked by brief GABA pulses, a standard paired-pulse protocol was employed (pairs of 2 ms applications of saturating [GABA] separated by a variable interpulse interval). A markedly lower amplitude of the second response to GABA shows that even a short (2 ms) agonist pulse results in a dynamic entry into the desensitized states of both receptor types (Fig. 5A). Figure 5B and C shows the time course of recovery for α1β2γ2 and α3β2γ2 receptors, indicating that this process is considerably faster in the latter. For both receptor types, the time evolution of recovery showed two exponential components. Both fast and slow components were faster in α3β2γ2 with respect to α1β2γ2, although the difference observed in the fast component was more pronounced than that in the slow component (τ1 = 6.8 ms, τ2 = 1836.4 ms for α3β2γ2, n = 6 and τ1 = 103.2 ms, τ2 = 7642.3 ms for α1β2γ2, n = 5, Fig. 5). In contrast, the relative weights of the fast and slow recovery components were similar in the two receptor subtypes (A1 = 0.5, A2 = 0.5 for α3β2γ2 and A1 = 0.53, A2 = 0.47 for α1β2γ2, Fig. 5). These data clearly show that the impact of the desensitization process on currents elicited by brief and saturating GABA pulses is much stronger in α1β2γ2 than in α3β2γ2 receptors. This finding is consistent with the faster and more profound desensitization of α1β2γ2 receptors observed in experiments in which prolonged and saturating [GABA] pulses were applied (Fig. 4). However, at present, it is difficult to precisely estimate to what extent a faster recovery and a smaller rate and extent of desensitization of α3β2γ2 receptors are a consequence of a slower entry into the desensitized conformation(s) or of a faster exit from this state(s). In particular, it should be borne in mind that faster recovery in the paired-pulse experiments (Fig. 5) does not necessarily reflect a faster resensitization rate (transition rate from desensitized to closed state) as the recovery process is known to critically depend also on unbinding and on the desensitization rate (Jones & Westbrook, 1995; Mozrzymas et al., 2003a).
Fig. 5.

Recovery process in the paired-pulse experiments differs between α1β2γ2 and α3β2γ2 channels. (A) Examples of normalized averages of five traces evoked by two successive applications of 2 ms GABA (10 and 50 mm) pulses separated by 30 ms intervals in a patch excised from human embryonic kidney (HEK) cells expressing α1β2γ2 (left) and α3β2γ2 (right) receptors. (B) Comparison of the recovery time course of the second response from desensitization in at least 15 patches excised from HEK cells expressing α1β2γ2 (◊) and α3β2γ2 (•) receptors. The percent recovery at each designated separation of two brief GABA pulses is calculated as described in Materials and methods, and plotted against the interpulse interval. Each data point represents the mean ± SEM of eight patches studied. (C) The data in B are shown at an expanded time scale to better illustrate the components of the double exponential fitting of the recovery.
Additional important information coming from paired-pulse experiments is the presence of a very slow recovery component in both α1β2γ2 and α3β2γ2 receptors (∼8 and 2 s, respectively). Although slow (τ ∼10 s) desensitized states have already been described for GABAARs, especially in experiments in which long pulses of GABA were applied (e.g. Mozrzymas & Cherubini, 1998; Hutcheon et al., 2000; Overstreet et al., 2000), it is commonly believed that such a long-lasting desensitization component is unlikely to play any important role in shaping currents evoked by brief agonist pulses. In contrast, our data provide evidence that a GABA pulse as short as 2 ms is sufficient to induce conformational transitions towards desensitized states living for several seconds.
α1β2γ2 and α3β2γ2 receptors show similar opening/closing kinetics but differ in burst duration
As stated above, the rise time of currents evoked by saturating concentrations of GABA may depend on both opening/closing and desensitized state(s) but a direct estimation of contributions of these conformational transitions is not straightforward. In order to address this issue, gating properties of these two receptor subtypes were studied at the single-channel level. By analysing the intraburst kinetics it is possible to extract information about the kinetics of the open/closed transitions. Within a burst, in fact, the receptor is believed to experience fast transitions between open/closed states prior to unbinding of the agonist or entering into long-living non-conductive states (e.g. desensitized states). Single-channel currents were recorded (Fig. 6A) from excised patches continuously exposed to GABA-containing solution (100 and 600 µm for α1β2γ2 and α3β2γ2 receptors, respectively). These concentrations are considerably above the EC50 values for these receptors (Verdoorn, 1994; Gingrich et al., 1995) and it is therefore expected that the single-channel activity mainly reflects the transitions between fully-bound conformations. The single-channel conductance was the same for α1β2γ2 and α3β2γ2 (27.7 ± 0.8 and 27.1 ± 0.6 pS, respectively, n = 5, Fig. 6C). Openings at subconductance levels were observed in both α1β2γ2 and α3β2γ2 receptors but their occurrence was less than 1% of the total openings and they were discarded from the analysis. The intraburst open time distributions obtained from both α1β2γ2- and α3β2γ2-mediated single-channel currents were best fitted by two exponential probability density functions and, interestingly, the time constants together with respective percentages and mean open time found for α1β2γ2 receptors were indistinguishable from those observed for α3β2γ2 receptors (Fig. 6C). As detailed in Materials and methods, the critical end-burst closed time was calculated from the analysis of closed time distributions. For both receptor types, a sum of up to five exponential functions was used to fit these distributions well. For both α1β2γ2 and α3β2γ2 receptors, the values of the two shortest time constants showed small cell-to-cell variability and were interpreted as intraburst closures, whereas the slowest time constant was variable and strongly depended on the number of channels present in the patch and probably represented closed (or desensitized) periods between bursts. No significant difference was found when comparing the two shortest closed time constants for α3β2γ2 channels with those determined for α1β2γ2 receptors (τ1 = 0.45 ± 0.035 ms and τ2 = 2.09 ± 0.052 ms compared with τ1 = 0.49 ± 0.03 ms and τ2 = 2.62 ± 0.36 ms for α1β2γ2 and α3β2γ2 receptors, respectively; P > 0.05, each measurement made for at least n = 10 patches). The lack of significant difference in either open or closed times within bursts indicates that the opening/closing kinetics of α1β2γ2 and α3β2γ2 receptors do not differ.
Fig. 6.

Comparison between α1β2γ2 and α3β2γ2 GABA-channel currents elicited by long-lasting GABA application. (A) Channel activity evoked by long-lasting applications of GABA to outside-out patches excised from human embryonic kidney (HEK) cells expressing α1β2γ2 (top, 100 µm GABA) and α3β2γ2 (bottom, 600 µm GABA) receptors (holding potential, −100 mV). Inset: a fraction of the single-channel current activity at an expanded time scale. Corresponding calibration bars are shown in the lower right corner of traces. (B) Distribution of open time (top) and burst durations (bottom) for the patches in A. Distributions are fitted with a double exponential function. (C) Summary of chord conductance and open times characterizing the main conductance state of single-channel current in at least 10 patches excised from HEK cells expressing α1β2γ2 and α3β2γ2 receptors. (D) A comparison of average burst length of α1β2γ2 and α3β2γ2 channels in these patches and the parameters (A2, τ1 and τ2) from double exponential fitting of burst duration distributions as in B. *P < 0.05 indicates a significant difference between subunits.
In the same recordings for which open and closed distributions were determined, burst analysis was additionally performed for both receptor types (Fig. 6B). As shown in Fig. 6D, α3β2γ2 receptors showed significantly longer bursts than α1β2γ2 receptors. In particular, the averaged burst duration was nearly 60% longer for α3β2γ2 receptors and this difference was associated with both a considerably larger slow burst time constant and its percentage in these receptors (Fig. 6D). No significant differences were found between the respective time constants of the fast components of burst distributions.
To obtain a further link between information from macroscopic currents (such as, e.g. in Figs 1–5) and single-channel currents, patches with low number of channels were used for single-channel recordings (Fig. 7A and B) when applying the protocol depicted in Fig. 3 to record the deactivation kinetics (2 ms pulse of saturating [GABA]). Figure 7B illustrates a more typical occurrence of GABA responses in multichannel patches. Although the large number of channels prevented a detailed analysis, it was clear that patches from α3β2γ2 receptors expressing human embryonic kidney cells were endowed with more frequent late openings. In patches with a small number of channels, the mean open times of α1β2γ2 and α3β2γ2 receptors, determined for 4 s time windows, were not significantly different (1.42 ± 0.05 ms, n = 6 and 1.57 ± 0.07 ms, n = 7). When analysing the entire trace after GABA applications, the mean burst duration was longer for α3β2γ2 receptors (Fig. 7D), similar to that observed in steady-state conditions (Fig. 6). However, in both receptor types the burst duration measured in the considered non-equilibrium conditions was clearly shorter than those obtained in the steady-state (compare Figs 6D and 7C and D). This difference is likely to reflect the fact that upon deactivation burst can be terminated not only by entrance into a bound non-conductive state but additionally by dissociating the agonist. However, the vast majority of our recordings were collected from multichannel patches and therefore precise assessment of the impact of these two mechanisms is not possible. To further address this issue, the single-channel analysis was performed for three arbitrarily defined epochs: 0–500, 500–1000 and >1000 ms after brief GABA application. As shown in Fig. 7D, in both α1β2γ2 and α3β2γ2 receptors the mean burst duration is clearly decreasing in successive epochs, further indicating that the relative proportion of brief events is increasing during late phases of deactivation. The last finding may also suggest an increased proportion of short-living singly-bound open states in the late epochs (Macdonald et al., 1989).
Fig. 7.

Comparison between α1β2γ2 and α3β2γ2 GABA-channel currents elicited by brief GABA applications. (A) Multiple records of 1 s illustrating channel activity evoked by 2 ms applications of GABA to outside-out patches in two patches excised from human embryonic kidney (HEK) cells expressing single α1β2γ2 (left, 10 mm GABA) and α3β2γ2 (right, 50 mm GABA) channels (holding potential, −100 mV). The mean current resulting from the average of the single-channel records is shown in the bottom trace (right and left panel). (B) Two records of 2 s illustrating channel activity evoked by 2 ms applications of GABA to outside-out patches in two patches excised from HEK cells expressing many α1β2γ2 (top, 10 mm GABA) and α3β2γ2 (bottom, 50 mm GABA) channels (holding potential, −100 mV). Individual channel activity is visible in the tail of these currents. (C) Comparison of mean burst length for α3β2γ2 and α3β2γ2 channels measured during the entire recording period (4 s). (D) Comparison of mean burst lengths in three epochs: 0–500 ms (Epoch 1), 500–1000 ms (Epoch 2) and >1000 ms (Epoch 3). Note that burst durations tend to decrease with time after applications. (E) Comparison of frequencies of late openings (in Epoch 3) for α1β2γ2 and α3β2γ2 receptors. Note that frequency of late openings is several times larger in α3β2γ2 receptors. *P < 0.05 indicates a significant difference between subunits.
Taking advantage of single-channel recordings, we compared the frequency of late single-channel openings of α1β2γ2 and α3β2γ2 receptors in the third epoch (1000–4000 ms). The frequency of late openings was normalized to the Np value at peak (where N is number of channels and p is open probability at peak, Np was calculated as the ratio of peak current and single-channel current). As shown in Fig. 7E, the frequency of late openings was much larger in α3β2γ2 receptors. The original model of Jones & Westbrook (1995) predicts that strongly absorbing desensitized states should favor late single-channel openings. In α1β2γ2 receptors, both the rate and extent of desensitization were particularly strong. In this situation, late openings, following sojourns in strongly absorbing desensitized state(s), could be scattered over a long period of time yielding an undetectable contribution to the macroscopic currents. Alternatively, fully-bound receptor in the desensitized state might dissociate the agonist molecule thus reducing the duration of deactivation and the probability of late openings due to interruption of ‘oscillation’ between fully-bound desensitized, closed and open states. These possibilities are further investigated in the next section.
Model simulations
The data collected here indicate that functional differences between α1- and α3-containing GABAARs lie in both ligand-binding properties (affinity) and in the kinetics of conformational transitions between bound states (gating). However, the major difficulty in assessing the contribution of any particular transition rate is that the time course of the measured currents reflects a complex process that is potentially shaped by all of the conformational transitions functionally coupled to each other (Colquhoun, 1998; Mozrzymas et al., 2003a). In particular, knowledge of the affinity coefficient alone, in non-stationary conditions, is of limited usefulness as binding and unbinding rates might shape different kinetic characteristics of GABAergic currents (Jones et al., 1998). For instance, when considering the responses to brief applications of GABA (e.g. synaptic currents), the binding rate would determine the proportion of GABAARs that become bound during exposure to the agonist, whereas the unbinding rate would play a crucial role in shaping the current deactivation. Moreover, the time course of GABA-evoked currents depends on the transition rates between bound conformations of the receptor (closed, open and desensitized states). Taking this into account, model simulations were used to explore the differences in binding and gating properties of α1- and α3-containing GABAARs. For this purpose, we used a model based on that of Jones & Westbrook (1995). This model, assuming sequential binding of two agonist molecules and opening/desensitization originating from the closed bound state, although simplified, is known to reasonably reproduce the basic properties of GABAAR gating (Jones & Westbrook, 1995; Mozrzymas et al., 2003a,b). Moreover, the fact that deactivation mediated by α1β2γ2 and α3β2γ2 receptors shows a similar desensitization/deactivation coupling suggests that the gating schemes of these receptors share major common features. Thus, as a starting point we adapted this model to reproduce the basic kinetic properties of α1β2γ2 receptors and, secondly, we made an attempt to introduce a minimum of modifications in the respective rate constants to explore the major kinetic differences between α1β2γ2 and α3β2γ2 receptors. The rate constants used for description of the α1β2γ2 receptor kinetics were manually selected to best reproduce the kinetic behavior of these receptors in all considered experimental protocols. The most apparent difference between α1β2γ2 and α3β2γ2 receptors was a dramatically slower current onset of responses elicited by non-saturating [GABA] in the case of α3β2γ2 receptors (Fig. 1), suggesting a substantially lower value of the association rate constant kon. Moreover, both the rate and extent of desensitization were markedly smaller in the case of α3β2γ2 receptors (Fig. 4), suggesting a smaller desensitization (d2) and/or a faster resensitization (r2) rate. Similarly, a faster recovery in the paired-pulse experiments of α3 subunit-containing receptors (Fig. 5) suggests smaller desensitization and resensitization rates (d2 and r2) in α3β2γ2 receptors. However, the recovery process may additionally depend on the unbinding rate koff (Jones & Westbrook, 1995; Mozrzymas et al., 2003a). The onset rate of current responses to saturating GABA is slower for α3β2γ2 receptors than for α1β2γ2 receptors indicating a difference in kinetics of fully-bound conformational transitions. However, as already mentioned, this feature potentially depends not only on the opening/closing rates but also on the desensitization kinetics (Mozrzymas et al., 2003a).
The most striking feature of the α3β2γ2 receptor is that, in spite of its lower apparent affinity (with respect to α1β2γ2), the deactivation of currents mediated by these receptors is much slower than that of α1β2γ2 GABAARs. Moreover, as mentioned above, such a slow deactivation is associated with a relatively weak desensitization in comparison to α1β2γ2 receptors.
The lack of difference in the single channel open and closed time distributions for α1β2γ2 and α3β2γ2 receptors indicates that the rate constants governing transitions between fully-bound open and closed states (β2 and α2) are not substantially different.
Taking into account these results, we made an attempt to reproduce the major kinetic differences between the α1β2γ2 and α3β2γ2 GABAARs by manipulating kon, koff, d2 and r2 rate constants. As expected, a decrease in the binding rate kon was sufficient to reproduce a slower onset of responses to non-saturating [GABA]. Moreover, a reduction in the d2 rate constant alone allowed reproduction of a decrease in the rate and extent of desensitization as well as the acceleration of the recovery process in the double-pulse protocol (Figs 4 and 5). However, the reproduction of remarkably slower deactivation of currents mediated by α3β2γ2 receptors (Fig. 1) required setting the unbinding rate considerably slower than for α1β2γ2 receptors. Additional support for a slower unbinding rate of α3β2γ2 receptors comes from the analysis of the single-channel currents in the stationary and non-stationary conditions. Although no clear differences were seen in the single open channel distributions (Figs 6 and 7), the considerably longer burst duration observed for α3β2γ2 might indicate a slower unbinding for this receptor type (Figs 6 and 7).
Based on our experimental findings, in a first set of model simulations using the model of Jones & Westbrook (1995), an attempt was made to reproduce the kinetic behavior of α3β2γ2 receptors by decreasing kon, koff, d2 and r2 with respect to the respective rate constant used for α1β2γ2 receptors. The rate constants for α1β2γ2 receptors were kon = 3.0/ms/mm, koff = 0.03/ms, d2 = 2/ms, r2 = 0.02/ms, β2 = 2.5/ms, α2 = 0.284/ms, d1 = 0.013/ms, r1 = 0.00013/ms; β1 = 0.2/ms and α2 = 1.11/ms whereas those for α3β2γ2 receptors were kon = 0.3/ms/mm, koff = 0.03/ms, d2 = 0.2/ms, r2 = 0.015/ms, β2 = 2.5/ms, α2 = 0.284/ms, d1 = 0.013/ms, r1 = 0.00013/ms, β1 = 0.2/ms and α2 = 1.11/ms. Such changes enabled us to qualitatively reproduce all major kinetic differences between responses mediated by α3β2γ2 and α1β2γ2 receptors: slower rise time of currents evoked by high (10 mm) and low (10–300 µm) GABA concentrations, slower deactivation, smaller rate and extent of desensitization, and accelerated recovery from desensitization in the case of the former (data not shown). However, manipulations of the kon, koff, d2 and r2 rate constants (assuming other rate constants equal) turned out to be insufficient to assure adequate quantitative reproduction of our experimental data. In general, the major difficulty was to concomitantly reproduce a substantial slower deactivation together with faster recovery in paired-pulse experiments for α3β2γ2 with respect to α1β2γ2 (Figs 3 and 5). Taking this into account we made an attempt to consider some parsimonious explanations for this discrepancy. As stated above, the desensitization of α1β2γ2 receptors is much stronger than that of α3β2γ2 receptors (Figs 4 and 5). Such a strongly absorbing desensitized state as that of α1β2γ2 receptor is expected to favor a slow deactivation and the appearance of late single-channel openings following a brief application of saturating GABA pulse (see Fig. 7 for examples of late openings). However, as shown in Figs 3 and 7, the deactivation is slower and the occurrence of late openings is considerably more frequent for α3β2γ2 receptors. An intuitive explanation for this observation is that α1β2γ2 receptors might exit from desensitization at an extremely slow and therefore undetectable rate, a behavior theoretically predictable by the model of Jones & Westbrook (1995). Alternatively, it could be speculated that α1β2γ2 receptors might have a higher tendency to dissociate the agonist during a sojourn in the fully-bound desensitized state than the α3β2γ2 receptors. The possibility of agonist binding and unbinding directly from desensitized states has been previously applied in the revised model proposed by Jones et al. (1998). One could consider unbinding from the fully-bound open state but such transition would affect open and closed time distributions. Similarly, open and closed time distributions could be affected by the desensitized state originating from the fully-bound conformation, although the presence of a very slow desensitized state cannot be excluded. We therefore have tested the impact of such additional transitions with our simulation (Fig. 8A) and assumed that the proportions between binding and unbinding for desensitized states roughly follow the pattern of binding and unbinding between closed states (i.e. binding is much faster in the case of α1β2γ2 and unbinding is slower for α3β2γ2 receptors). Addition of the transitions between singly- and doubly-bound desensitized states produced an acceleration of the slow deactivation component, and resulted in better reproduction of the experimental data. Clearly, dissociation of the agonist during the deactivation phase (in the absence of free agonist) precludes the receptor from visiting the long-living open conformation. Thus, inclusion of agonist binding and unbinding from the desensitized states with the assumption that unbinding is faster in the case of α1β2γ2 receptors allowed to reproduce more accurately, with respect to the model presented above, all major differences between the α1 and α3 subunit-containing GABAARs (Fig. 8B–F, Table 1). It has to be stressed, however, that the presence of such transitions between desensitized states is only indirectly suggested by the experimental evidence and therefore their actual occurrence remains speculative.
Table 1.
Comparison of simulated data: frame models of Jones & Westbrook (1995) and Jones et al. (1998) with the experimental data here
| Rise time at 10 mm (ms) | Deactivation τw (ms) | Desensitization (steady-state:peak) | Paired-pulses recovery (gap 100 ms) | Residuals | |
|---|---|---|---|---|---|
| α1β2γ2 frame model of Jones & Westbrook (1995) | 0.39 | 31.3 | 0.16 | 0.41 | 0.0022 |
| α1β2γ2 frame model of Jones et al. (1998) | 0.40 | 35.1 | 0.19 | 0.32 | 0.0019 |
| α1β2γ2 experimental data | 0.29 ± 0.02 | 52.5 ± 2.9 | 0.21 ± 0.02 | 0.33 ± 0.03 | – |
| α3β2γ2 frame model of Jones & Westbrook (1995) | 1.18 | 139.5 | 0.46 | 0.6 | 0.0097 |
| α3β2γ2 frame model of Jones et al. (1998) | 1.19 | 160.0 | 0.48 | 0.46 | 0.0027 |
| α3β2γ2 experimental data | 1.01 ± 0.08 | 185.0 ± 30.0 | 0.53 ± 0.07 | 0.48 ± 0.05 | – |
Simulated values obtained using both the model frames of Jones & Westbrook (1995) and Jones et al. (1998) are compared with the experimental data for four α1β2γ2 and α3β2γ2 critical protocols: (i) 10–90% rise time measured at 10 mm GABA; (ii) deactivation kinetics (weighted time constant); (iii) desensitization steady-state:peak ratio (measured at 200 ms) and (iv) fractional recovery in paired-pulse experiments (gap 100 ms). The normalized residuals (see Materials and methods) show that the model frame of Jones et al. (1998) provided a better reproduction of our experimental data.
Altogether, our simulation reproduced the major kinetic differences between α3β2γ2 and α1β2γ2 receptors with the following minimum requirements: slower binding (kon), unbinding (koff), desensitization (d2) and resensitization (r2) rates for α3β2γ2 receptors. In addition, we speculate that the agonist can bind and unbind from the receptor in the desensitized state and, similarly as in the case of the closed state, both binding (q) and unbinding (p) are slower in the case of α3β2γ2 receptors.
Discussion
In the present work we investigated the mechanisms underlying the different kinetic behavior of α1β2γ2 and α3β2γ2 GABAARs. The crucial finding of this study is that these receptors are characterized by profoundly different desensitization kinetics and that this difference has a strong impact on current kinetics mediated by these channels. We confirm that α3β2γ2 receptors are characterized by a peculiar pattern of interaction with agonist characterized by extremely slow binding and slow unbinding (Gingrich et al., 1995). Single-channel analysis provided evidence that the opening/closing kinetics of α1β2γ2 and α3β2γ2 receptors are not significantly different. This information considerably reduced the number of degrees of freedom in our attempts to express kinetic differences between these receptors in terms of receptor gating. However, in both steady-state and non-equilibrium conditions (Figs 6 and 7), the burst durations were longer in α3β2γ2 than in α1β2γ2 receptors further suggesting a slower unbinding rate in α3β2γ2 than in α1β2γ2 receptors.
In addition, the coupling between desensitization and deactivation kinetics (similar in both α1β2γ2 and α3β2γ2 receptors) suggested that the backbone of the kinetic scheme governing the gating of these two receptors might be similar.
The most striking feature of α3β2γ2 GABAARs is the combination of a slow deactivation associated with relatively weak desensitization and low apparent affinity. We suggest that, due to the profound and fast desensitization in α1β2γ2 receptors, most of them would be quickly desensitized (within a few milliseconds) making the overall deactivation process faster than that measured for α3β2γ2 receptors. Thus, after a fast and massive entry into desensitization, the exit of α1β2γ2 receptors from this strongly absorbing state would be slow, giving rise to a small and hardly detectable current. In contrast, in α3β2γ2 receptors a weaker entry in desensitization would partially preclude this mechanism with a consequent slowing down of the deactivation process. This would also explain the less frequent occurrence of late openings in α1β2γ2 single-channel currents with respect to those of α3β2γ2. In α1β2γ2, late reopenings of receptors exiting from a slow desensitized state could be scattered over a long period of time, producing undetectable macroscopic currents. This scenario does not contradict the framework of Jones & Westbrook (1995) and actually generalizes their theory by pointing out that the proposed slowing down of deactivation by desensitization is true only in a defined range of desensitization/resensitization and unbinding rate constant values.
Our data indicate that the change of binding/unbinding and desensitization onset is a minimum requirement to reproduce the observed different kinetic pattern in α1β2γ2- and α3β2γ2-mediated currents. Nevertheless, by keeping the structure proposed by Jones & Westbrook (1995) only a qualitative reproduction of the experimental data could be achieved. This leaves room for further speculation about the differences in gating of these two receptor subtypes. Thus, in an attempt to improve the formal fit with our experimental data, as detailed in the Model simulations section above, we assume, as a matter of speculation, transitions between singly- and doubly-bound desensitized states (designated by thick arrows in the model in Fig. 8A). These transitions were previously proposed in a revision of their model by Jones et al. (1998) but the p and q rate constants were considerably smaller than those estimated from our results in the present study. It is of note that the presence of these transitions might affect the frequency of late openings; for the late single-channel openings after brief application of saturating [GABA], fully-bound desensitized receptors, instead of returning to the doubly-bound closed state, might unbind the agonist molecule and return (possibly via singly-bound open conformation) to the closed unbound conformation. We therefore suggest that multiple sojourns in the desensitized closed and open states prior to unbinding of the agonist (Jones & Westbrook, 1995) set the upper limit for the duration of deactivation whereas unbinding from the fully-bound desensitized state shortens this process. Such a shortening would be more efficient for α1β2γ2 than for α3β2γ2 channels because of stronger accumulation in the desensitized state (due to a markedly larger desensitization rate with the same resensitization rate, see Model simulations section above) and faster unbinding from the desensitized state in α1β2γ2 receptors. Chang et al. (2002) provided direct evidence for unbinding from the bound desensitized state of recombinant α1β2γ2 receptors, expressed in Xenopus oocytes, by measuring [3H]GABA release. However, the resolution of the binding measurements applied in their experiments allowed the consideration of only very slow desensitization processes (in the range of several seconds) and therefore a direct qualitative comparison to our data is not possible. It is worth emphasizing that, due to transitions between bound desensitized states combined with sufficiently fast unbinding, an increase in the rate and extent of desensitization might correlate with an acceleration of deactivation kinetics, contrary to the prediction of the original model of Jones & Westbrook (1995).
As discussed above, consideration of binding and unbinding between singly- and doubly-bound desensitized states improved the fit of our data. We cannot exclude, however, that additional transitions could take place. For instance, although several additional possibilities are offered by allosteric models (e.g. Scheller & Forman, 2002; Rusch & Forman, 2005) in which many extra transitions are allowed (e.g. between fully-bound open and desensitized states), these transitions did not appear essential to explain our major observations.
Our data further underscore specific roles played by binding and unbinding rates in shaping the current responses in non-equilibrium conditions (Jones et al., 1998). A receptor with the same affinity as the α3β2γ2 channel but with faster binding and unbinding would give rise to a profoundly different time course of current responses. A key feature of the α3β2γ2 receptor is an extremely slow unbinding rate that favors multiple sojourns of the receptor in the fully-bound states. As desensitization of this receptor is weaker than in α1β2γ2 channels, there is a higher probability of multiple entrances into the open state in α3β2γ2 receptors. Moreover, as already mentioned, the slower unbinding rate gives rise to longer burst durations in these channels, further increasing the overall open probability for this receptor. The properties of α3β2γ2 receptors illustrate a very efficient functional coupling between conformational states of the channel (Colquhoun, 1998; Mozrzymas et al., 2003a). Clearly, the channel properties (binding and unbinding) that define the receptor affinity are functionally ‘interacting’ with transitions between bound states defined as gating and this phenomenon is particularly favored by the slow unbinding rate.
The physiological role of the kinetic differences between α1β2γ2 and α3β2γ2 receptors is not clear. Kinetics of deactivation is believed to play a pivotal role in shaping the time course of synaptic currents. Indeed, synaptic GABAergic currents may last as long as hundreds of milliseconds, whereas synaptically released agonist is present within the synaptic cleft for less than 1 ms (Clements, 1996; Mozrzymas, 2004). Fast kinetics of α1β2γ2 channels suggests that these receptors could be involved in processes requiring high temporal resolution (e.g. rapid synaptic currents participating in coincidence detection), whereas slow α3β2γ2 channels would be more suitable in phenomena requiring lower temporal precision but a more sustained action. Gao et al. (1993) stained neurons in Raphe nuclei with antisera that recognize α1 and α3 subunits, and found that the vast majority of serotonergic neurons expressed the α3 subunit. Browne et al. (2001) analysed GABAergic synaptic currents and single-channel kinetics in the reticular nucleus and ventrobasal complex, and attributed the observed differences to differential expression of α1 and α3 subunits in these brain areas. More recently, Yee et al. (2005) investigated α3 knockout mice and found that the lack of GABAARs containing this subunit was associated with a hyperdopaminergic phenotype, similar to that observed in schizophrenia. It may be hypothesized that slow kinetics of receptors containing α3 subunits offers some advantages for the physiological role of neurons releasing these monoamines. Interestingly, during development, the expression of the α3 subunit decreases whereas that of the α1 subunit increases and this expression pattern is accompanied by a trend of acceleration of GABAergic synaptic currents (for review see Vicini & Ortinski, 2004). Moreover, we have recently found that the synaptic GABA transient in cerebellar interneurons is more robust at early developmental stages (Barberis et al., 2005), thus making the response of synapses containing α3β2γ2 receptors more effective. The extremely slow binding rate of α3β2γ2 channels is expected to result in trimming down of the size of the synaptic response due to brief GABA transients and makes these channels better suited to respond only to repetitive synaptic transients such as those occurring with high-frequency stimulation. In conclusion, the kinetic analysis presented here provides evidence that the major differences in α1β2γ2 and α3β2γ2 receptor functioning are due to the slower rate and smaller extent of desensitization, and slower binding and unbinding rates. We speculate that such a slower binding/unbinding rate in α3β2γ2 receptors (with respect to α1β2γ2) may also occur between desensitized states.
Acknowledgments
Supported by NIMH grant MH64797 and Wellcome Trust International Senior Research Fellowship in Biomedical Science (grant no. 070231/Z/03/Z).
Glossary
Abbreviations
- GABAAR
GABAA receptor
References
- Barberis A. Developmental changes of GABA synaptic transient in cerebellar granule cells. MolPharmacol. 2005;67:1221–1228. doi: 10.1124/mol.104.006437. [DOI] [PubMed] [Google Scholar]
- Bohme I. Four amino acids in the alpha subunits determine the gamma-aminobutyric acid sensitivities of GABAA receptor subtypes. JBiolChem. 2004;279:35 193–35 200. doi: 10.1074/jbc.M405653200. [DOI] [PubMed] [Google Scholar]
- Browne SH. Kinetic and pharmacological properties of GABAA receptors in single thalamic neurons and GABAA subunit expression. JNeurophysiol. 2001;86:2312–2322. doi: 10.1152/jn.2001.86.5.2312. [DOI] [PubMed] [Google Scholar]
- Chang Y. Desensitization mechanism of GABA receptors revealed by single oocyte binding and receptor function. JNeurosci. 2002;22:7982–7990. doi: 10.1523/JNEUROSCI.22-18-07982.2002. [DOI] [PMC free article] [PubMed] [Google Scholar]
- Chen C. High-efficiency transformation of mammalian cells by plasmid DNA. MolCellBiol. 1987;7:2745–2752. doi: 10.1128/mcb.7.8.2745. [DOI] [PMC free article] [PubMed] [Google Scholar]
- Clements JD. Transmitter timecourse in the synaptic cleft: its role in central synaptic function. Trends Neurosci. 1996;19:163–171. doi: 10.1016/s0166-2236(96)10024-2. [DOI] [PubMed] [Google Scholar]
- Colquhoun D. Binding, gating, affinity and efficacy: the interpretation of structure-activity relationships for agonists and of the effects of mutating receptors. BrJPharmacol. 1998;125:924–947. doi: 10.1038/sj.bjp.0702164. [DOI] [PMC free article] [PubMed] [Google Scholar]
- Colquhoun D. Fast events in single channel currents activated by acetylcholine and its analogues at the frog muscle end-plate. JPhysiol. 1985;369:501–557. doi: 10.1113/jphysiol.1985.sp015912. [DOI] [PMC free article] [PubMed] [Google Scholar]
- Colquhoun D. Fitting and statistical analysis of single-channel records. In: Sakmann B, editor. Single-Channel Recording. 2. New York: Plenum Press; 1995. pp. 231–243. [Google Scholar]
- Fritschy JM. Formation and plasticity of GABAergic synapses: physiological mechanisms and pathophysiological implications. PharmacolTher. 2003;98:299–323. doi: 10.1016/s0163-7258(03)00037-8. [DOI] [PubMed] [Google Scholar]
- Gao B. Neuron-specific expression of GABAA-receptor subtypes: differential association of the alpha 1- and alpha 3-subunits with serotonergic and GABAergic neurons. Neuroscience. 1993;54:881–892. doi: 10.1016/0306-4522(93)90582-z. [DOI] [PubMed] [Google Scholar]
- Gingrich KJ. Dependence of the GABAA receptor gating kinetics on the alpha-subunit isoform: implications for structure-function relations and synaptic transmission. JPhysiol. 1995;489:529–543. doi: 10.1113/jphysiol.1995.sp021070. [DOI] [PMC free article] [PubMed] [Google Scholar]
- Hutcheon B. Developmental change in GABAA receptor desensitization kinetics and its role in synapse function in rat cortical neurons. JPhysiol. 2000;522:3–17. doi: 10.1111/j.1469-7793.2000.t01-5-00003.xm. [DOI] [PMC free article] [PubMed] [Google Scholar]
- Jonas P. Fast application of agonists to isolated membrane patches. In: Sakmann B, editor. Single-Channel Recording. 2. New York: Plenum Press; 1995. pp. 231–243. [Google Scholar]
- Jones MV. Desensitized states prolong GABAA channel responses to brief agonist pulses. Neuron. 1995;15:181–191. doi: 10.1016/0896-6273(95)90075-6. [DOI] [PubMed] [Google Scholar]
- Jones MV. Defining affinity with the GABAA receptor. JNeurosci. 1998;18:8590–8604. doi: 10.1523/JNEUROSCI.18-21-08590.1998. [DOI] [PMC free article] [PubMed] [Google Scholar]
- Lavoie AM. Activation and deactivation rates of recombinant GABAA receptor channels are dependent on alpha-subunit isoform. BiophysJ. 1997;73:2518–2526. doi: 10.1016/S0006-3495(97)78280-8. [DOI] [PMC free article] [PubMed] [Google Scholar]
- Macdonald RL. Kinetic properties of the GABAA receptor main conductance state of mouse spinal cord neurones in culture. JPhysiol. 1989;410:479–499. doi: 10.1113/jphysiol.1989.sp017545. [DOI] [PMC free article] [PubMed] [Google Scholar]
- Maconochie DJ. How quickly can GABAA receptors open? Neuron. 1994;12:61–71. doi: 10.1016/0896-6273(94)90152-x. [DOI] [PubMed] [Google Scholar]
- McClellan AM. Receptor system response kinetics reveal functional subtypes of native murine and recombinant human GABAA receptors. JPhysiol. 1999;515:711–727. doi: 10.1111/j.1469-7793.1999.711ab.x. [DOI] [PMC free article] [PubMed] [Google Scholar]
- Mozrzymas JW. Dynamism of GABAA receptor activation shapes the ‘personality’ of inhibitory synapses. Neuropharmacology. 2004;47:945–960. doi: 10.1016/j.neuropharm.2004.07.003. [DOI] [PubMed] [Google Scholar]
- Mozrzymas JW. Changes in intracellular calcium concentration affect desensitization of GABAA receptors in acutely dissociated P2–P6 rat hippocampal neurons. JNeurophysiol. 1998;79:1321–1328. doi: 10.1152/jn.1998.79.3.1321. [DOI] [PubMed] [Google Scholar]
- Mozrzymas JW. Binding sites, singly bound states, and conformation coupling shape GABA-evoked currents. JNeurophysiol. 2003a;89:871–883. doi: 10.1152/jn.00951.2002. [DOI] [PubMed] [Google Scholar]
- Mozrzymas JW. Modulation of GABA(A) receptors by hydrogen ions reveals synaptic GABA transient and a crucial role of the desensitization process. JNeurosci. 2003b;23:7981–7992. doi: 10.1523/JNEUROSCI.23-22-07981.2003. [DOI] [PMC free article] [PubMed] [Google Scholar]
- Ortinski PI. Expression of distinct alpha subunits of GABAA receptor regulates inhibitory synaptic strength. JNeurophysiol. 2004;92:1718–1727. doi: 10.1152/jn.00243.2004. [DOI] [PubMed] [Google Scholar]
- Overstreet LS. Slow desensitization regulates the availability of synaptic GABAA receptors. JNeurosci. 2000;20:7914–7921. doi: 10.1523/JNEUROSCI.20-21-07914.2000. [DOI] [PMC free article] [PubMed] [Google Scholar]
- Pirker S. GABAA receptors: immunocytochemical distribution of 13 subunits in the adult rat brain. Neuroscience. 2000;101:815–850. doi: 10.1016/s0306-4522(00)00442-5. [DOI] [PubMed] [Google Scholar]
- Rudolph U. Analysis of GABAA receptor function and dissection of the pharmacology of benzodiazepines and general anesthetics through mouse genetics. AnnuRevPharmacolToxicol. 2004;44:475–498. doi: 10.1146/annurev.pharmtox.44.101802.121429. [DOI] [PubMed] [Google Scholar]
- Rusch D. Classic benzodiazepines modulate the open-close equilibrium in alpha1beta2gamma2L gamma-aminobutyric acid type A receptors. Anesthesiology. 2005;102:783–792. doi: 10.1097/00000542-200504000-00014. [DOI] [PubMed] [Google Scholar]
- Scheller M. Coupled and uncoupled gating and desensitization effects by pore domain mutations in GABAA receptors. JNeurosci. 2002;22:8411–8421. doi: 10.1523/JNEUROSCI.22-19-08411.2002. [DOI] [PMC free article] [PubMed] [Google Scholar]
- Twyman RE. Intraburst kinetic properties of the GABAA receptor main conductance state of mouse spinal cord neurones in culture. JPhysiol. 1990;423:193–220. doi: 10.1113/jphysiol.1990.sp018018. [DOI] [PMC free article] [PubMed] [Google Scholar]
- Verdoorn TA. Formation of heteromeric gamma-aminobutyric acid type A receptors containing two different alpha subunits. MolPharmacol. 1994;45:475–480. [PubMed] [Google Scholar]
- Vicini S. Genetic manipulations of GABAA receptor in mice make inhibition exciting. PharmacolTher. 2004;103:109–120. doi: 10.1016/j.pharmthera.2004.06.001. [DOI] [PubMed] [Google Scholar]
- Whiting PJ. GABAA receptor subtypes in the brain: a paradigm for CNS drug discovery? Drug DiscovToday. 2003;8:445–450. doi: 10.1016/s1359-6446(03)02703-x. [DOI] [PubMed] [Google Scholar]
- Yee BK. A schizophrenia-related sensorimotor deficit links a3-containing GABAA receptors to a dopamine hyperfunction. ProcNatl AcadSciUSA. 2005;102:17 154–17 159. doi: 10.1073/pnas.0508752102. [DOI] [PMC free article] [PubMed] [Google Scholar]