

Abstract
The basal ganglia comprise a crucial circuit involved in force production and force selection, but the specific role of each nucleus to the production of force pulses and the selection of pulses of different force amplitudes remains unknown. We conducted an fMRI study in which participants produced force using a precision grip while a) holding a steady-state force, b) performing a series of force pulses with similar amplitude, and c) selecting force pulses of different amplitude. Region of interest analyses were conducted in the basal ganglia and frontal cortex to compare percent signal change during force pulse versus steady-state force production, and compare force amplitude selection to force production when selection of force amplitude was not present. There were three novel findings in the basal ganglia. First, the caudate nucleus increased activation during the selection of different force amplitudes when compared to producing a series of similar force pulses. Second, GPi, STN, and posterior putamen increased activation during the production of similar force amplitudes when compared to holding a steady-state force, and maintained similar activation during the production of different force amplitudes in which force selection was required. Third, GPe and anterior putamen had increased activation during the production of similar force pulses and further increased activation during the selection of different force pulses. These findings suggest that anterior basal ganglia nuclei are involved in selecting the amplitude of force contractions and posterior basal ganglia nuclei regulate basic aspects of dynamic force pulse production.
Introduction
The basal ganglia are involved in selecting a specific motor program (Grillner et al., 2005; Jueptner and Weiller, 1998; Mink, 1996; Redgrave et al., 1999), and have also been shown to regulate aspects of grip force during grasping tasks (Ehrsson et al., 2003; Pope et al., 2005; Vaillancourt et al., 2004). In diseases that affect the basal ganglia, the ability to regulate force is impaired. For instance, patients with Parkinson’s disease (PD) have a more irregular force-time profile and increased time to peak force (Stelmach et al., 1989). Patients with PD also have an impaired ability to inhibit the production of muscle force (Corcos et al., 1996), and this is more impaired when the disease progresses (Robichaud et al., 2005). In Huntington’s disease (HD), patients have an impaired initiation of grip force, and produce excessive and more variable force output (Gordon et al., 2000). Thus, the examination of how nuclei of the basal ganglia select force amplitude levels and regulate force has important implications for diseases that affect the basal ganglia.
The functional consequences of examining selection and force regulation can be considered in the case of a worker who stocks a grocery store shelf with a product. In this example, the individual must grasp, lift, and maintain grip force on the object while placing it on the shelf. The central nervous system needs to specify the pulse of contact forces that initially grasps the object, code the timing of digits as they exert force against the object during the lift, code the steady-state force proportional to the weight of the object, and specify where on the shelf to place the object. This series of events may be repeated as the individual stocks the grocery store shelf. When the individual places a variety of different objects on the shelf, the central nervous system must select a new contact force, new lift force, and new maintenance force into a different series of movements. Since the basal ganglia are hypothesized to be involved in selecting specific motor parameters and in regulating aspects of grip force output, this raises the question of whether specific nuclei of the basal ganglia play a role in selecting and regulating the forces generated against an object.
The study of the control of movement in the basal ganglia of humans has used a wide variety of tasks that vary both in cognitive and motor complexity (Boecker et al., 1998; Jueptner and Weiller, 1998; Lehericy et al., 2006), frequently address the question of learning (Bapi et al., 2006; Grafton et al., 1998; Seidler et al., 2005), and these tasks often combine several factors such as force, timing, and other kinematic and spatial parameters. This makes it difficult to determine how a specific nucleus covaries with a specific motor parameter, such as force. In this study we focus on how the signal in each of the basal ganglia regions covaries with characteristics of force production, and we control other important parameters such as the timing of the force pulses and spatial configuration of the hand grip.
Our first goal was to investigate the basal ganglia nuclei that regulate the production of force pulses, and the second goal was to examine those nuclei that regulate the selection of different force amplitude pulses. In addition, our third goal examines the nuclei that regulate both the production and selection of force pulses. We define the selection of force as the active computational process required in choosing the level of force from a range of possible force levels, which is analogous to studies that have investigated the free selection of four possible movement directions (Playford et al., 1992). There is considerable evidence in humans that cortical areas such as the dorsolateral prefrontal cortex (DLPFC), pre-SMA, and anterior cingulate cortex (ACC) are involved in selection (Badre and Wagner, 2004; Playford et al., 1992; Rowe et al., 2000). In addition, anatomical studies in primates have shown that the anterior basal ganglia structures (caudate and anterior putamen) receive afferents from dorsal lateral prefrontal regions and pre-SMA (Inase et al., 1999; Yeterian and Pandya, 1991), whereas the posterior segments of the basal ganglia such as posterior putamen and STN receive cortical inputs from the SMA and motor cortex (Inase et al., 1999; Kunzle, 1975). In addition, previous cognitive-based paradigms (Monchi et al., 2006) and studies of early and late motor sequence learning (Lehericy et al., 2005) suggest an anterior to posterior organization in the basal ganglia. Thus, we test the hypothesis that posterior nuclei of the basal ganglia including GPi and STN will regulate the production of force pulses. We also test the hypothesis that anterior basal ganglia nuclei such as the anterior putamen and caudate will regulate the selection of different force amplitudes.
Methods and Materials
Subjects
Eleven right handed neurologically-normal subjects (range: 21–35 years) with corrected or normal vision took part in the experiment. One subject was excluded due to head motion that exceeded 1/3 of our voxel size, leaving six males and four females in the final data analysis. All subjects gave written informed consent to experimental procedures that were approved by the local Institutional Review Board, and consistent with the Declaration of Helsinki.
Force Data Acquisition
Subjects pinched the grip apparatus with their right index and middle finger opposing the right thumb to produce isometric force output (Vaillancourt et al., 2004). The custom pinch grip apparatus is made of non-metallic material (polycarbonate) allowing its use inside the fMRI environment (Liu et al., 2000). The grasping apparatus is connected to a long plastic tube (35-ft), which leads into a factory-calibrated Entran (EPX-N13-250P) pressure transducer (located outside the fMRI environment). When the pinch grip is performed, this increases hydraulic pressure, which is sensed by the pressure transducer. The pressure transducer output was amplified through a pressure gauge amplifier. A PCMCI National Instruments A/D converter sampled the pressure at 100 Hz.
fMRI Data Acquisition
MR imaging was performed with a GE 3T Signa whole body scanner (Excite) with a volume head coil (General Electric Healthcare, Milwaukee, WI). The head was stabilized using comfortable adjustable padding and a visor system (Thulborn and Shen, 1999). We collected 3 fMRI scans and each scan had a different task with 205 volumes (also called TRs) within each scan. We define a scan as the onset and offset of the fMRI pulse sequence. fMRI was obtained with a T2*-sensitive, single-shot, gradient-echo echo-planar pulse sequence (echotime 25 ms; repeat time 2000 ms; flip angle 90°; field of view 200 mm2; imaging matrix 64 × 64; 34 slices per volume (TR) at 3 mm thickness with a 0 mm gap between each 3 mm slice). Slices were acquired axially. The scanning session ended by acquiring a T1-weighted fSPGR pulse sequence (echotime 1.98 ms; repeat time 9 ms; flip angle 25°; field of view 220 mm2; imaging matrix 256 × 256; 120 contiguous slices with 1.5 mm slice thickness).
Experimental Design
The current study was designed to examine whether specific nuclei of the basal ganglia in humans are involved in: a) producing the same series of force pulses, b) internally selecting different levels of force, or c) producing force pulses and selecting different force pulses. Figure 1 shows three tasks performed by the subjects during three different fMRI blocked-design scans. Next, we describe each of the three tasks in more detail, how comparisons between the three tasks were used to address the three questions, and the confounding variables that were controlled between each task.
Figure 1.
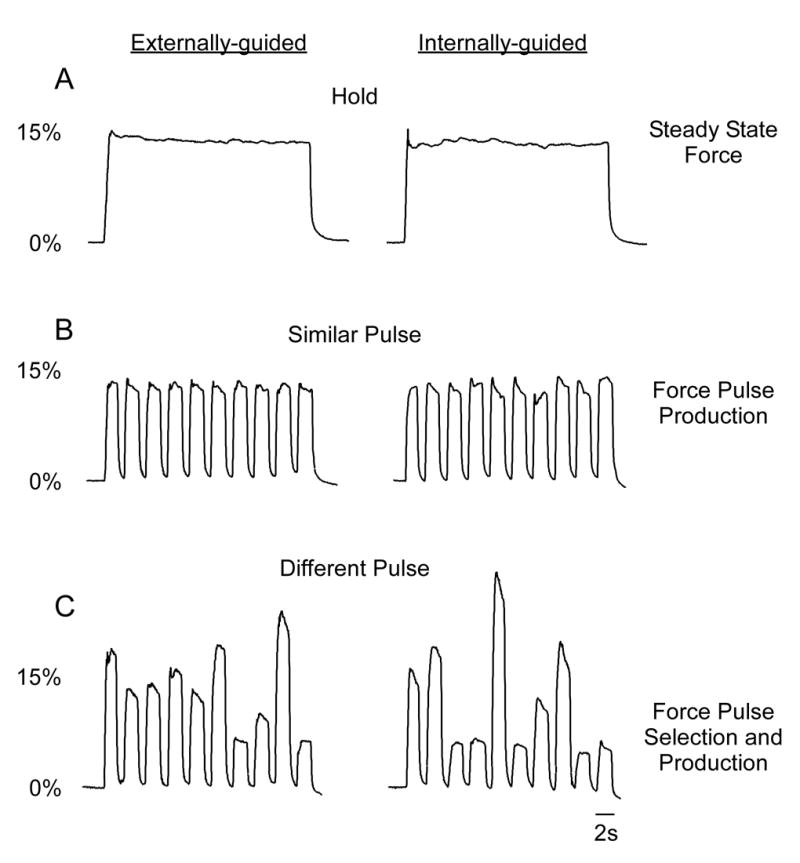
Force output time series for hold, similar pulse, and different pulse tasks. Data were obtained from one subject in both externally-guided and internally-guided conditions. During the hold task (upper panel) the subject maintained force output at the level of 15% MVC over the 30-s block. The hold task was used to control for the absolute level of force. During the similar pulse task (middle panel), the subject produced ten force pulses at a constant force level of 15% MVC. Since the force output was specified at 15% MVC, there was no selection of different force amplitudes required for this task. During the different pulse task (lower panel), the subjects produced a series of different force pulses. Therefore, in the internally-guided condition, the subject had to self-select different force amplitudes to accomplish the task.
First, the hold task required subjects to generate steady-state force at 15% of their MVC for the 30 s block (Figure 1A). Since subjects produced force to one known force level (15% MVC) they did not have to select amongst different force amplitude levels because there was only one choice (Figure 1A). This task was performed internally-guided and externally-guided, although the analysis focused only on the internally-guided condition. In subsequent tasks the externally-guided condition becomes important, so we included this condition in the hold task so that the scan length and potential for fatigue was similar for all three tasks.
Second, the similar pulse task required subjects to generate a force pulse to 15% of MVC for 2 s, rest for 1 s, and repeat 10 times in the 30 s block (Figure 1B). This similar pulse task was compared with the hold task to determine how the basal ganglia regions activate differently during the production of force pulses. Since the same force target was required on each force pulse (Figure 1B) subjects did not have to select which force level to produce on each force pulse.
Third, the different pulse task required subjects to generate a series of force pulses (10 per block) to force levels that varied in amplitude within the block (Figure 1C). This task was compared with the similar pulse to determine how the basal ganglia activate when subjects actively select which force level to produce. Each pulse lasted for 2 s, rest for 1 s, and repeated 10 times in the 30-s block. Target force levels were varied between 5% and 40% MVC with the average across the 10 targets per block equal to 15% MVC. Thus, the overall level of force was controlled as a potential confounding variable. During the externally-guided condition (Figure 1C) the subjects generated pulses of force that were specified by the target on the screen and as such did not have to internally select which force level to produce. After 10 s rest, subjects then produced a series of different force pulses that they internally selected between 5% and 40% MVC, which is analogous to tasks investigating free selection of movement direction (Deiber et al., 1991; Playford et al., 1992). The target bar was at zero force during the internally-guided condition and subjects had to produce force to levels that they freely selected. Thus, the internally-guided condition had both pulse and selection components whereas the externally-guided condition only had pulse components to the task.
Prior to scanning subjects participated in a 1.5 hour training session to learn how to vary their force output during the internally-guided conditions to maintain an overall mean force of 15% MVC in each of the three tasks. Each force task was run as a separate scan that included both the internally-guided and externally-guided condition. The following general setup was the same for each fMRI scan and included: 1) 30 s baseline rest condition, 2) 30 s externally-guided force, 3) 10 s rest, 4) 30 s internally-guided force. This sequence repeated four times during each scan for a 7 minute and 18 second scan. Condition 1 (baseline rest) was the baseline condition in the statistics and condition 3 was treated as a separate condition allowing the subject’s hand to rest to minimize fatigue. Subjects fixated on a white cursor and red target bar during conditions 1 and 3 but did not produce force. During condition 2, subjects were required to match their force output (white horizontal bar on screen) to the target force (green horizontal bar on screen). The white cursor moved vertically on the display according to the level of force produced. The white cursor was updated from the A/D board. During condition 4, the white cursor and target bar could still be seen but these bars did not change and were set to zero force. Also, during all 3 tasks, the target bar turned green to cue the initiation of force and the target bar turned red to cue the stop. Thus, we carefully-controlled the timing of the force contractions using external cues during all conditions in Figure 1, and subjects never had to internally choose when to press or stop pressing the force device. The order of the three tasks occurred in a random order within 3 separate fMRI scans. Anatomical scans were collected following fMRI scans.
Force Data Analysis
Mean force was calculated for each 2 s interval and averaged across all 2 s intervals within the scan separately for the internal and external conditions. We also calculated the average rate of change of force for each of the three tasks during the rise phase of force production, as well as the duration of each force pulse (Vaillancourt et al., 2004).
fMRI Data Analysis
fMRI data processing was performed using the public domain software AFNI (http://afni.nimh.nih.gov/afni/). Motion detection and correction procedures were performed on each functional time series using 3D volume registration. The head motion (average peak to peak displacement) was less than 1 mm in any direction for all subjects in the study. The one subject who was excluded did not meet this motion criterion. The head motion was not significantly different between the hold, similar pulse, and different pulse tasks (p = 0.69). In all analyses that follow, we did not apply a spatial filter to smooth our data.
ROI Analysis
The primary data analysis used for hypothesis testing was a region of interest (ROI) analysis in the left, contralateral basal ganglia. We also examined specific contralateral cortical areas because the literature provides prior data to support our hypotheses in the cortex, and confirming these findings will render more confidence to the results in the basal ganglia. The basal ganglia and cortical ROIs were drawn on a single Talairach transformed anatomical image to form a template mask, and this template was overlaid on each subject’s Talairach transformed functional image. The centroid coordinate in the ROI volume in Talairach space is listed for each region (3dclust in AFNI). The cortical regions included the motor cortex (M1) (x = −31, y = −20, z = 54), SMA (x = −7, y = −11, z = 58), pre-SMA (x = −7, y = 9, z = 56), DLPFC (x = −30, y = 39, z = 35), and ACC (x = −6, y = 28, z = 25). For M1, SMA, and pre-SMA we used the Human Motor Area Template (HMAT) created from a comprehensive meta-analysis of motor areas (Mayka et al., 2006). Full details of HMAT are presented in previous work, and the mask is publicly available. We drew DLPFC as middle frontal gyrus anterior to the precentral sulcus, including Brodmann areas 9 and 46 (Sun et al., 2006). We drew ACC superior and anterior to the corpus callosum, inferior and posterior to the cingulate sulcus with the medial ACC defined by the interhemispheric fissure, and the lateral boundary determined by the white matter on the coronal plane. The posterior boundary of the mask is 15 mm posterior to the anterior commissure.
In the basal ganglia, the regions included the caudate, anterior putamen, posterior putamen, external portion of the globus pallidus (GPe), internal portion of the globus pallidus (GPi), and subthalamic nucleus (STN). Anatomical guidelines from previously published literature were used to help identify each basal ganglia nucleus (Yelnik, 2002).
Caudate nucleus (x = −11, y = 9, z = 11): is a curved structure with the rostral head being more voluminous than the body rostrally (Yelnik, 2002). It can be identified up to the level of the top of the ventricles. The medial border of the caudate nucleus is defined by the frontal horn or body of the lateral ventricle and the lateral edge by the anterior limb of the internal capsule (Ifthikharuddin et al., 2000).
Putamen (x = −24, y = 2, z = 4): limited medially on inferior sections by the globus pallidus and on more superior levels by the internal capsule (Ifthikharuddin et al., 2000). Anteriorly, the anterior limb of the internal capsule separates the putamen from the caudate. Laterally, it is limited by the external capsule. The anterior and posterior parts of the putamen were differentiated on a slice by slice basis using the anterior border of the thalamus and the posterior border of the caudate as the dividing line.
Globus pallidus: limited medially by the posterior limb of the internal capsule and laterally by the putamen (Ifthikharuddin et al., 2000). It is divided into the globus pallidus internal portion (GPi) (x = −16, y = −4, z = 2) and the globus pallidus external portion (GPe) (x = −20, y = −4, z = 4). The GPe lies lateral to the GPi and is almost twice as large (Yelnik, 2002).
STN (x = −11, y = −14, z = −3): lies ventral to the thalamus, medial to the peduncular portion of the internal capsule, and lateral and caudal to the hypothalamus. It is lateral to the red nucleus and dorsolateral to the substantia nigra in the coronal plane (or anteromedial in the axial plane) (Dormont et al., 2004). The size of the STN may be smaller than reported in the Talairach and Tournoux atlas, particularly in the medial-lateral direction (Richter et al., 2004).
The primary dependent variable used in the study was the average percent signal change within each region. The percent signal change was obtained for each voxel by calculating the difference between the force condition and the baseline rest condition. The average of the percent signal of all voxels with a positive task-related regression coefficient within a region was then quantified (Vaillancourt et al., 2006). To estimate task-related regression coefficient, the time series for the force and rest blocks was first simulated as a box-car function. The box-car time series was then convolved with an ideal hemodynamic response function (Gamma variate waveform) in AFNI. A multiple regression analysis was performed to correlate the data time series with the hemodynamic response time series for each force task.
Voxel-wise Group Analysis
We also performed a voxel-wise group analysis within each task for visual presentation purposes. First, we used the estimated task-related regression coefficient as described above for each subject and each of the three force tasks. Individual functional data were then transformed into Talairach space using AFNI. Next, we performed three separate group analyses of the hold, similar pulse, and different pulse scans. For each scan, we used a mixed-effects ANOVA with the factor internally-guided versus externally-guided as a fixed factor, and subject was treated as a random factor. To control for the familywise error, we used the AlphaSim tool in AFNI. In our simulations, we chose an a priori t-value of 3.5, and the output from AlphaSim was 5 continuous voxels and the alpha level was p<.005 (p < .05 corrected). In our imaging figures, we present masked activation to focus on the individual basal ganglia regions that match up with the ROI analysis. However, it is important to note that the statistical analysis described above was conducted across all the voxels in the brain.
Statistical Analysis of Force and Percent Signal Chance Data
Statistical analysis of the mean force, rate of change of force, and duration of force was conducted using repeated measures analyses of variance (ANOVA). In the fMRI data, the average percent signal change within a region was used for the hold, similar pulse, and different pulse conditions and analyzed in separate one-way ANOVAs for each region. Post hoc t-tests were performed for each region. Post-hoc t-test T(HS) compared the hold scan with the similar pulse scan. Post-hoc t-test T(DS) compared the different pulse scan to the similar pulse scan.
To confirm that a specific region was associated with internal selection of force amplitude, we conducted two control analyses using the externally-guided and internally-guided conditions during the different pulse and similar pulse tasks. First, if the mean force values were more random during the externally-guided than the internally-guided conditions this may confound our ability to interpret the selection of force. Thus, for the different pulse condition, we conducted separate runs tests for randomness to examine if the pattern of the mean force values was random for externally-guided and internally-guided conditions (Bradley, 1968). Second, In each region where the post-hoc t-test T(DS) was significant, we calculated the difference in percent signal change of the different pulse (%) - similar pulse (%) in both the externally-guided and internally-guided conditions. We then compared the percent signal difference between external and internal conditions using t-tests. If the activation in a brain region is selection-related we expected a significantly larger increase in percent signal change during the internally-guided condition where selection (choice) occurred compared to the externally-guided condition where there was no selection. If the t-test was not significant, this would indicate that internal selection did not occur in the region. We interpreted each statistical test as significant when there was less than a 5% chance of making a Type I error (p < .05). We used this statistical threshold for the ROI analysis because we had specific hypotheses regarding the basal ganglia regions, and because using uncorrected p-values can be more informative when investigating small brain targets with weak BOLD signals, particularly in the basal ganglia regions (Turner et al., 2003; Vaillancourt et al., 2004; Wu and Hallett, 2005).
Results
Force Output Performance
Figure 2A depicts the mean force (+ se) averaged across subjects for the hold, similar pulse, and different pulse scans for the externally-guided and internally-guided conditions. The mean force was not different between the three task conditions (p = .31), and the vision and task by vision interactions were not significant (p’s > .2). Similarly, Figure 2B shows the rate of change of force during the rise phase for the three scans. The statistical analysis revealed that the task, vision, and task by vision effects were all non-significant (p’s > .2). Figure 2C depicts the duration of force during the internally-guided and externally-guided conditions. There was no effect of vision and no task by vision interaction (p’s > .2). However, as expected from the individual subject data in Figure 1, Figure 2C indicates that the duration of force was substantially longer during the hold condition. This resulted in a main effect of task (F(2, 18)=17,440, p < .01). Tukey’s post-hoc test confirmed that this effect was due to the hold condition having a longer duration of force than the other two contractions (p’s < .01). Importantly, there was no difference in the duration of force between the similar and different pulse conditions (p > 0.2). Thus, the mean force and mean rate of change of force were similar across task and vision conditions, the duration of the force contraction was longer for the hold condition, but duration was not different between the pulse conditions.
Figure 2.
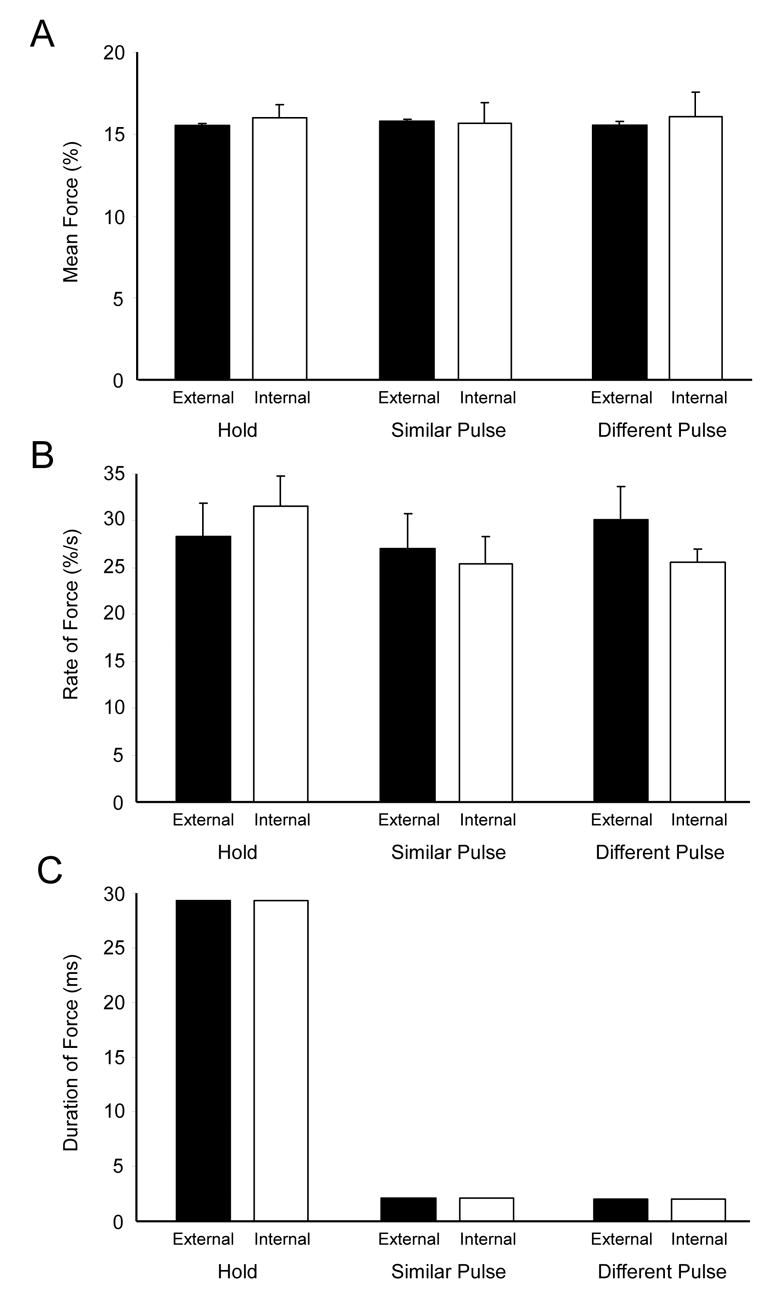
The group average of force production during the precision grip task is summarized. (A) Mean force is plotted for the externally- and internally-guided hold, similar pulse, and different pulse tasks. (B) Rate of force development is plotted for the externally- and internally-guided hold, similar pulse, and different pulse tasks. (C) Duration of force is plotted for the externally- and internally-guided hold, similar pulse, and different pulse tasks. The error bars represent plus one standard error from the mean. The error bars for the duration of force are present, but they do not appear in the graphs because they are very small.
Neuroimaging Analysis
We first performed one-way repeated measures analyses of variance (ANOVA) on each of the ROIs to confirm that there was a significant difference in % signal change across the three force tasks during the internally-guided condition. These statistical results are depicted in Table 1, where each ANOVA was highly significant.
Table 1.
Statistical Analysis of Regions of Interest
| Analysis of Variance | Post Hoc T-Tests | |||||
|---|---|---|---|---|---|---|
| F | p | HS | DS | |||
| t | p | t | p | |||
| Caudate | 9.1 | < 0.01 | 1.5 | > 0.19 | 3.1 | < 0.05 |
| DLPFC | 19.2 | < 0.001 | 1.1 | > 0.31 | 3.6 | < 0.01 |
| ACC | 13.7 | < 0.001 | 1.0 | > 0.33 | 3.8 | < 0.01 |
| Ant. Putamen | 18.6 | < 0.001 | 3.9 | < 0.01 | 2.5 | < 0.05 |
| GPe | 10.1 | < 0.01 | 2.5 | < 0.05 | 2.4 | < 0.05 |
| Pre-SMA | 26.5 | < 0.001 | 3.3 | < 0.01 | 3.6 | < 0.01 |
| Post. Putamen | 7.7 | < 0.05 | 2.4 | < 0.05 | 1.2 | > 0.23 |
| GPi | 4.0 | < 0.05 | 2.7 | < 0.05 | 0.3 | > 0.76 |
| STN | 5.3 | < 0.05 | 2.6 | < 0.05 | 0.3 | > 0.77 |
| SMA | 48.6 | < 0.001 | 8.1 | < 0.001 | 1.1 | > 0.31 |
| M1 | 13.3 | < 0.001 | 4.8 | < 0.001 | 1.2 | > 0.25 |
HS – hold compared to simple pulse; DS – difference pulse compared to similar pulse
We then performed post-hoc t-tests to determine if a region was involved in force pulse production, selection of force amplitude, or both selection and force pulse production. Post-hoc t-tests were conducted for the hold task compared with the similar pulse task (t-test HS), and the different pulse task compared with the similar pulse task (t-test DS) (Table 1). If T(HS) was only significant this indicates force pulse production only. If T(DS) was only significant this indicates force amplitude selection only. If t-tests T(HS) and T(DS) were both significant this indicates both selection and force pulse production.
Figure 3A depicts activation within each task for three regions: caudate, DLPFC, and ACC. The % signal change increased in caudate for the different pulse task compared with the similar pulse task, but there was no difference between the hold and similar pulse tasks (Figure 3B, Table 1). The same was true for DLPFC and ACC (Figure 3B, Table 1). The data in Figure 3B suggest that these regions regulated the selection of force amplitude.
Figure 3.
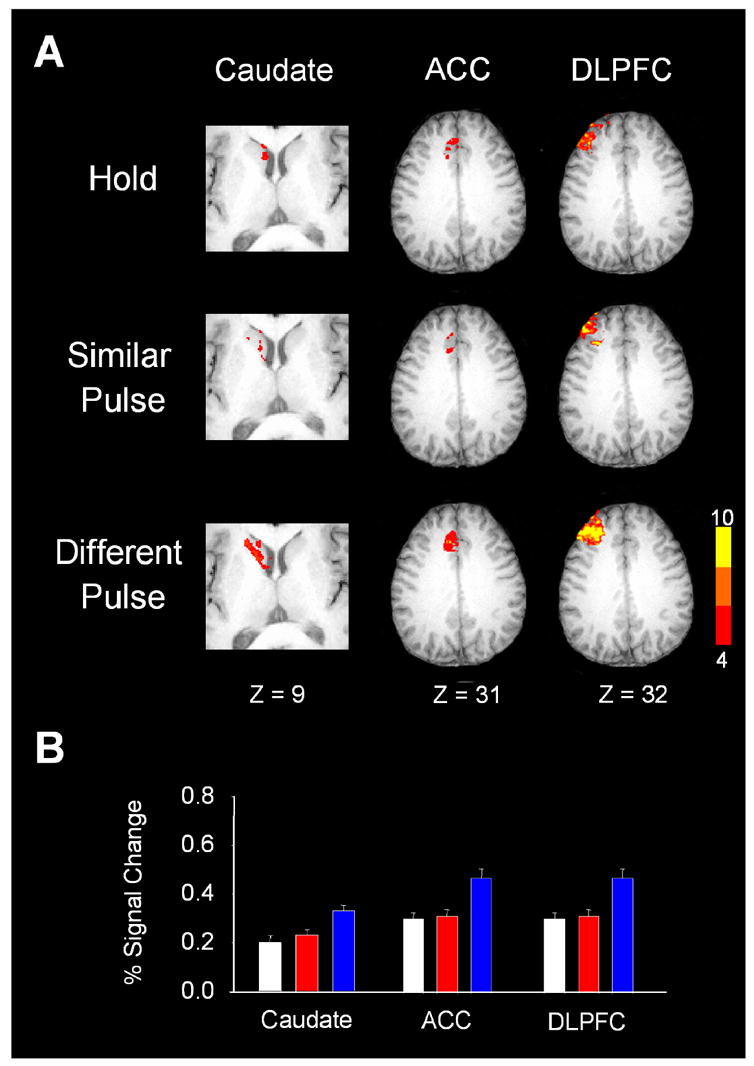
Results from the group analysis and the regions of interest analysis for the caudate, left anterior cingulate cortex, and the dorsal lateral prefrontal cortex. (A) Depicts axial slices for the hold, similar pulse, and different pulse tasks. Each slice has been masked to focus on the specific region. The activation in each slice is overlaid on the same anatomical brain in Talairach space. The group activation threshold is at p < 0.05 (corrected). (B) Depicts the regions of interest analysis used in our hypothesis testing. Each colored bar represents the percent signal change averaged across subjects and the error bar is plus one standard error of the mean. White is for the hold task, red is the similar pulse task, and blue is the different pulse task. In each of these three brain regions, the percent signal change for the different pulse task which required force selection was significantly higher than that for the similar pulse and hold tasks.
Figure 4A depicts group activation within each task for GPi, posterior putamen, STN, SMA, and M1. In each of these five regions, the T(HS) post-hoc test was significant, but the T(DS) was not significant (Table 1). In each case where the t-test was non-significant, the p-values were not close to reaching significance. Figure 4B shows the percent signal change data, and it is clear the pattern of response for the GPi, posterior putamen, and STN (Figure 4B) were different compared with what we found for the caudate (Figure 3B). Figure 3B indicates that these five regions regulated the production of force pulses.
Figure 4.
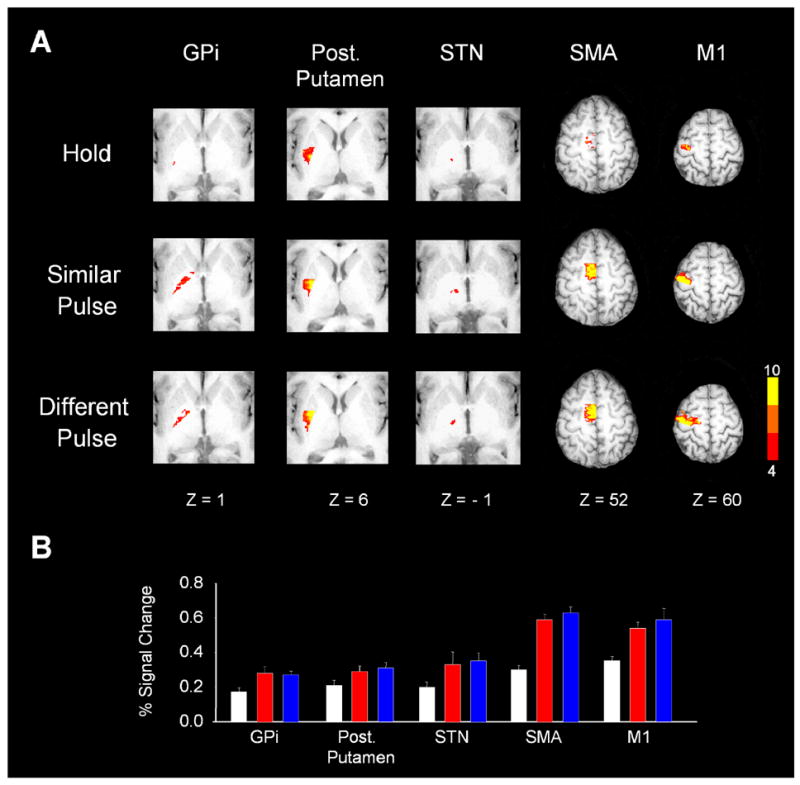
Results from the group analysis and the regions of interest analysis for the GPi, posterior putamen, STN, SMA, and left primary motor cortex. (A) Depicts axial slices for the hold, similar pulse, and different pulse tasks. Each slice has been masked to focus on a specific region. The activation in each slice is overlaid on the same anatomical brain in Talairach space. The group activation threshold is at p < 0.05 (corrected). (B) Depicts the regions of interest analysis used in our hypothesis testing. Each colored bar represents the percent signal change averaged across subjects and the error bar is plus one standard error of the mean. White is for the hold task, red is the similar pulse task, and blue is the different pulse task. In each of these three brain regions, the percent signal change for the similar pulse and different pulse tasks was significantly higher than that for the hold task. However, the percent signal change was not significantly different between the similar pulse and different pulse tasks.
Figures 5A shows the within task activation for GPe, anterior putamen, and pre-SMA. Figure 5B shows that these 3 regions had increased percent signal change for the similar pulse task and a greater increase in percent signal change for the different pulse task. This observation was confirmed in the statistical analysis for these three regions as both T(HS) and T(DS) post-hoc tests were significant (Table 1). This suggests that GPe, anterior putamen, and pre-SMA regulate both force pulse selection and production.
Figure 5.
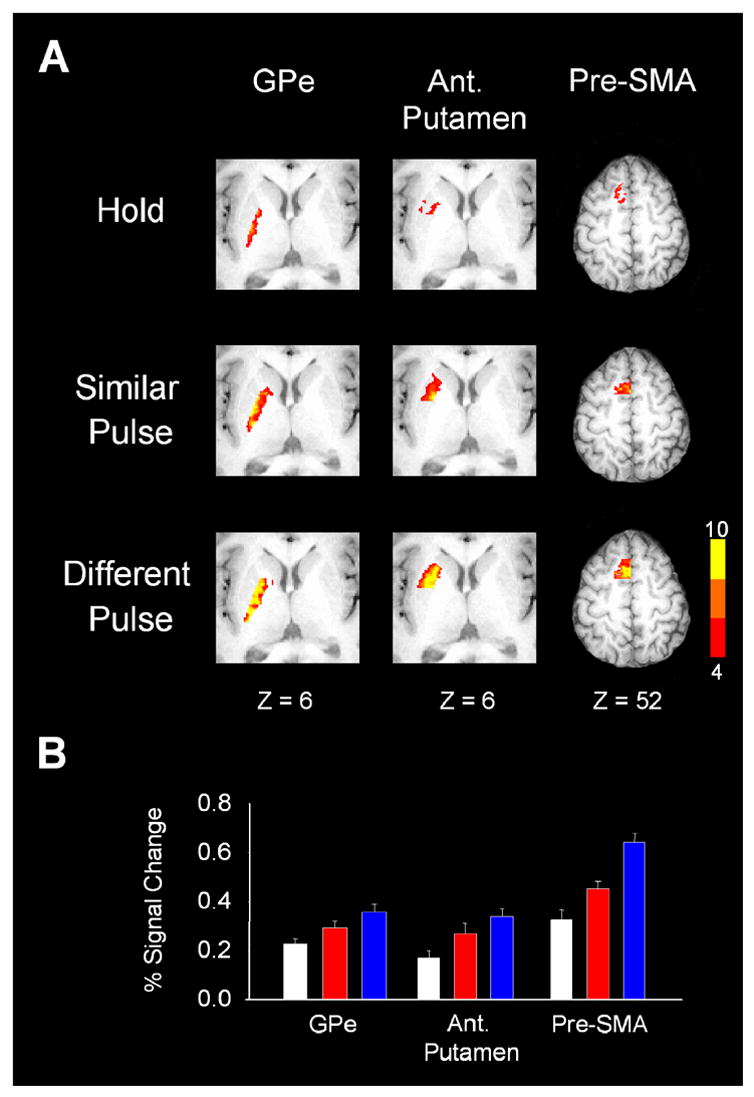
Results from the group analysis and the regions of interest analysis for the external segment of the globus pallidus the anterior putamen, and the left pre-SMA. (A) Depicts axial slices for the hold, similar pulse, and different pulse tasks. Each slice has been masked to focus on a specific region. The activation in each slice is overlaid on the same anatomical brain in Talairach space. The group activation threshold is at p < 0.05 (corrected). (B) Depicts the regions of interest analysis used in our hypothesis testing. Each colored bar represents the percent signal change averaged across subjects and the error bar is plus one standard error of the mean. White is for the hold task, red is the simple pulse task, and blue is the different pulse task. In each of these three brain regions, the percent signal change for the similar pulse task was significantly higher than that for the hold task. Also, the percent signal change for the different pulse task was significantly higher than that in the similar pulse task. The results support progressively greater involvement for both force pulse production and force selection mechanisms in these brain regions.
The different pulse condition involved a different pattern of force amplitude pulses as well as the process of selecting which force amplitude level to produce (Figure 1B and C), indicating that the selection of force could potentially be confounded by the pattern of the force series (Boecker et al., 1998). This is the reason we included the externally-guided condition in each scanning session, so that this confound could be examined. We conducted a control analysis in the similar pulse and different pulse tasks. During the externally-guided condition, the force target was externally provided and therefore during the different pulse task there was no internal selection of the force level because the participants responded to the changing force target. Figure 6 shows that the % signal change in the different pulse minus the similar pulse tasks. The difference between the externally-guided and internally-guided conditions was significant for all cortical and basal ganglia regions in Figure 6 (p’s < .05). We also performed a runs test for randomness on the force data to determine if the pattern during the internally-guided and externally-guided conditions was consistent with a random set of data. The runs test for randonmness did not reach significance (all p’s > .05) for each subject during both the externally-guided and internally-guided conditions. This finding indicates that there was no evidence to reject the null hypothesis that the pattern of mean force values was random. Thus, the activation in caudate, anterior putamen, GPe, DLPFC, ACC, and pre-SMA was related to the internal selection of force amplitude and the pattern of the force pulse amplitudes was not a confounding variable.
Figure 6.
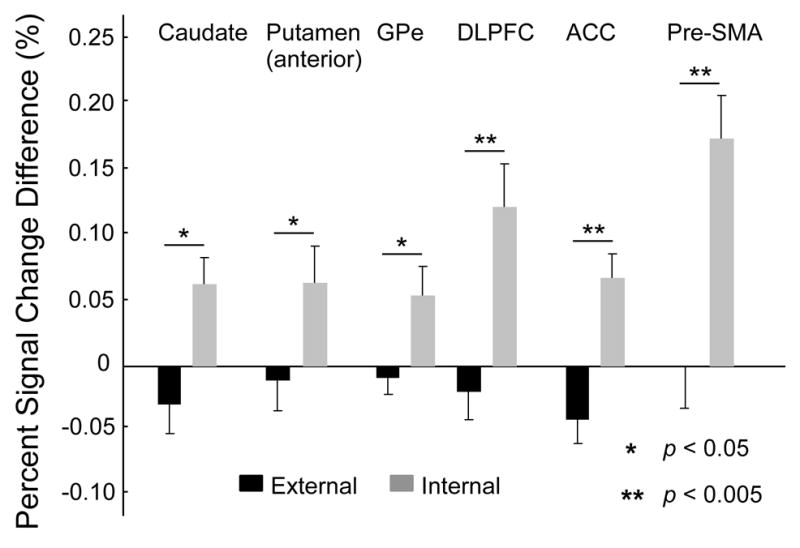
Percent signal change difference was calculated for different pulse - similar pulse in the externally-guided condition compared to that in the internally-guided condition using t-tests. If the activation were due to the pattern of the force pulse series, we expect an equal increment in the percent signal change in the externally-guided and internally-guided conditions. Alternatively, if the activation in a brain region is selection-related we expected a significantly larger increase in percent signal change during the internally-guided condition where selection (choice) occurred compared to the externally-guided condition where there selection is specified by the external visual stimulus. Caudate, anterior putamen, GPe, DLPFC, ACC, and pre-SMA all had a significant increase in percent signal change in the internal condition in comparison to the external condition. Each bar is the average across ten subjects and the error bar is plus one standard error of the mean.
Discussion
This study examined the role of the human basal ganglia and frontal cortex in producing force pulses, and selecting forces of different amplitude. Three main findings in the basal ganglia were identified. First, the caudate had increased activation during the selection of force amplitude. The caudate was the only basal ganglia region that displayed this specific pattern of activation. Second, GPi had increased activation during the production of similar force pulses, but GPi did not increase activation during the selection of different force amplitude pulses. We also identified that the STN and posterior putamen increased activation during force pulse production and not force amplitude selection. Third, GPe had increased activation during force pulse production and further increased activation during force amplitude selection. As discussed below, these findings provide novel insight into the functional circuits in the basal ganglia and frontal cortex that regulate the selection and production of force amplitude pulses.
Selection of Force Amplitude
The first main result in this study was that the caudate nucleus was the only basal ganglia nucleus with increased activation when the subjects were required to select a series of different force amplitude pulses, but not when pulse production occurred without selection. During a task in which humans were asked to press a button with their right or left thumb, the caudate nucleus increased activation when asked to freely select which thumb pressed the button (Gerardin et al., 2004). Similarly, a study in monkeys choosing which handle to turn found that striatal neurons were associated with selection of the action based on reward mechanisms (Samejima et al., 2005), and in humans reward-based mechanisms in the caudate nucleus have been linked with dopamine transmission (Zald et al., 2004). In the current study, there was no explicit reward provided to our subjects that could explain the activation in the caudate, but this does not rule out the possibility that a reward-based paradigm could bias the selection of force amplitude. Thus, our findings extend previous literature by showing that the caudate is not only involved in selecting a direction or a digit to use (Gerardin et al., 2004), but the activation also covaries with the selection of which force amplitude level should be produced within a particular direction. Taken together, these findings suggest that the caudate may be involved in selecting multiple parameters related to motor control and it remains to be determined if the selection of each parameter (direction, force amplitude) is coded by the same or different microcircuits of the caudate nucleus.
In the frontal cortex, we also found that the activation in DLPFC and ACC increased with the selection of force amplitude and not pulse production. Previously, an fMRI study showed that DLPFC increased when a delayed memory task required the subjects to produce a motor sequence from short-term memory (Pochon et al., 2001). Rowe and colleagues (2000) conducted an event-related fMRI paradigm designed to tease apart the role of DLPFC in response selection versus working memory and concluded that the DLPFC regulates selection of the target location from memory. These studies are consistent with the position that the DLPFC biases neural excitation in other areas and leads to the selection of neuronal representations (Miller, 1999, 2000). Previously, ACC has been hypothesized to monitor for and detect response conflict mechanisms (Botvinick et al., 2001). Badre and Wagner (2004) reported that the ACC and mid-DLPFC have a positively correlated percent signal change during response conflict processing. The authors concluded that their data were consistent with the hypothesis that ACC upregulates response selection by detecting response conflict. Therefore, our findings using a motor control paradigm are consistent with previous studies which hypothesize that DLPFC and ACC function similarly in processing functions such as selection.
Alexander and others (1986) proposed the existence of 5 segregated parallel loops related to specific cognitive and motor functions that link different cortical regions with the basal ganglia. According to this model, the DLPFC has projections to the dorsolateral portion of the caudate nucleus. Indeed, anatomical studies in monkeys indicate that the caudate nucleus does receive afferent projections from dorsal lateral prefrontal regions (Yeterian and Pandya, 1991). In a recent meta-analysis of the fMRI and PET literature, Postuma and Dagher (2005) have found that the patterns of functional connectivity in humans between the cortex and the different striatal nuclei are broadly consistent with the predictions of the parallel loop model. The current findings support this model because the more cognitive aspects of the force production task that included selecting the force level were associated with the anterior and dorsal basal ganglia, as well as anterior frontal circuits.
Force Pulse Production
The second main finding was that the activation in GPi, posterior putamen, and STN increased during force pulse production compared to when subjects produced a steady-state level of force, and the activation did not increase during force amplitude selection. These regions of the basal ganglia were posterior and ventral to the regions where activation increased in relation to selecting force amplitude such as the caudate nucleus. This finding shows that the core circuit that underlies the production of force pulses in humans does include distinct nuclei of the basal ganglia (Keele et al., 2003). This finding is important because it extends the findings from a recent meta-analysis in which the basal ganglia were considered as a whole structure instead of characterizing the function of each individual nucleus (Janata and Grafton, 2003). Our finding regarding the globus pallidus extends previous work in monkeys in which pallidal neurons displayed a change in activity during a memory-guided arm movement sequencing task (Mushiake and Strick, 1995). Our finding regarding the STN and caudate nucleus are different from the findings of Lehericy and colleagues (2006) in which both the STN and the caudate nucleus had a greater level of activation during a complex motor sequence task compared to a simple task. Their data suggest that STN and caudate perform similar functions in that both nuclei increase activation during a complex task compared to a simple task. The current study indicates that STN increases activation when the similar and different pulse tasks were compared with the hold task. This supports the idea that STN plays a significant role when a temporally ordered series of force pulses are generated. This finding that STN has a different pattern of activation to the caudate nucleus during a motor paradigm extends the study by Monchi and colleagues (2006) in which a cognitive based paradigm was used and STN and caudate had different functions.
The SMA and M1 were also identified in the control of force pulse production, without any involvement in the selection of force. This finding in the motor cortex is consistent with the viewpoint advanced by a study in non-human primates in which motor cortical cells were responsive during movement production associated with the serial order of recall tasks (Carpenter et al., 1999). In addition, a study using transcranial magnetic stimulation in humans suggests that M1 is not only an executive motor area, but also is involved in movement sequence organization (Gerloff et al., 1998). In addition, our findings are consistent with the hypothesis that cells in SMA regulate motor sequence production (Carpenter et al., 1999; Deiber et al., 1999). In humans, a PET study showed that regional cerebral blood flow (rCBF) in the SMA and M1 increased during multi-digit tapping, although the rCBF did not increase in these two regions with task complexity (Boecker et al., 1998). The work by Tanji and colleagues (Tanji, 2001; Tanji and Shima, 1994) demonstrated that different types of movement such as pulling, turning, or pushing on a handle involves activity from populations of cells in the monkey SMA. The numerical order of the sequence of joystick movements was associated with both SMA and pre-SMA neurons (Clower and Alexander, 1998). Neuronal activity in the SMA was also related to movement sequencing during a task that required monkeys to touch three pads in a predetermined order without visual guidance (Mushiake et al., 1990). Our current findings extend this viewpoint by showing the both SMA and pre-SMA are involved in generating a series of dynamic force amplitude pulses, but only pre-SMA increases activity during the selection of different force amplitude pulses.
Similar to DLPFC, the SMA and M1 are intricately linked anatomically with basal ganglia circuitry. The model by Alexander and colleagues (1986) outlines the motor circuit with projections from GPi via the ventrolateral and ventroanterior thalamus to the SMA. As part of this feedback loop, the putamen receives input from the SMA and from M1. In primates, it has been shown that the posterior segments of the basal ganglia such as posterior putamen and STN receive cortical inputs from the SMA and motor cortex (Inase et al., 1999; Kunzle, 1975). Thus, the current findings are consistent with the position that aspects of the motor circuit including M1, SMA, posterior putamen, GPi, and STN are intricately involved in force pulse production.
Integration of Force Pulse Production and Force Selection
The third main finding in this study was that three areas of the basal ganglia and frontal cortex increased activation during both force pulse production and force amplitude selection. These areas included the GPe, anterior putamen, and pre-SMA. For GPe, our study is the first to show that GPe is involved in selecting the amplitude of force. Our data extend previous studies in non-human primates which have shown that GPe is involved in movement sequence production (Brotchie et al., 1991), and provide support in humans for the concept that GPe is well suited for processing a multitude of movement parameters (Arkadir et al., 2004). Our findings for pre-SMA and anterior putamen are also consistent with previous studies of sequence generation in both non-human primates (Tanji, 2001) and in humans using PET (Boecker et al., 1998; Jueptner and Weiller, 1998).
Our findings for pre-SMA are consistent with the study of Deiber and colleagues (1991) which showed that rCBF increased in the anterior portion of the SMA when individuals selected at random one of four possible movement directions. The authors interpreted the task as a free selection task because the subjects chose freely which direction to move. In a study of Parkinson’s disease (PD) examining the free selection of different movement directions, it was shown that PD patients had impaired activation in the anterior SMA, DLPFC, ACC, and anterior cingulate (Playford et al., 1992). We found that these same regions had increased percent signal change when the selection of force amplitude levels was required. In addition, removing the SMA in monkeys impairs the ability to perform movements at the monkey’s own pace consistent with the interpretation that anterior SMA is involved in regulating free selection (Passingham et al., 1989). Thus, we interpret the data on the selection of force as consistent with the previous findings during the free selection of different movement directions.
Anatomically, the pre-SMA is located anterior to the SMA and M1 which were associated with force pulse production. In the basal ganglia the anterior putamen and GPe are situated anterior to the GPi, posterior putamen, and STN that were associated with force pulse production. The tight link between anatomical and functional organization suggests that the GPe, anterior putamen, and pre-SMA may play an important role in integrating the selection of force into a series of force pulses. Anatomically, studies in primates have shown that the anterior putamen receives afferents from the pre-SMA (Inase et al., 1999). In addition, GPe is a part of the globus pallidus that receives GABAergic input from the striatum, and provides GABAergic feedback to the striatum (Bevan et al., 2002). As such, the GPe is involved in a feedback loop with the STN providing GABAergic input and receiving glutaminergic feedback, and GPe output provides inhibitory GABAergic input to GPi. The current findings are important in the context of these circuit models because they suggest that GPe and anterior putamen may integrate the anterior and posterior basal ganglia-thalamo-cortical loops related to the selection and generation of force.
Conclusions
The findings demonstrate that anterior basal ganglia nuclei are involved in selecting the force amplitude and posterior basal ganglia nuclei regulate force pulse production. The findings in the basal ganglia were consistent with established anatomical connections with the frontal cortex. In addition, these findings suggest that GPi and GPe have a different pattern of activation during the selection of force pulses. Finally, our findings show that STN and caudate function differently during the selection of force pulses. Future work that builds on these findings may further our understanding for why certain patients with Parkinson’s disease have akinesia (i.e. difficulties with selection and initiation), and why almost all patients have bradykinesia.
Acknowledgments
This research was supported in part by grants from the National Institutes of Health (R01-NS-52318, R01-NS-28127, R01-NS-40902). We thank the staff at the Center for MR Research at UIC for their contribution in data collection.
Footnotes
Publisher's Disclaimer: This is a PDF file of an unedited manuscript that has been accepted for publication. As a service to our customers we are providing this early version of the manuscript. The manuscript will undergo copyediting, typesetting, and review of the resulting proof before it is published in its final citable form. Please note that during the production process errors may be discovered which could affect the content, and all legal disclaimers that apply to the journal pertain.
References
- Alexander GE, Delong MR, Strick PL. Parallel organization of functionally segregated circuits linking basal ganglia and cortex. Annual Review of Neuroscience. 1986;9:357–381. doi: 10.1146/annurev.ne.09.030186.002041. [DOI] [PubMed] [Google Scholar]
- Arkadir D, Morris G, Vaadia E, Bergman H. Independent coding of movement direction and reward prediction by single pallidal neurons. J Neurosci. 2004;24:10047–10056. doi: 10.1523/JNEUROSCI.2583-04.2004. [DOI] [PMC free article] [PubMed] [Google Scholar]
- Badre D, Wagner AD. Selection, integration, and conflict monitoring; assessing the nature and generality of prefrontal cognitive control mechanisms. Neuron. 2004;41:473–487. doi: 10.1016/s0896-6273(03)00851-1. [DOI] [PubMed] [Google Scholar]
- Bapi RS, Miyapuram KP, Graydon FX, Doya K. fMRI investigation of cortical and subcortical networks in the learning of abstract and effector-specific representations of motor sequences. Neuroimage. 2006 doi: 10.1016/j.neuroimage.2006.04.205. [DOI] [PubMed] [Google Scholar]
- Bevan MD, Magill PJ, Terman D, Bolam JP, Wilson CJ. Move to the rhythm: oscillations in the subthalamic nucleus-external globus pallidus network. Trends Neurosci. 2002;25:525–531. doi: 10.1016/s0166-2236(02)02235-x. [DOI] [PubMed] [Google Scholar]
- Boecker H, Dagher A, Ceballos-Baumann AO, Passingham RE, Samuel M, Friston KJ, Poline J, Dettmers C, Conrad B, Brooks DJ. Role of the human rostral supplementary motor area and the basal ganglia in motor sequence control: investigations with H2 15O PET. J Neurophysiol. 1998;79:1070–1080. doi: 10.1152/jn.1998.79.2.1070. [DOI] [PubMed] [Google Scholar]
- Botvinick MM, Braver TS, Barch DM, Carter CS, Cohen JD. Conflict monitoring and cognitive control. Psychol Rev. 2001;108:624–652. doi: 10.1037/0033-295x.108.3.624. [DOI] [PubMed] [Google Scholar]
- Bradley J. Distribution-Free Statistical Tests. Prentice-Hall; Englewood Cliffs, NJ: 1968. [Google Scholar]
- Brotchie P, Iansek R, Horne MK. Motor function of the monkey globus pallidus 2. Cognitive aspects of movement and phasic nueronal activity. Brain. 1991;114:1685–1702. doi: 10.1093/brain/114.4.1685. [DOI] [PubMed] [Google Scholar]
- Carpenter AF, Georgopoulos AP, Pellizzer G. Motor cortical encoding of serial order in a context-recall task. Science. 1999;283:1752–1757. doi: 10.1126/science.283.5408.1752. [DOI] [PubMed] [Google Scholar]
- Clower WT, Alexander GE. Movement sequence-related activity reflecting numerical order of components in supplementary and presupplementary motor areas. J Neurophysiol. 1998;80:1562–1566. doi: 10.1152/jn.1998.80.3.1562. [DOI] [PubMed] [Google Scholar]
- Corcos DM, Chen CM, Quinn NP, McAuley J, Rothwell JC. Strength in Parkinson’s disease: relationship to rate of force generation and clinical status. Ann Neurol. 1996;39:79–88. doi: 10.1002/ana.410390112. [DOI] [PubMed] [Google Scholar]
- Deiber MP, Honda M, Ibanez V, Sadato N, Hallett M. Mesial motor areas in self-initiated versus externally triggered movements examined with fMRI: effect of movement type and rate. Journal of Neurophysiology. 1999;81:3065–3077. doi: 10.1152/jn.1999.81.6.3065. [DOI] [PubMed] [Google Scholar]
- Deiber MP, Passingham RE, Colebatch JG, Friston KJ, Nixon PD, Frackowiak RS. Cortical areas and the selection of movement: a study with positron emission tomography. Experimental Brain Research. 1991;84:393–402. doi: 10.1007/BF00231461. [DOI] [PubMed] [Google Scholar]
- Dormont D, Ricciardi KG, Tande D, Parain K, Menuel C, Galanaud D, Navarro S, Cornu P, Agid Y, Yelnik J. Is the subthalamic nucleus hypointense on T2-weighted images? A correlation study using MR imaging and stereotactic atlas data. AJNR Am J Neuroradiol. 2004;25:1516–1523. [PMC free article] [PubMed] [Google Scholar]
- Ehrsson HH, Fagergren A, Johansson RS, Forssberg H. Evidence for the involvement of the posterior parietal cortex in coordination of fingertip forces for grasp stability in manipulation. J Neurophysiol. 2003;90:2978–2986. doi: 10.1152/jn.00958.2002. [DOI] [PubMed] [Google Scholar]
- Gerardin E, Pochon JB, Poline JB, Tremblay L, Van de Moortele PF, Levy R, Dubois B, Le Bihan D, Lehericy S. Distinct striatal regions support movement selection, preparation and execution. Neuroreport. 2004;15:2327–2331. doi: 10.1097/00001756-200410250-00005. [DOI] [PubMed] [Google Scholar]
- Gerloff C, Corwell B, Chen R, Hallett M, Cohen LG. The role of the human motor cortex in the control of complex and simple finger movement sequences. Brain. 1998;121(Pt 9):1695–1709. doi: 10.1093/brain/121.9.1695. [DOI] [PubMed] [Google Scholar]
- Gordon AM, Quinn L, Reilmann R, Marder K. Coordination of prehensile forces during precision grip in Huntington’s disease. Exp Neurol. 2000;163:136–148. doi: 10.1006/exnr.2000.7348. [DOI] [PubMed] [Google Scholar]
- Grafton ST, Fagg AH, Arbib MA. Dorsal premotor cortex and conditional movement selection: A PET functional mapping study. J Neurophysiol. 1998;79:1092–1097. doi: 10.1152/jn.1998.79.2.1092. [DOI] [PubMed] [Google Scholar]
- Grillner S, Hellgren J, Menard A, Saitoh K, Wikstrom MA. Mechanisms for selection of basic motor programs--roles for the striatum and pallidum. Trends Neurosci. 2005;28:364–370. doi: 10.1016/j.tins.2005.05.004. [DOI] [PubMed] [Google Scholar]
- Ifthikharuddin SF, Shrier DA, Numaguchi Y, Tang X, Ning R, Shibata DK, Kurlan R. MR volumetric analysis of the human basal ganglia: normative data. Acad Radiol. 2000;7:627–634. doi: 10.1016/s1076-6332(00)80579-6. [DOI] [PubMed] [Google Scholar]
- Inase M, Tokuno H, Nambu A, Akazawa T, Takada M. Corticostriatal and corticosubthalamic input zones from the presupplementary motor area in the macaque monkey: comparison with the input zones from the supplementary motor area. Brain Res. 1999;833:191–201. doi: 10.1016/s0006-8993(99)01531-0. [DOI] [PubMed] [Google Scholar]
- Janata P, Grafton ST. Swinging in the brain: shared neural substrates for behaviors related to sequencing and music. Nat Neurosci. 2003;6:682–687. doi: 10.1038/nn1081. [DOI] [PubMed] [Google Scholar]
- Jueptner M, Weiller C. A review of differences between basal ganglia and cerebellar control of movements as revealed by functional imaging studies. Brain. 1998;121:1437–1449. doi: 10.1093/brain/121.8.1437. [DOI] [PubMed] [Google Scholar]
- Keele SW, Ivry R, Mayr U, Hazeltine E, Heuer H. The cognitive and neural architecture of sequence representation. Psychol Rev. 2003;110:316–339. doi: 10.1037/0033-295x.110.2.316. [DOI] [PubMed] [Google Scholar]
- Kunzle H. Bilateral projections from precentral motor cortex to the putamen and other parts of the basal ganglia. An autoradiographic study in Macaca fascicularis. Brain Res. 1975;88:195–209. doi: 10.1016/0006-8993(75)90384-4. [DOI] [PubMed] [Google Scholar]
- Lehericy S, Bardinet E, Tremblay L, Van de Moortele PF, Pochon JB, Dormont D, Kim DS, Yelnik J, Ugurbil K. Motor control in basal ganglia circuits using fMRI and brain atlas approaches. Cereb Cortex. 2006;16:149–161. doi: 10.1093/cercor/bhi089. [DOI] [PubMed] [Google Scholar]
- Lehericy S, Benali H, Van de Moortele PF, Pelegrini-Issac M, Waechter T, Ugurbil K, Doyon J. Distinct basal ganglia territories are engaged in early and advanced motor sequence learning. Proc Natl Acad Sci U S A. 2005;102:12566–12571. doi: 10.1073/pnas.0502762102. [DOI] [PMC free article] [PubMed] [Google Scholar]
- Liu JZ, Dai TH, Elster TH, Sahgal V, Brown RW, Yue GH. Simultaneous measurement of human joint forces, surface electromyograms, and functional MRI-measured brain acitvation. Journal of Neuroscience Methods. 2000;101:49–57. doi: 10.1016/s0165-0270(00)00252-1. [DOI] [PubMed] [Google Scholar]
- Mayka MA, Corcos DM, Leurgans SE, Vaillancourt DE. Three-dimensional locations and boundaries of motor and premotor cortices as defined by functional brain imaging: A meta-analysis. Neuroimage. 2006;31:1453–1474. doi: 10.1016/j.neuroimage.2006.02.004. [DOI] [PMC free article] [PubMed] [Google Scholar]
- Miller EK. The prefrontal cortex: complex neural properties for complex behavior. Neuron. 1999;22:15–17. doi: 10.1016/s0896-6273(00)80673-x. [DOI] [PubMed] [Google Scholar]
- Miller EK. The prefrontal cortex and cognitive control. Nat Rev Neurosci. 2000;1:59–65. doi: 10.1038/35036228. [DOI] [PubMed] [Google Scholar]
- Mink JW. The basal ganglia: focused selection and inhibition of competing motor programs. Prog Neurobiol. 1996;50:381–425. doi: 10.1016/s0301-0082(96)00042-1. [DOI] [PubMed] [Google Scholar]
- Monchi O, Petrides M, Strafella AP, Worsley KJ, Doyon J. Functional role of the basal ganglia in the planning and execution of actions. Ann Neurol. 2006;59:257–264. doi: 10.1002/ana.20742. [DOI] [PubMed] [Google Scholar]
- Mushiake H, Inase M, Tanji J. Selective coding of motor sequence in the supplementary motor area of the monkey cerebral cortex. Exp Brain Res. 1990;82:208–210. doi: 10.1007/BF00230853. [DOI] [PubMed] [Google Scholar]
- Mushiake H, Strick PL. Pallidal neuron activity during sequential arm movemetns. Journal of Neurophysiology. 1995;74:2754–2758. doi: 10.1152/jn.1995.74.6.2754. [DOI] [PubMed] [Google Scholar]
- Passingham RE, Thaler DE, Chen Y. Supplementary motor cortex and self-initiated movement. In: Ito M, editor. Neural Programming. Karger; Basel: 1989. pp. 13–24. [Google Scholar]
- Playford ED, Jenkins IH, Passingham RE, Nutt J, Frackowiak RS, Brooks DJ. Impaired mesial frontal and putamen activation in Parkinson’s disease: a positron emission tomography study. Ann Neurol. 1992;32:151–161. doi: 10.1002/ana.410320206. [DOI] [PubMed] [Google Scholar]
- Pochon JB, Levy R, Poline JB, Crozier S, Lehericy S, Pillon B, Deweer B, Le Bihan D, Dubois B. The role of dorsolateral prefrontal cortex in the preparation of forthcoming actions: an fMRI study. Cereb Cortex. 2001;11:260–266. doi: 10.1093/cercor/11.3.260. [DOI] [PubMed] [Google Scholar]
- Pope P, Wing AM, Praamstra P, Miall RC. Force related activations in rhythmic sequence production. Neuroimage. 2005;27:909–918. doi: 10.1016/j.neuroimage.2005.05.010. [DOI] [PubMed] [Google Scholar]
- Postuma RB, Dagher A. Basal Ganglia Functional Connectivity Based on a Meta-Analysis of 126 Positron Emission Tomography and Functional Magnetic Resonance Imaging Publications. Cereb Cortex. 2005 doi: 10.1093/cercor/bhj088. [DOI] [PubMed] [Google Scholar]
- Redgrave P, Prescott TJ, Gurney K. The basal ganglia: a vertebrate solution to the selection problem? Neuroscience. 1999;89:1009–1023. doi: 10.1016/s0306-4522(98)00319-4. [DOI] [PubMed] [Google Scholar]
- Richter EO, Hoque T, Halliday W, Lozano AM, Saint-Cyr JA. Determining the position and size of the subthalamic nucleus based on magnetic resonance imaging results in patients with advanced Parkinson disease. J Neurosurg. 2004;100:541–546. doi: 10.3171/jns.2004.100.3.0541. [DOI] [PubMed] [Google Scholar]
- Robichaud JA, Pfann KD, Vaillancourt DE, Comella CL, Corcos DM. Force control and disease severity in Parkinson’s disease. Mov Disord. 2005;20:441–450. doi: 10.1002/mds.20350. [DOI] [PubMed] [Google Scholar]
- Rowe JB, Toni I, Josephs O, Frackowiak RS, Passingham RE. The prefrontal cortex: response selection or maintenance within working memory? Science. 2000;288:1656–1660. doi: 10.1126/science.288.5471.1656. [DOI] [PubMed] [Google Scholar]
- Samejima K, Ueda Y, Doya K, Kimura M. Representation of action-specific reward values in the striatum. Science. 2005;310:1337–1340. doi: 10.1126/science.1115270. [DOI] [PubMed] [Google Scholar]
- Seidler RD, Purushotham A, Kim SG, Ugurbil K, Willingham D, Ashe J. Neural correlates of encoding and expression in implicit sequence learning. Exp Brain Res. 2005;165:114–124. doi: 10.1007/s00221-005-2284-z. [DOI] [PubMed] [Google Scholar]
- Stelmach GE, Teasdale N, Phillips J, Worringham CJ. Force production characteristics in Parkingson’s disease. Experimental Brain Research. 1989;76:165–172. doi: 10.1007/BF00253633. [DOI] [PubMed] [Google Scholar]
- Sun FT, Miller LM, Rao AA, D’Esposito M. Functional Connectivity of Cortical Networks Involved in Bimanual Motor Sequence Learning. Cereb Cortex. 2006 doi: 10.1093/cercor/bhl033. [DOI] [PubMed] [Google Scholar]
- Tanji J. Sequential organization of multiple movements: involvement of cortical motor areas. Annu Rev Neurosci. 2001;24:631–651. doi: 10.1146/annurev.neuro.24.1.631. [DOI] [PubMed] [Google Scholar]
- Tanji J, Shima K. Role for supplementary motor area cells in planning several movements ahead. Nature. 1994;371:413–416. doi: 10.1038/371413a0. [DOI] [PubMed] [Google Scholar]
- Thulborn KR, Shen GX. An integrated head immobilization system and high-performance RF coil for fMRI of visual paradigms at 1.5 T. J Magn Reson. 1999;139:26–34. doi: 10.1006/jmre.1999.1748. [DOI] [PubMed] [Google Scholar]
- Turner RS, Desmurget M, Grethe J, Crutcher MD, Grafton ST. Motor subcircuits mediating the control of movement extent and speed. J Neurophysiol. 2003;90:3958–3966. doi: 10.1152/jn.00323.2003. [DOI] [PubMed] [Google Scholar]
- Vaillancourt DE, Mayka MA, Corcos DM. Intermittent visuomotor processing in the human cerebellum, parietal cortex, and premotor cortex. J Neurophysiol. 2006;95:922–931. doi: 10.1152/jn.00718.2005. [DOI] [PMC free article] [PubMed] [Google Scholar]
- Vaillancourt DE, Mayka MA, Thulborn KR, Corcos DM. Subthalamic nucleus and internal globus pallidus scale with the rate of change of force production in humans. Neuroimage. 2004;23:175–186. doi: 10.1016/j.neuroimage.2004.04.040. [DOI] [PubMed] [Google Scholar]
- Wu T, Hallett M. A functional MRI study of automatic movements in patients with Parkinson’s disease. Brain. 2005;128:2250–2259. doi: 10.1093/brain/awh569. [DOI] [PubMed] [Google Scholar]
- Yelnik J. Functional anatomy of the basal ganglia. Mov Disord. 2002;17(Suppl 3):S15–21. doi: 10.1002/mds.10138. [DOI] [PubMed] [Google Scholar]
- Yeterian EH, Pandya DN. Prefrontostriatal connections in relation to cortical architectonic organization in rhesus monkeys. J Comp Neurol. 1991;312:43–67. doi: 10.1002/cne.903120105. [DOI] [PubMed] [Google Scholar]
- Zald DH, Boileau I, El-Dearedy W, Gunn R, McGlone F, Dichter GS, Dagher A. Dopamine transmission in the human striatum during monetary reward tasks. J Neurosci. 2004;24:4105–4112. doi: 10.1523/JNEUROSCI.4643-03.2004. [DOI] [PMC free article] [PubMed] [Google Scholar]