

Abstract
The Mdm2 oncoprotein forms a complex with the p53 tumor suppressor protein and inhibits p53-mediated regulation of heterologous gene expression. Recently, Mdm2 has been found to bind several other proteins that function to regulate cell cycle progression, including the E2F-1/DP1 transcription factor complex and the retinoblastoma tumor-suppressor protein. To determine whether Mdm2 plays a role in cell cycle control or tumorigenesis that is distinct from its ability to modulate p53 function, we have examined and compared both the in vitro growth characteristics of p53-deficient and Mdm2/p53-deficient fibroblasts, and the rate and spectrum of tumor formation in p53-deficient and Mdm2/p53-deficient mice. We find no difference between p53-deficient fibroblasts and Mdm2/p53-deficient fibroblasts either in their rate of proliferation in culture or in their survival frequency when treated with various genotoxic agents. Cell cycle studies indicate no difference in the ability of the two cell populations to enter S phase when treated with DNA-damaging agents or nucleotide antimetabolites, and p53-deficient fibroblasts and Mdm2/p53-deficient fibroblasts exhibit the same rate of spontaneous immortalization following long-term passage in culture. Finally, p53-deficient mice and Mdm2/p53-deficient mice display the same incidence and spectrum of spontaneous tumor formation in vivo. These results demonstrate that deletion of Mdm2 has no additional effect on cell proliferation, cell cycle control, or tumorigenesis when p53 is absent.
Keywords: cell cycle control, tumorigenesis
Mdm2 was originally isolated from a mouse double minute chromosome that was present in high copy number in a spontaneously transformed derivative of BALB/c 3T3 cells (1). Transfection and experimentally induced overexpression of Mdm2 can immortalize rodent primary fibroblasts as well as induce a fully transformed phenotype in cultured cells (2, 3). The oncogenic potential of Mdm2 has been further underscored by numerous reports suggesting that MDM2 is amplified in a significant percentage of human sarcomas (4, 5, 6) and is overexpressed in leukemic cells (7), breast carcinomic cells (8), lymphomas (9), and malignant gliomas (10).
A possible mechanism for the oncogenicity of Mdm2 has been provided by reports indicating that Mdm2 forms a complex with the p53 tumor suppressor protein and inhibits p53-mediated transactivation and transrepression of heterologous gene expression (11, 12). Since p53 is thought to act as a tumor suppressor, in part by regulating the expression of other cell cycle regulatory genes that function to slow or block progression of the cell cycle from G1 to S phase, these results suggest that Mdm2 promotes cell proliferation by relieving p53-mediated suppression of the cell cycle. Furthermore, p53 has been found to transactivate Mdm2 expression due to the presence of several p53-response elements within the first intron of Mdm2 (13, 14). Thus, complex formation between Mdm2 and p53 may serve to autoregulate Mdm2 expression as well as regulate p53 function.
Human MDM2 has been reported to form a complex with the retinoblastoma (Rb) tumor suppressor protein (15), and E2F and DP1 transcription factors (16). Transfection of MDM2 into a variety of cells was found to elevate expression of a reporter gene placed under transcriptional control of an E2F-responsive promoter in these studies, suggesting that MDM2–Rb complex formation and MDM2–E2F-1/DP1 complex formation stimulate the expression of E2F-responsive genes. Because complex formation was found to occur both in vitro and in vivo in cells deficient for p53, MDM2 was proposed to play a p53-independent role in promoting cell cycle progression from G1 to S phase.
We, and others, have recently employed gene targeting in embryonic stem cells to create mice deficient for Mdm2. These mice exhibit an early embryonic lethal phenotype but can be rescued by deletion of p53 (17, 18). Mice deficient for both Mdm2 and p53 undergo normal development, are viable, and are fertile, suggesting that any functions possessed by Mdm2 aside from its ability to regulate p53 are dispensable for normal embryonic development.
We have characterized previously the growth of p53-deficient embryo fibroblasts (19) and tumor formation in p53-deficient mice (20). To determine whether Mdm2 can modulate cell cycling or tumor formation in a p53-independent manner, we have examined and compared both the in vitro growth characteristics of p53-deficient and Mdm2/p53-deficient fibroblasts, and the rate and spectrum of tumor formation in p53-deficient and Mdm2/p53-deficient mice. The results demonstrate that the presence or absence of normal physiologic levels of Mdm2 has no effect on the growth or tumorigenic potential of p53-deficient cells, indicating absence of a p53-independent role for Mdm2 in control of cell growth.
MATERIALS AND METHODS
Tissue Culture Assays.
Mouse embryo fibroblasts were prepared from 12- to 14-day-old embryos harvested from Mdm2+/−, p53+/− compound heterozygous matings (17) according to standard methods (43); however, a small portion of each embryo was retained for Southern blot analysis to determine the genotype of the resulting fibroblast lines. Plating and passaging of the embryonic fibroblast cells were performed as described (19). All studies were performed by using embryo fibroblasts in the first three passages. To determine the rate of cell proliferation, four separate lines of wild-type, p53-deficient, or Mdm2/p53-deficient embryonic fibroblasts were plated in MEF medium (DMEM/15% fetal bovine serum/0.37% sodium bicarbonate, penicillin, and streptomycin) onto gelatinized (0.1%) 10-cm dishes at 5 × 10⁵ cells per dish. Triplicate plates of cells from each cell line were harvested, and cells were counted at various times following initial plating.
To examine the relative plating efficiencies of wild-type, p53-deficient, and Mdm2/p53-deficient embryonic fibroblasts, four plates of each of four lines of wild-type cells, three lines of p53−/− cells, and three lines of Mdm2−/−, p53−/− cells were plated at 104 cells per plate onto 10-cm plates in MEF medium supplemented with 30% conditioned medium harvested from plates of feeder fibroblasts. The cells were fixed with 70% ethanol and stained with methylene blue 12 days postplating, and colonies containing >50 cells were counted.
To characterize and compare the survival of the various genotypes of embryonic fibroblasts following treatment with DNA damaging agents, duplicate plates of three lines of wild-type, p53−/−, and Mdm2−/−, p53−/− embryo fibroblasts were plated onto 10-cm plates at low density (104 cells per plate) in MEF medium supplemented with 30% conditioned medium and exposed to increasing concentrations of either mitomycin C (Sigma) or UV radiation. Ten days after exposure, the cells were fixed with 70% ethanol and stained with methylene blue, and colonies containing >50 cells were counted.
A 3T9 assay was performed as described (19) to examine the rate of spontaneous immortalization of wild-type, p53-deficient, and Mdm2/p53-deficient cells. Briefly, 3 × 10⁶ embryonic fibroblasts were plated in MEF medium onto a 10-cm gelatinized dish every 3 days. A total of three plates (9 × 10⁶ cells) were maintained for three separate lines of embryo fibroblasts of each genotype. The triplicate plates for each line of fibroblasts was trypsinized and the cells mixed prior to counting and passaging.
Cell Cycle Studies.
Cells were seeded 24 h prior to treatment at densities to prevent contact inhibition. Cultures were left untreated or treated with 8 Gy γ radiation or 0.1 mM N-phosphonacetyl-l-aspartate (PALA) (Drug Biosynthesis and Chemistry Branch, Developmental Therapeutics Program, Division of Cancer Treatment, National Cancer Institute, Bethesda). Irradiations were carried out at room temperature with a Gammabeam 150-C 60Co γ-irradiator (Nordion International, Kanata, Ontario, Canada) at a distance of 40 cm at a rate of ≈3 Gy/min (1 Gy = 100 rads). After 48 h, the cultures were pulse-labeled with 10 μM BrdUrd (Sigma) for 30 min, harvested by trypsinization, and fixed in 70% ethanol overnight. Samples were treated with 0.1 M HCl containing 0.5% Triton X-100 to extract histones, followed by boiling and rapid cooling to denature the DNA. They were then incubated with anti-BrdUrd-fluorescein isothiocyanate (PharMingen) and counter-stained with propidium iodide containing RNase. Samples were run on a Becton Dickinson FACScan. Data analysis was done using sundisplay3 (J. Trotter, Salk Institute). Cellular debris and fixation artifacts were gated out, and the G0/G1, S, and G2/M fractions were quantified.
Tumorigenesis Studies.
During the spontaneous tumor study, mice were inspected every other day for morbidity and for obvious tumor formation. Necropsies were performed on moribund mice, and selected tissues were fixed in 10% buffered formalin phosphate and processed for paraffin embedding as described (21). Sections were prepared and stained with hematoxylin/eosin and examined under a microscope. All tumors were identified and classified in the absence of knowledge of their genotypes.
RESULTS
Proliferation of Early Passage Embryo Fibroblasts.
Mouse embryo fibroblasts deficient for p53 are distinguishable from wild-type fibroblasts in their growth rate and plating efficiency. To characterize and compare the growth rate of Mdm2/p53-deficient primary fibroblasts with wild-type and p53-deficient cells, four separate lines of cells for each genotype were harvested and counted at various times following initial plating. The results (Fig. 1A) indicate that p53−/− fibroblasts have a higher rate of proliferation than do p53+/− cells, which in turn proliferated faster than p53+/+ cells, which is consistent with our published results (19). There was no significant difference in the proliferative rates or saturation densities of p53−/− fibroblasts that were wild type (+/+), heterozygous (+/−), or nullizygous (−/−) for functional Mdm2.
Figure 1.
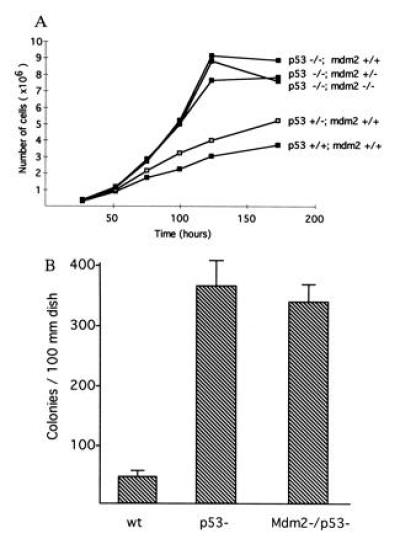
Proliferation of embryonic fibroblasts. (A) Cell growth rates for fibroblasts either wild type, heterozygous, or nullizygous for p53 and Mdm2. The genotype of each cell population is given. Cells nullizygous for p53 proliferated at a higher rate than p53-heterozygous cells, which in turn proliferated at a higher rate than wild-type cells. No difference was detected in the growth rates of p53-deficient fibroblasts that were either wild type, heterozygous, or nullizygous for Mdm2. Cell numbers at each point represent an average of four separate lines of cells, three plates of cells for each line. (B) Colony formation of wild-type (wt), p53-deficient (p53−), and Mdm2- and p53-deficient (Mdm2−/p53−) embryonic fibroblasts grown in conditions of low cell density. Wild-type value represents an average of three plates of four separate lines of cells. Values given for p53− cells and Mdm2−/p53− cells represent an average of three plates each of three lines of cells. Bars indicating standard deviation values are shown.
We have noted previously that primary fibroblasts deficient for p53 have an increased ability to survive and proliferate when plated at extremely low densities (19). To determine whether Mdm2 has a p53-independent effect on cell growth under these conditions, we plated wild-type, p53-deficient, and Mdm2/p53-deficient cells at clonal densities. The resulting colonies were fixed, stained, and counted 12 days postplating. Approximately nine times as many colonies were present on plates seeded with p53-deficient cells compared with wild-type cells (Fig. 1B). However, no significant difference was detected in the ability of p53-deficient cells and cells deficient for both Mdm2 and p53 to survive and grow under these conditions.
Response of Fibroblasts to DNA Damaging Agents.
A UV radiation survival assay was performed on three lines of wild-type, p53-deficient, and Mdm2/p53-deficient embryo fibroblasts to determine whether Mdm2 had a non-p53-mediated effect on the survival of cells to this DNA damaging agent. Cells were plated at low density and treated with UV light. Colonies were counted 12 days after exposure (Fig. 2A). Treatment with increasing dosages of UV radiation led to decreased survival of cells of all three genotypes. In contrast to a previous report which suggests that p53-deficient mouse fibroblasts do not have a decrease in sensitivity to radiation (22), we noted a significant difference in the survival of wild-type cells and p53-deficient cells at higher dose points. However, no difference was detected in the survival of p53-deficient cells and cells deficient for both Mdm2 and p53 at any dose.
Figure 2.
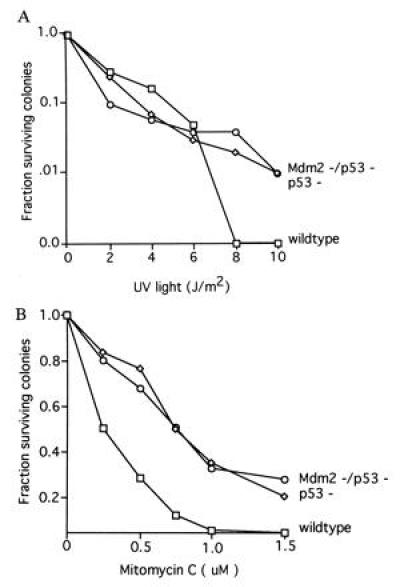
Colony formation of embryonic fibroblasts following DNA damage. (A) Wild-type cells, p53-deficient (p53−) cells, and Mdm2- and p53-deficient (Mdm2−/p53−) cells were plated at low density following treatment with UV radiation. No difference was found between the survival rates of p53− cells and Mdm2−/p53− cells following treatment with UV, whereas a significant difference was seen between the survival of these cells and wild-type cells at higher dosages. Values at each point represent data obtained from duplicate plates of three separate lines of cells for each genotype. (B) Wild-type cells, p53− cells, and Mdm2−/p53− cells were plated at low density following treatment with mitomycin C. No difference was found between the survival rates of p53− cells and Mdm2−/p53− cells following treatment with mitomycin C, whereas a significant difference was seen between the survival of these cells and wild-type cells. Values at each point represent data obtained from duplicate plates of three separate lines of wild-type cells and Mdm2−/p53− cells, or two separate lines of p53− cells.
We have documented previously a p53-dependent difference in the survival of mouse embryo fibroblasts to treatment with the interstrand crosslinking and bifunctional alkylating agent, mitomycin C (23). To determine whether Mdm2 can affect the survival of cells to this genotoxic agent, three lines of embryonic fibroblasts derived from wild-type embryos or from embryos that were either p53 deficient or deficient for both Mdm2 and p53 were plated at low density in enriched medium and exposed to increasing concentrations of mitomycin C. The plates were stained 10 days after exposure, and colonies were counted. The results of this experiment (Fig. 2B) reveal a significant increase in the ability of p53-deficient cells to survive mitomycin C treatment. Absence of functional Mdm2 does not alter the survival of mitomycin C-treated, p53-deficient cells. Therefore, Mdm2 does not additionally change the response of cells to this form of DNA damage beyond that imparted by p53 deficiency.
Cell Cycle Studies.
To investigate the contribution of Mdm2 in promoting cell cycle progression, we examined the numbers of wild-type, p53-deficient, and Mdm2/p53-deficient embryonic fibroblasts that were present in the G1 and S phase (G1/S ratio) of the cell cycle. Three separate lines of each genotype of passage 3 fibroblasts were labeled with BrdUrd for 30 min, and the percentage of cells in each phase of the cell cycle were determined using flow microfluorimetry as described (24). Cells deficient for p53 were found to have an approximate 2.5-fold decrease in the G1/S ratio relative to wild-type cells, consistent with the hypothesis that p53 serves to slow progression of cell cycling from G1 into S phase (19, 25, 26, 27). There was no difference in the G1/S ratio of p53-deficient cells that contained or lacked functional Mdm2 (Fig. 3A). In addition, no difference was detected in the numbers of cells present in the G2–M phases of the cell cycle relative to numbers of cells in S phase for the three genotypes of cells (G2–M/S ratio; data not shown).
Figure 3.
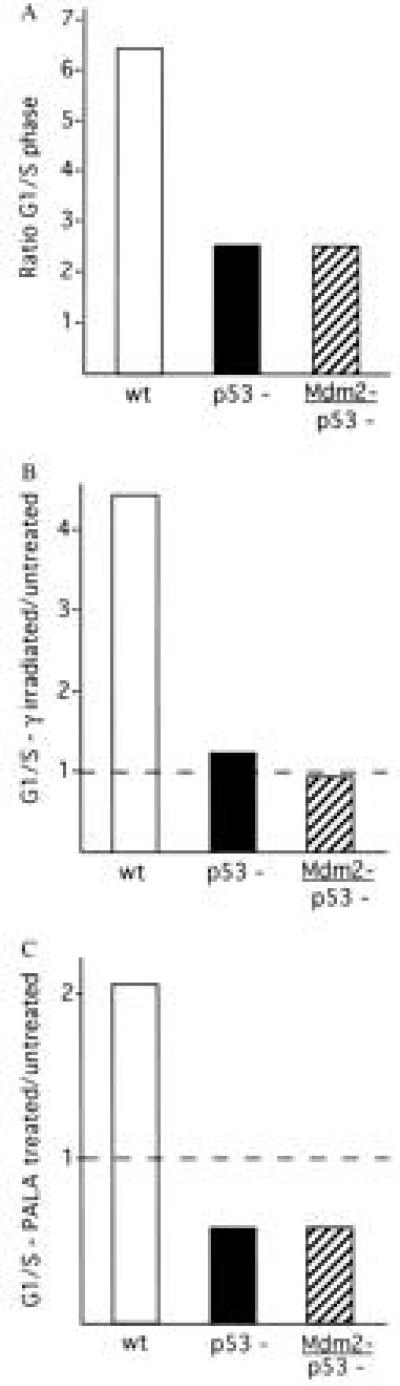
Cell cycle studies on embryonic fibroblasts. (A) Cycling of wild-type (wt), p53-deficient (p53−), and Mdm2- and p53-deficient (Mdm2−/p53−) fibroblasts. Values represent the ratio of the number of cells present in the G1 or S phase of the cell cycle. (B) Effects of γ-irradiation on the cell cycles of wild-type, p53−, and Mdm2−/p53− fibroblasts. The G1/S ratio of irradiated samples is given relative to untreated G1/S values for each genotype. (C) Effects of PALA on the cell cycles of wild-type, p53−, and Mdm2−/p53− fibroblasts. The G1/S ratio of PALA-treated samples is given relative to untreated G1/S values for each genotype.
Mammalian cells undergo p53-mediated arrest in the G1 phase of the cell cycle in response to DNA damage. Reentry of cells into the cell cycle following DNA damage may be mediated in part by Mdm2, as cells containing functional p53 exhibit an increase in the level of MDM2 mRNA following treatment with γ radiation (28). In addition, expression of exogenous MDM2 has been associated with a reduction in the ability of cells to arrest in G1 following γ irradiation (29). To determine whether Mdm2 plays a p53-independent role in the response of cells to DNA damage induced by γ irradiation, two separate lines of early passage fibroblasts that were either wild type, p53 deficient, or Mdm2/p53 deficient were γ irradiated (8 Grays), and the ratio of cells in the G1 and S phase of the cell cycle were compared with untreated G1/S ratio values (Fig. 3B). Setting the G1/S ratios of the untreated cells at 1, irradiation of wild-type cells resulted in a 4- to 5-fold increase in the relative number of cells present in the G1 phase. Treatment of p53-deficient cells with γ radiation had no effect on the G1/S ratio, consistent with the notion that p53 is required to block progression of cells into S phase following DNA damage. Irradiated Mdm2/p53-deficient cells exhibited the same G1/S ratio as p53-deficient cells, indicating that Mdm2 is unlikely to affect the cycling of cells following γ radiation-induced DNA damage through a non-p53-based pathway. An approximate 4-fold decrease was observed in the G2–M/S ratio in p53-deficient cells following γ irradiation compared with the G2–M/S ratio of irradiated wild-type cells. This supports previous reports that indicate a role for p53 in G2 arrest (30, 31). However, no difference was seen between the G2–M/S ratio of irradiated cells deficient for p53 and that of irradiated cells deficient for both p53 and Mdm2 (data not shown).
Mammalian cells exhibit a p53-dependent block to entry into S phase following metabolic perturbation of ribonucleotide pools (32). Treatment of cells with PALA, a specific inhibitor of de novo UMP biosynthesis (33), induces growth arrest in the G1 phase of the cell cycle. This block does not occur in p53-deficient mouse fibroblasts (34, 35). As Mdm2 may augment E2F-mediated gene activation, we determined whether Mdm2 modifies the response of cells to PALA in a p53-dependent manner. Two separate lines of early passage fibroblasts that were either wild type, p53 deficient, or Mdm2/p53 deficient were treated with 0.1 mM PALA, and the ratio of cells in the G1 and S phase of the cell cycle were compared with untreated cells (Fig. 3C). Setting the G1/S ratios of the untreated cells at 1, treatment of wild-type cells with PALA resulted in an approximate 2-fold increase in the relative number of cells present in the G1 phase. Treatment of p53-deficient cells did not increase the number of cells present in G1, but rather enriched the S-phase fraction. Presumably, this occurred as a result of slowed progression through S phase due to depleted deoxyribonucleotide pools (36). No difference was observed between the p53-deficient cells and the Mdm2/p53-deficient cells in their response to PALA. Thus, it is unlikely that Mdm2 plays a p53-independent role in promoting cell cycle progression in response to PALA treatment.
Cell Immortalization Studies.
Continuous culturing of p53-deficient embryo fibroblasts following standard 3T3 or 3T9 protocols has demonstrated that p53-deficient cells possess a high rate of growth, divide continuously, and fail to enter a senescent phase (19). To determine whether the absence of Mdm2 would affect the rate of spontaneous immortalization of p53-deficient cells, embryonic fibroblasts that were either wild type, p53 deficient, or deficient for both Mdm2 and p53 were passaged in culture following a 3T9 protocol. The results of this study (Fig. 4) indicate that p53-deficient cells have a much higher rate of growth than wild-type cells and fail to undergo senescence, which is consistent with our earlier finding (19). One line of wild-type cells entered a senescent phase almost immediately and was removed from the experiment at passage 5. The remaining two lines of wild-type cells continued to grow slowly until passage 26, at which time they exhibited more robust growth rates typical of immortalized cells. However, wild-type cells continued to divide more slowly than p53-deficient cells throughout the experiment. Cells that were deficient for both Mdm2 and p53 exhibited no significant difference in growth characteristics relative to p53-deficient cells. Thus, the absence of Mdm2 does not alter the induction of immortality in p53-deficient cells during long-term passage in culture.
Figure 4.
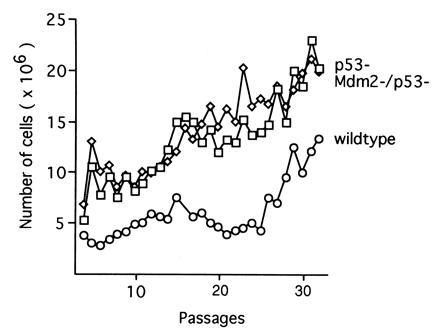
Growth of embryonic fibroblasts during long-term passage in culture. Passage 3 fibroblasts that were wild type (○), p53 deficient (□), or Mdm2 and p53 deficient (⋄) were grown following a 3T9 protocol. Each value represents an average of three separate lines of p53− or Mdm2−/p53− fibroblasts. Wild-type values represent the average of two separate lines of fibroblasts.
Tumorigenesis in Mice Deficient for Mdm2 and p53.
We have characterized previously the rate and spectrum of tumor formation in p53-deficient mice (20, 21, 37, 38). Mice deficient for p53 generally undergo normal development and are viable, although a small percentage of females exhibit exencephaly and die during embryogenesis (39). However, p53-deficient mice are susceptible to spontaneous tumor formation at an early age, with 75% of mice succumbing to cancer by 26 weeks. To examine loss of Mdm2 function on tumorigenesis in p53-deficient mice, 38 Mdm2+/−, p53−/− (Mdm2-het/p53-null) mice and 33 Mdm2−/−, p53−/− (Mdm2-null/p53-null) mice were monitored for spontaneous tumor formation, and the rate and spectrum of tumors in these mice were compared with the rate and spectrum of spontaneous tumors found in p53-deficient mice (Mdm2-wt/p53-null) and in wild-type mice (38). Moribund mice were sacrificed, and necropsies were performed to detect tumor formation and to permit histopathologic analysis of the tumors. The results indicate that p53-deficient mice that were deleted for one or both copies of functional Mdm2 were susceptible to spontaneous tumorigenesis at a rate which was indistinguishable from that observed in p53-deficient mice (Fig. 5). The spectrum of tumors found in Mdm2-het/p53-null mice and in Mdm2-null/p53-null mice was also similar to the spectrum of tumors seen in Mdm2-wt/p53-null mice (Table 1), with malignant lymphomas, chiefly thymic in origin, predominating in all three populations of mice. These results indicate that loss of Mdm2 function does not alter the incidence or spectrum of tumorigenesis in p53-deficient mice.
Figure 5.

Spontaneous tumor formation in mice. Tumor incidence curves of normal mice (□) and p53-deficient mice that are wild type (⋄), heterozygous (○, or nullizygous (▵) for functional Mdm2. Student’s t test indicated no significant difference in the rate of tumor incidence between the various p53-deficient mouse populations.
Table 1.
Spectrum of tumors occurring in p53-deficient mice
| Mdm2-wt/p53-null
|
Mdm2-het/p53-null
|
Mdm2-null/p53-null
|
||||||
|---|---|---|---|---|---|---|---|---|
| Tumor | % | n | Tumor | % | n | Tumor | % | n |
| Malignant lymphoma | 83 | 35 | Malignant lymphoma | 66 | 25 | Malignant lymphoma | 79 | 26 |
| Osteosarcoma | 5 | 2 | Angiosarcoma | 8 | 3 | Angiosarcoma | 6 | 2 |
| Undifferentiated sarcoma | 2 | 1 | Leiomyosarcoma | 8 | 3 | Leiomyosarcoma | 3 | 1 |
| Rhabdomyosarcoma | 2 | 1 | Rhabdomyosarcoma | 8 | 3 | Rhabdomyosarcoma | 3 | 1 |
| Adenocarcinoma | 2 | 1 | Squamous carcinoma | 5 | 2 | Squamous carcinoma | 3 | 1 |
| Teratocarcinoma | 2 | 1 | Choroid plexus carcinoma | 3 | 1 | Adenocarcinoma | 3 | 1 |
| Undifferentiated carcinoma | 2 | 1 | Undifferentiated carcinoma | 3 | 1 | Teratocarcinoma | 3 | 1 |
Tumors isolated from 42 Mdm2 +/+, p53 −/−; 38 Mdm2 +/−, p53 −/−; and 33 Mdm2 −/−, p53 −/− mice were classified by histopathology. The percentage columns represent the tumor-bearing mice of each genotype with a particular tumor type.
DISCUSSION
We have utilized genetically defined mouse embryonic fibroblasts and mice to examine the growth regulatory properties of Mdm2 in a minimally perturbed experimental system. No difference was observed in the rate of proliferation, immortalization frequency, survival after genotoxic or metabolic insult, or cycling of cells that were deficient for p53 or for both p53 and Mdm2. In addition, no difference was detected in the rate of spontaneous tumor formation or in the tumor spectrum in p53-deficient mice that contained or lacked functional Mdm2. These results are consistent with studies that have employed biochemical analysis or transfection and transient expression experiments in cultured cells to place Mdm2 and p53 within the same regulatory pathway (11, 13, 14, 40). Furthermore, the absence of p53 rescues the embryonic lethal phenotype of Mdm2-deficient mice, indicating that any non-p53-mediated functions possessed by Mdm2 are not critical to normal development (17, 18).
Several recent reports have documented the ability of Mdm2 to form a complex with other key cell cycle regulatory proteins. In vitro binding analysis and coimmunoprecipitation assays performed using extracts of p53-deficient cells indicate that human MDM2 can bind with the Rb protein (15) and with the cooperating transcription factors E2F-1 and DP1 (16) in the absence of p53. In these studies, transfection of an MDM2 expression plasmid was found to elevate expression levels of a reporter gene placed under transcriptional control of an E2F promoter. Furthermore, transfection of MDM2 was found to stimulate the activity of the E2F-responsive promoter in cells deleted for functional p53 (16). Since E2F-1-responsive genes encode products that are important for induction of S phase (41), stimulation of E2F-1–DP1 transcription factor complex activity by the binding of Mdm2 to either the E2F-1 and DP1 subunits or to Rb suggests a p53-independent role for Mdm2 in promoting cell growth.
We do not detect any difference in the growth characteristics of p53-deficient embryo fibroblasts or in the tumorigenic potential of p53-deficient mice in the presence or absence of Mdm2. In addition, methotrexate-binding assays performed using extracts of p53-deficient mouse embryonic fibroblasts that contained or lacked Mdm2 indicated no difference in the level of the E2F-1-responsive Dhfr gene product in these cells (data not shown). These results suggest that Mdm2 contributes to the regulation of cell cycling solely by modifying p53 activity. Alternatively, Mdm2 may complex with E2F-1/DP1 and with Rb in a p53-independent manner, but such binding may serve to promote cell growth only in the presence of functional p53. It is interesting to note that, in contrast to the findings of Martin et al. (16), Xiao et al. (15) did not detect stimulation of the E2F-responsive promoter when cotransfected with an MDM2 expression plasmid into Saos-2 cells. Although deficient for Rb and p53 (42), these cells do contain the E2F-1 and DP1 transcription factors and should show an increase in promoter activity if MDM2 can function independently of p53 to promote the expression of S phase-inducing genes.
A second explanation for the similarity in the growth of p53-deficient cells and Mdm2/p53-deficient cells seen in this study is that a p53-independent role for Mdm2 in stimulating cell proliferation may occur only in cells that overexpress Mdm2. This would account for the stimulation of E2F-responsive promoters observed in p53-deficient cells that were cotransfected with (and presumably overexpress) Mdm2 (16). MDM2 is frequently amplified and/or overexpressed in a number of different human tumors, many of which lack mutations in p53 (4, 5, 10). Although excess MDM2 is proposed to promote tumorigenesis by inhibiting p53 activity in these studies, induction of a p53-independent role for MDM2 in neoplasia due to MDM2 overexpression cannot be ruled out. The creation of transgenic mice that harbor amplified copy numbers of Mdm2 and that overexpress the transgene in various tissues should help identify a p53-independent role for Mdm2 in neoplasia.
The data in this report strongly indicate that the predominant role of Mdm2 is to inactivate p53 function, although other effects related to Mdm2 overexpression may occur in neoplastic cells. This interpretation is consistent with the ability of Mdm2 to inactivate major functions attributable to p53 and with the lethality created by Mdm2 deficiency in otherwise normal cells. Although p53 and Mdm2 are involved in an autoregulatory feedback loop, it will be fruitful to determine other conditions under which Mdm2 function is elevated, as these should correspond to important facets of growth regulation.
Acknowledgments
We are grateful to Ana Sanchez, Sukeshi Vaishnav, and Kristie C. Clarkin for providing excellent technical assistance, and to Roland Jurecic for helpful discussion. This work was supported in part by a grant from the National Cancer Institute to L.A.D. A.B. is an associate investigator with the Howard Hughes Medical Institute.
Footnotes
The publication costs of this article were defrayed in part by page charge payment. This article must therefore be hereby marked “advertisement” in accordance with 18 U.S.C. §1734 solely to indicate this fact.
Abbreviations: Rb, retinoblastoma; PALA, N-phosphonacetyl-l-aspartate.
References
- 1.Cahilly-Snyder L, Yang-Feng T, Francke U, George D L. Somatic Cell Mol Genet. 1987;13:235–244. doi: 10.1007/BF01535205. [DOI] [PubMed] [Google Scholar]
- 2.Fakharzadeh S S, Trusko S P, George D L. EMBO J. 1991;10:1565–1569. doi: 10.1002/j.1460-2075.1991.tb07676.x. [DOI] [PMC free article] [PubMed] [Google Scholar]
- 3.Finlay C A. Mol Cell Biol. 1993;13:301–306. doi: 10.1128/mcb.13.1.301. [DOI] [PMC free article] [PubMed] [Google Scholar]
- 4.Oliner J D, Kinzler K W, Meltzer P S, George D L, Vogelstein B. Nature (London) 1992;358:80–83. doi: 10.1038/358080a0. [DOI] [PubMed] [Google Scholar]
- 5.Leach F S, Tokino T, Meltzer P, Burrell M, Oliner J D, Smith S, Hill D E, Sidransky D, Kinzler K W, Vogelstein B. Cancer Res. 1993;53:2231–2234. [PubMed] [Google Scholar]
- 6.Ladanyi M, Cha C, Lewis R, Jhanwar S C, Huvos A G, Healey J H. Cancer Res. 1993;53:16–18. [PubMed] [Google Scholar]
- 7.Bueso-Ramos C E, Yang Y, deLeon E, McCown P, Stass S A, Albitar M. Blood. 1993;82:2617–2623. [PubMed] [Google Scholar]
- 8.Sheikh M A, Shao Z-M, Hussain A, Fontana J A. Cancer Res. 1993;53:3226–3228. [PubMed] [Google Scholar]
- 9.Watanabe T, Hotta T, Ichikawa A, Kinoshita T, Nagai H, Uchida T, Murate T, Saito H. Blood. 1994;84:3158–3165. [PubMed] [Google Scholar]
- 10.Reifenberger G, Liu L, Ichimura K, Schmidt E E, Collins V P. Cancer Res. 1993;53:2736–2739. [PubMed] [Google Scholar]
- 11.Momand J, Zambetti G P, Olson D C, George D, Levine A J. Cell. 1992;69:1237–1245. doi: 10.1016/0092-8674(92)90644-r. [DOI] [PubMed] [Google Scholar]
- 12.Chen J, Lin J, Levine A J. Mol Med. 1995;1:142–152. [PMC free article] [PubMed] [Google Scholar]
- 13.Juven T, Barak Y, Zauberman A, George D L, Oren M. Oncogene. 1993;8:3411–3416. [PubMed] [Google Scholar]
- 14.Wu X, Bayle H, Olson D, Levine A J. Genes Dev. 1993;7:1126–1132. doi: 10.1101/gad.7.7a.1126. [DOI] [PubMed] [Google Scholar]
- 15.Xiao Z-X, Chen J, Levine A J, Modjtahedi N, Xing J, Sellers W R, Livingston D M. Nature (London) 1995;375:694–698. doi: 10.1038/375694a0. [DOI] [PubMed] [Google Scholar]
- 16.Martin K, Trouche D, Hagemeier C, Sorensen T S, La Thangue N B, Kouzarides T. Nature (London) 1995;375:691–694. doi: 10.1038/375691a0. [DOI] [PubMed] [Google Scholar]
- 17.Jones S N, Roe A E, Donehower L A, Bradley A. Nature (London) 1995;378:206–208. doi: 10.1038/378206a0. [DOI] [PubMed] [Google Scholar]
- 18.Montes de Oca Luna R, Wagner D S, Lozano G. Nature (London) 1995;378:203–206. doi: 10.1038/378203a0. [DOI] [PubMed] [Google Scholar]
- 19.Harvey M, Sands A T, Weiss R S, Hegi M E, Wiseman R W, Pantazis P, Giovanella B G, Tainsky M A, Bradley A, Donehower L A. Oncogene. 1993;8:2457–2467. [PubMed] [Google Scholar]
- 20.Donehower L A, Harvey M, Slagle B L, McArthur M J, Montgomery C A, Jr, Butel J S, Bradley A. Nature (London) 1992;356:215–221. doi: 10.1038/356215a0. [DOI] [PubMed] [Google Scholar]
- 21.Harvey M, McArthur M J, Montgomery C A, Jr, Butel J S, Bradley A, Donehower L A. Nat Genet. 1993;5:225–229. doi: 10.1038/ng1193-225. [DOI] [PubMed] [Google Scholar]
- 22.Slichenmeyer W J, Nelson W G, Slebos R J, Kastan M B. Cancer Res. 1993;53:4164–4168. [PubMed] [Google Scholar]
- 23.Sands A T, Suraokar M B, Sanchez A, Marth J E, Donehower L A, Bradley A. Proc Natl Acad Sci USA. 1995;92:8517–8521. doi: 10.1073/pnas.92.18.8517. [DOI] [PMC free article] [PubMed] [Google Scholar]
- 24.Di Leonardo A, Linke S P, Clarkin K, Wahl G M. Genes Dev. 1994;8:2540–2551. doi: 10.1101/gad.8.21.2540. [DOI] [PubMed] [Google Scholar]
- 25.Diller L, Kassel J, Nelson C E, Gryka M A, Litwak G, Gebhardt M, Bressac B, Ozturk M, Baker S J, Vogelstein B, Friend S H. Mol Cell Biol. 1990;10:5772–5781. doi: 10.1128/mcb.10.11.5772. [DOI] [PMC free article] [PubMed] [Google Scholar]
- 26.Mercer W E, Shields M T, Lin D, Appella E, Ullrich S J. Proc Natl Acad Sci USA. 1991;88:1958–1962. doi: 10.1073/pnas.88.5.1958. [DOI] [PMC free article] [PubMed] [Google Scholar]
- 27.Lin D, Shields M T, Ullrich S J, Appella E, Mercer W E. Proc Natl Acad Sci USA. 1992;89:9210–9214. doi: 10.1073/pnas.89.19.9210. [DOI] [PMC free article] [PubMed] [Google Scholar]
- 28.Price B D, Park S J. Cancer Res. 1994;54:896–899. [PubMed] [Google Scholar]
- 29.Chen C Y, Oliner J D, Zhan Q, Fornace A J, Jr, Vogelstein B, Kastan M B. Proc Natl Acad Sci USA. 1994;91:2684–2688. doi: 10.1073/pnas.91.7.2684. [DOI] [PMC free article] [PubMed] [Google Scholar]
- 30.Stewart N, Hicks G G, Paraskevas F, Mowat M. Oncogene. 1995;10:109–115. [PubMed] [Google Scholar]
- 31.Aloni-Grinstein R, Schwartz D, Rotter V. EMBO J. 1995;14:1392–1401. doi: 10.1002/j.1460-2075.1995.tb07125.x. [DOI] [PMC free article] [PubMed] [Google Scholar]
- 32.Linke S P, Clarkin K, Di Leonardo A, Tsou A, Wahl G M. Genes Dev. 1996;10:934–947. doi: 10.1101/gad.10.8.934. [DOI] [PubMed] [Google Scholar]
- 33.Moyer J D, Smith P A, Levy E J, Handschumacher R E. Cancer Res. 1982;42:4525–4531. [PubMed] [Google Scholar]
- 34.Livingstone L R, White A, Sprouse J, Livanos E, Jacks T, Tisty T D. Cell. 1992;70:923–935. doi: 10.1016/0092-8674(92)90243-6. [DOI] [PubMed] [Google Scholar]
- 35.Deng C, Zhang P, Harper J W, Elledge S J, Leder P. Cell. 1996;82:675–684. doi: 10.1016/0092-8674(95)90039-x. [DOI] [PubMed] [Google Scholar]
- 36.Di Leonardo A, Linke S P, Yin Y, Wahl G M. Cold Spring Harbor Symp Quant Biol. 1993;58:655–667. doi: 10.1101/sqb.1993.058.01.073. [DOI] [PubMed] [Google Scholar]
- 37.Harvey M, McArthur M J, Montgomery C A, Jr, Bradley A, Donehower L A. FASEB J. 1993;7:938–943. doi: 10.1096/fasebj.7.10.8344491. [DOI] [PubMed] [Google Scholar]
- 38.Harvey M, Vogel H, Morris D, Bradley A, Bernstein A, Donehower L A. Nat Genet. 1995;9:305–311. doi: 10.1038/ng0395-305. [DOI] [PubMed] [Google Scholar]
- 39.Sah V P, Attardi L D, Mulligan G J, Williams B O, Bronson R T, Jacks T. Nat Genet. 1995;10:175–179. doi: 10.1038/ng0695-175. [DOI] [PubMed] [Google Scholar]
- 40.Barak Y, Juven T, Haffner R, Oren M. EMBO J. 1993;12:461–468. doi: 10.1002/j.1460-2075.1993.tb05678.x. [DOI] [PMC free article] [PubMed] [Google Scholar]
- 41.DeGregori J, Kowalik T, Nevins J R. Mol Cell Biol. 1995;15:4215–4224. doi: 10.1128/mcb.15.8.4215. [DOI] [PMC free article] [PubMed] [Google Scholar]
- 42.Cheng J, Scully P, Shew J Y. Blood. 1990;75:730–735. [PubMed] [Google Scholar]
- 43.Todaro G J, Green H. J Cell Biol. 1963;17:299–313. doi: 10.1083/jcb.17.2.299. [DOI] [PMC free article] [PubMed] [Google Scholar]