

Abstract
Purpose
Different subspecies of rhesus monkeys (Macaca mulatta) that are derived from different geographical locations, primarily Indian and China, are commonly employed in vision research. Substantial morphological and behavioral differences have been reported between Chinese- and Indian-derived subspecies. The purpose of this study was to compare refractive development in Chinese- and Indian-derived rhesus monkeys.
Methods
The subjects were 216 Indian-derived and 78 Chinese-derived normal infant rhesus monkeys. Cross-sectional data were obtained at 3 weeks of age for all subjects. In addition, longitudinal data were obtained from 10 Indian-derived (male = 5, female = 5) and 5 Chinese-derived monkeys (male =3, female =2) that were reared with unrestricted vision. Ocular and refractive development was assessed by retinoscopy, keratometry, video-based ophthalmophakometry, and A-scan ultrasonography.
Results
Although the course of emmetropization was very similar in these two groups of rhesus monkeys, there were consistent and significant inter-group differences in ocular dimensions and refractive error. Throughout the observation period, the Chinese-derived monkeys were on average about 0.4 D less hyperopic than the Indian-derived monkeys and the Chinese-derived monkeys had longer overall axial lengths, deeper anterior and vitreous chamber depths, thicker crystalline lenses, flatter corneas and lower powered crystalline lenses.
Conclusions
The ocular differences observed in this study presumably reflect genetic differences between subspecies but could reflect the differences in the genetic pool between isolated colonies rather than true subspecies differences. Nonetheless, the substantial ocular differences that we observed emphasize that caution must be exercised when comparing and/or pooling data from rhesus monkeys obtained from different colonies. These inter-subspecies differences might be analogous to the ethnic differences in ocular parameters that have been observed in humans.
Keywords: refractive error, axial length, emmetropization, corneal power, crystalline lens
INTRODUCTION
There has been a long-standing debate concerning the relative importance of environmental versus genetic factors in determining an individual’s refractive status, particularly in the case of myopia (Bear, 1991, Goss et al., 1988, Mutti et al., 1996, Rosenfield & Gilmartin, 1998). A large body of research in laboratory animals has clearly demonstrated that the emmetropization process is regulated by visual feedback associated with the eye’s refractive status and that viewing conditions that degrade the retinal image or that alter the eye’s effective focus can alter eye growth and produce refractive errors that appear to be analogous to common ametropias in children (Norton & Siegwart, 1995, Smith, 1998, Wallman & Winawer, 2004, Wildsoet, 1997). Likewise, the clear association found in many epidemiological studies between myopia and the onset and prominence of certain types of visual experience suggests that vision plays a causal role in the genesis of myopia (McBrien & Adams, 1997, Tay et al., 1992, Zylbermann et al., 1993). On the other hand, there is substantial evidence that genetic factors play a significant role in refractive development. Familial inheritance patterns (Mutti et al., 2002, Sorsby et al., 1966), concomitance between the refractive errors of identical twins (Hu, 1981, Knobloch et al., 1985, Miller, 1995, Teikari et al., 1990, Teikari et al., 1989, Teikari et al., 1991, Teikari & O’Donnell, 1989), and ethnic differences in the prevalence of certain refractive errors (Kleinstein et al., 2003, Sperduto et al., 1983) attest to the influence of genetic factors. Moreover, the identification of specific gene loci associated with distinctive refractive errors provides proof at the molecular level for the importance of genetic information (Naiglin et al., 1999, Naiglin et al., 2002, Paluru et al., 2003, Young et al., 2001, Young et al., 1998a, Young et al., 1998b). Thus, a reasonable proposition is that aspects of visual experience normally trigger the onset and progression of myopia, but that an eye’s initial dimensions and the operational properties of the vision-dependent mechanisms that regulate refractive development (i.e., an eye’s sensitivity to visual factors) are largely determined by an individual’s genetic makeup.
In this respect, identifying robust intra-species variations in eye size and refractive-error development in laboratory animals that are genetic in origin could potentially provide insight into the etiology of common refractive errors. Inter-strain differences in eye size have been identified (Puk et al., 2006, Zhou & Williams, 1999b) and associated with specific gene loci in the mouse (Zhou & Williams, 1999a). In addition, inter-strain differences in ocular development and, in particular, in the responses to abnormal visual experience have been found in chickens (Guggenheim et al., 2002, Schmid & Wildsoet, 1996, Stone et al., 1995, Troilo et al., 1995). For example, in comparison to the Cornell-K strain of White Leghorn chicks, the Washington H & N strain normally exhibits steeper corneas, thinner crystalline lenses and deeper vitreous chambers (Troilo et al., 1995). Several laboratories have also found quantitative differences between strains of chickens in the rates of myopic progression and the degree of myopia produced by form deprivation (Guggenheim et al., 2002, Schmid & Wildsoet, 1996, Stone et al., 1995, Troilo et al., 1995). It is possible that these inter-strain differences are analogous to the ethnic differences in the prevalence of refractive errors found in humans.
Rhesus monkeys are frequently used in eye and vision research and although they are commonly considered a unitary species, at least six distinct and separate subspecies of Macaca mulatta exist (Smith & McDonough, 2005). However, rhesus monkeys are frequently divided into 2 broad groups according to the country of origin and referred to as Chinese- and Indian-derived rhesus monkeys, with each group consisting of several subspecies (Smith & McDonough, 2005). Several genetic markers distinguish rhesus monkeys derived from India versus rhesus monkeys derived from China (Zhang & Shi, 1993). While these two groups of sub-species are similar in very many respects, there are distinctive physical, behavioral and biochemical differences between Chinese- and Indian-derived rhesus monkeys (Champoux et al., 1997, Champoux et al., 1996, Clarke & O’Neil, 1999). For example, in comparison to Indian-derived monkeys, Chinese-derived rhesus monkeys have been reported to exhibit more aggressive and irritable behaviors and more sexual dimorphism (Champoux et al., 1997, Champoux et al., 1994, Clarke & O’Neil, 1999). And although body size and shape differences have been documented between populations of the same species living in different geographical environments (Clarke & O’Neil, 1999), in a given regional center, it has been reported that adult male Chinese-derived rhesus are heavier and taller than Indian-derived males, but that Chinese-derived adult females monkeys were lighter and shorter than their Indian-derived counterparts (Clarke & O’Neil, 1999). However, there have not been any previous comparisons of the ocular dimensions and/or refractive development in these two groups of subspecies.
In addition to providing a foundation for studies of genetic issues related to refractive errors in primates, identifying differences in ocular development between Chinese-derived and Indian-derived rhesus monkeys would have practical implications for refractive-error research using rhesus monkeys. For example, if there are systematic differences, then combining data from monkeys obtained from different sub-species or animal colonies could potentially increase the variance in the data and obscure treatment effects. Therefore, the purpose of this investigation was to compare normal ocular development between infant rhesus monkeys derived from isolated colonies of Chinese- versus Indian-derived monkeys.
MATERIALS AND METHODS
Subjects
All of the subjects were rhesus monkeys (Macaca mulatta); 216 infant monkeys were obtained from an isolated colony of Indian-derived rhesus monkeys and 78 infants were obtained from a second isolated colony of Chinese-derived rhesus monkeys. Both colonies are located in southern Texas and share similar climates and housing environments. We have assumed that any differences between the infants obtained from these two colonies reflect subspecies differences; however, familial differences could also contribute to any inter-group differences.
All animals were obtained at 2 to 6 weeks of age and housed in our primate nursery that was maintained on a 12-hour light/12-hour dark lighting cycle. Cross-sectional data on refractive error, corneal power, axial dimensions and crystalline lens phakometry were typically obtained from both eyes of all subjects at about 3 weeks of age (mean ± SD = 24.5 ± 4.8 days for the Indian-derived group and 22.9 ± 3.1 days for the Chinese-derived group). At the initial measurement sessions, there were no significant differences in body weight between the two cross-sectional groups (Indian-derived = 0.55 ± 0.08 kg, Chinese-derived = 0.56 ± 0.07 kg, two-sample t-test, p = 0.30). Longitudinal biometric data on refractive and ocular development were obtained from a subset of 15 infants that were selected randomly (10 from the Indian-derived group and 5 from the Chinese-derived group). For the animals in the longitudinal group, measurements were made subsequently every 2–4 weeks until at least 300 days of age. During the observation period, all of the animals maintained good health and both groups of monkeys demonstrated similar weight gains. At 300 days of age the average weight of the Indian-derived monkeys (1.62 ± 0.22 kg) was slightly greater than that for the Chinese-derived infants (1.60 ± 0.11 kg); however this difference was not significant (Two sample t-test, p = 0.86). All animals exhibited clear media and showed no signs of ocular pathology.
The details of the nursery care for our infant monkeys have been described previously (Hung et al., 1995, Smith & Hung, 1999). All of the rearing and experimental procedures were reviewed and approved by the University of Houston’s Institutional Animal Care and Use Committee and were in compliance with the ARVO Statement for the Use of Animals in Ophthalmic and Vision Research and the National Institutes of Health Guide for the Care and Use of Laboratory Animals.
Biometric Measurements
Many of the methods that were used to assess refractive development in the infant monkeys have been described previously (Smith and Hung, 1999; Kee et al., 2002). To make these measurements, the monkeys were anesthetized with an intramuscular injection of ketamine hydrochloride (15–20 mg/kg) and acepromazine maleate (0.15–0.2 mg/kg) and topically instilled 0.5% tetracaine hydrochloride. Cycloplegia was achieved by topically instilling 2 drops of 1% tropicamide, 20–30 minutes before performing any measurement that would potentially be affected by the level of accommodation. While the measurements were being taken, the eyelids were gently held apart by a custom made speculum and the corneal tear film was maintained by frequent irrigation with a balanced saline solution.
The refractive status of each eye, both the spherical and cylindrical components, were measured along the pupillary axis by two experienced investigators using a streak retinoscope and averaged (Harris, 1988). An eye’s refractive error was defined as the mean spherical-equivalent, spectacle-plane refractive correction.
The anterior radius of curvature of the cornea was measured with a hand-held keratometer (Alcon Auto-keratometer; Alcon Systems Inc, St Louis, MO) and/or a videotopographer (EyeSys 2000; EyeSys technologies Inc, Houston, TX). We have previously shown that both instruments provide repeatable and comparable measures of corneal curvature in infant monkeys (Kee et al., 2002). It was assumed that the cornea was effectively a single spherical refracting surface separating air from the aqueous humor and total corneal refracting power was calculated using an assumed refractive index of 1.3375 for the aqueous.
The axial dimensions of the eye, including anterior and vitreous chamber depths, lens thickness and the sum of these, axial length, were measured with an A-scan system using a focused, 30-MHz polymer transducer (model 176599; Panametrics, Waltrham, MA) digitized at 100 MHz ( model 8100 A/D board; Sonix, Springfield, VA). The transducer was coupled to the eye using a closed, water-filled interface. A three-axis positioner mounted on a slit lamp base was used to align the transducer to simultaneously maximize the echoes from the major optical components. Eight to 10 readings were recorded and averaged later. The average velocities for ultrasound in human eyes were used to calculate intraocular distances (Shammas et al., 1998).
The curvatures of the anterior and posterior lens surfaces were measured by video-based ophthalmophakometry (Mutti et al., 1992). Specifically, the equivalent radii of curvature for the anterior and posterior surfaces were derived from the apparent sizes of Purkinje Images I, III, and IV produced by the collimated light from two point sources that were optically imaged at infinity. The angle between the light sources and the CCD camera system (Cohu 6415 camera with a 55 mm, F1.4 lens on a 2X teleconverter) was fixed at 20 deg. During the measurements, the camera and source lights were positioned on opposite sides of the eye’s approximate optical axis resulting in a lateral separation of the Purkinje images in the center of the pupil. The camera was focused on each of the Purkinje images separately. The camera’s telecentric optical system minimized angular magnification effects of small focusing errors. Video images were stored via a frame grabber and imaging software was used to measure the sizes of the digitized images. Data were obtained for the 45, 90, and 135 deg meridians and then averaged. At least 2 clear frames were measured for each image. The equivalent radii for the lens surfaces were determined by comparing the sizes of the Purkinje images to the catoptric images obtained from a series of precision ball bearings (Mutti et al., 1992). With knowledge of the eye’s refractive error, corneal power, and axial dimensions, we calculated the power and equivalent refractive index of the crystalline lens (Garner, 1997).
There were no statistically significant differences in the average spherical-equivalent refractive errors or any other ocular components between the two eyes of our infant monkeys in either group (Paired t-test, p values ranged from 0.06 for equivalent lens index in Indian-derived monkeys to 0.92 for refractive error in Indian-derived monkeys); consequently only data for the right eyes are reported.
Statistical Analysis
A one-sample Kolmogorov-Smirnov Test of Composite Normality was used to test whether the refractive errors and ocular components were normally distributed in the two subspecies groups. Two-sample t-tests were used to test for differences between the Chinese- and Indian-derived groups of monkeys as well as to determine whether the monkeys selected for the longitudinal groups were representative of the larger groups of Indian- and Chinese-derived monkeys. In order to evaluate longitudinal changes in individual ocular components, a locally weighted regression scatter plot smoothing method (LOESS) was used to generate developmental curves for refractive error, corneal power, the eye’s axial dimensions, and crystalline lens radii. LOESS is a nonparametric smoothing algorithm that allows data to express itself in a trend without initial mathematical assumptions (Mose et al., 1992). LOESS was most applicable for our monkey data because the data were irregularly spaced and there were variable numbers of observations at each point in time. A bootstrap re-sampling method was used to test for significant differences between the growth curves of the Chinese- and Indian-derived monkeys for each ocular component (Henderson, 2005). This is a nonparametric and distribution free statistical technique that is most suitable for small, expensive to collect data sets where there is no prior knowledge of the data distributions (Henderson, 2005). Rayleigh’s test was used to identify the average axis of astigmatism and circular statistics were used to calculate confidence intervals (Batschelet, 1965). With the exception of Rayleigh’s test and the circular statistics, all statistical analyses were conducted using Minitab (Release 12.21, Minitab Inc, State College, PA) and S-plus 6 software (Insightful Corporation, Seattle, WA).
Schematic Eye Construction
Schematic eyes were constructed using the mean refractive errors and ocular component values for each subject group and the methods described by Bennett and Rabbetts (1989). Specifically, it was assumed that 1) the eye was a series of coaxial single spherical refracting surfaces, 2) the refractive indices of the crystalline lens (calculated using refractive error and the eye’s axial dimensions) and the aqueous and vitreous humors (n = 1.336) were homogeneous, and 3) that the cornea was a single spherical refracting surface separating air from the aqueous humor.
RESULTS
Refractive Error
Figure 1 shows the frequency distributions for spherical-equivalent refractive error for the right eyes of the 216 Indian-derived monkeys at 24.5 ± 4.8 days of age and the 78 Chinese-derived monkeys at 22.9 ± 3.1 days of age. Both groups of infant monkeys exhibited a broad range of predominantly hyperopic ametropias (range = −0.06 to +9.25 D for the Indian-derived group and +0.63 to +8.87 D for the Chinese-derived group) and the distributions of refractive errors for both groups were well described by a normal Gaussian distribution (one-sample Kolmogorov-Smirnov Test of composite normality, p > 0.15). On average, the refractive errors of the Chinese-derived monkeys (+3.82 ± 1.60 D) were significantly less hyperopic than those of the Indian-derived monkeys (+4.12 ± 1.51 D; two-sample t-test, p = 0.05) despite the fact that the Chinese-derived monkeys were on average several days younger than the Indian-derived monkeys at the initial measurement.
Figure 1.
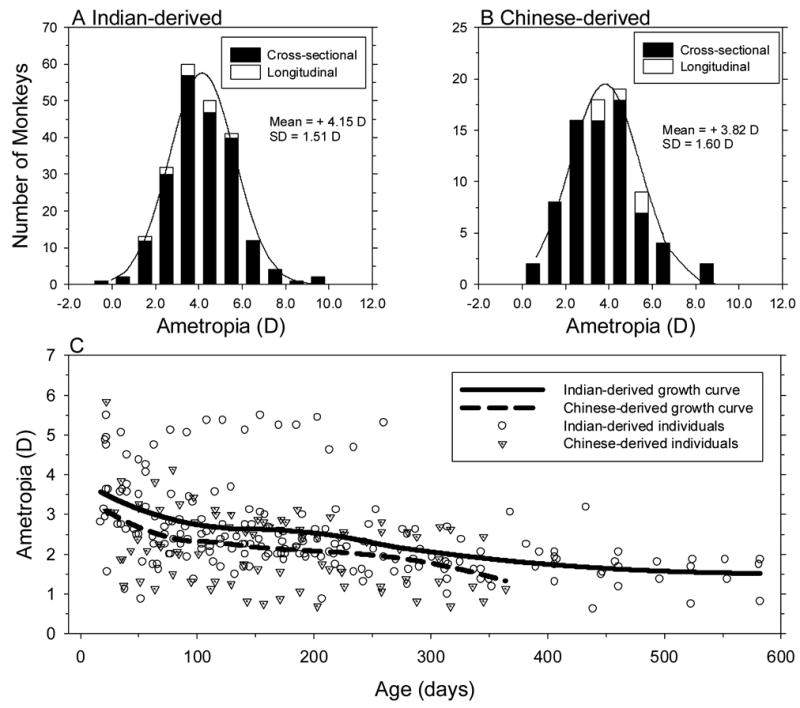
Comparisons of spherical-equivalent spectacle-plane refractive corrections between the right eyes of Chinese-derived and Indian-derived rhesus monkeys in the cross-sectional and longitudinal groups. Panels A and B show the distributions of refractive corrections in 3-week-old Indian- and Chinese-derived monkeys, respectively. The cross-sectional and longitudinal groups are represented by the filled and open bars, respectively. C. Refractive corrections plotted as a function of age for Chinese-derived (dotted triangles) and Indian-derived rhesus monkeys (open circles). The solid and dashed lines represent the LOESS growth curves for the Indian-derived and Chinese-derived rhesus monkeys, respectively.
The initial measurements for the 15 infant monkeys that were followed longitudinally (10 in the Indian-derived group and 5 in the Chinese-derived group) are represented by the open bars in Figures 1A & B. There were no significant differences in refractive error between the subgroups of monkeys that were followed longitudinally and the larger cross-sectional groups (two-sample t-test, p > 0.05 for both groups), i.e. the 15 monkeys in the longitudinal group were representative of the entire colony (Table 1).
Table 1.
Refractive Error and Ocular Components: Chinese- vs. Indian-Derived Monkeys
| Age (days) | Refractive Error (D) | Corneal Power (D) | Axial Length (mm) | Vitreous Chamber Depth (mm) | Lens Thickness (mm) | Anterior Chamber Depth (mm) | ||
|---|---|---|---|---|---|---|---|---|
| Indian Subspecies Mean ± SD (range) | Cross-sectional Group (n=206)* | 24.7 ± 4.9 (14 to 43) | +4.17 ± 1.52 (−0.06 to +9.25) | 62.21 ± 1.74 (58.29 to 67.43) | 14.49 ± 0.47 (13.25 to 15.58) | 8.57 ± 0.29 (7.78 to 9.40) | 3.33 ± 0.20 (2.55 to 3.91) | 2.58 ± 0.28 (1.85 to 3.37) |
| Longitudinal Group (n=10) | 21.4 ± 1.9 (17 to 24) | +3.78 ± 1.23 (+1.56 to +5.50) | 63.10 ± 1.08 (61.82 to 65.09) | 14.50 ± 0.41 (13.68 to 15.05) | 8.45 ± 0.22(8.18 to 8.80) | 3.33 ± 0.14 (3.12 to 3.54) | 2.70 ± 0.20 (2.20 to 2.86) | |
| Chinese Subspecies Mean ± SD (range) | Cross-sectional Group (n=73) | 22.8 ± 3.1 (16 to 30) | +3.78 ± 1.62 (+0.83 to +8.88) | 59.23 ± 1.70 (55.81 to 63.90) | 15.25 ± 0.51 (13.94 to 16.33) | 8.65 ± 0.37 (7.52 to 9.47) | 3.80 ± 0.17 (3.29 to 4.11) | 2.80 ± 0.32 (2.12 to 3.48) |
| Longitudinal Group (n=5) | 23.6 ± 3.1 (21 to 29) | +4.28 ± 1.25 (+3.06 to +5.83) | 59.35 ± 1.42 (58.44 to 61.84) | 15.49 ± 0.49 (14.76 to 16.13) | 8.75 ± 0.16 (8.58 to 8.93) | 3.67 ± 0.26 (3.24 to 3.91) | 3.16 ± 0.36 (2.82 to 3.72) | |
| Comparison Between Indian and Chinese Cross-sectional Groups (p values) | <0.001 | <0.05 | <0.001 | <0.001 | <0.05 | <0.001 | <0.001 | |
n = 139 for corneal power
Figure 1C compares the longitudinal changes in refractive error for the 10 Indian-derived monkeys (open circles) versus the 5 Chinese-derived monkeys (dotted triangles). The solid and broken lines represent the LOESS functions generated for the Indian- and Chinese-derived monkeys, respectively. Both growth curves showed a systematic reduction in hyperopia, but throughout the observation period the Indian-derived monkeys were on average +0.41 D more hyperopic than the Chinese-derived monkeys (bootstrap resampling method, p <0.05).
Axial Dimensions
Figure 2 shows the frequency distributions for the axial dimensions of the Indian- (top row) and Chinese-derived monkeys (bottom row) at about 3 weeks of age. For both groups of monkeys, the distributions of total axial length and the axial dimensions of individual components were well described by normal Gaussian distributions (one-sample Kolmogorov-Smirnov Test of composite normality, p > 0.15). There were, however, systematic differences in the axial dimensions between the Indian- and Chinese-derived groups. In comparison to the Indian-derived monkeys, the Chinese-derived infants had on average longer axial lengths (15.27 ± 0.51 mm vs. 14.49 ± 0.47 mm; two-sample t-test, p < 0.0001), deeper anterior chamber (2.82 ± 0.34 mm vs. 2.57 ± 0.28 mm; p < 0.001 ) and vitreous chamber depths (8.66 ± 0.36 mm vs. 8.57 ± 0.29; p = 0.03), and thicker crystalline lenses (3.80 ± 0.18 mm vs. 3.24 ± 0.20 mm; p < 0.001).
Figure 2.
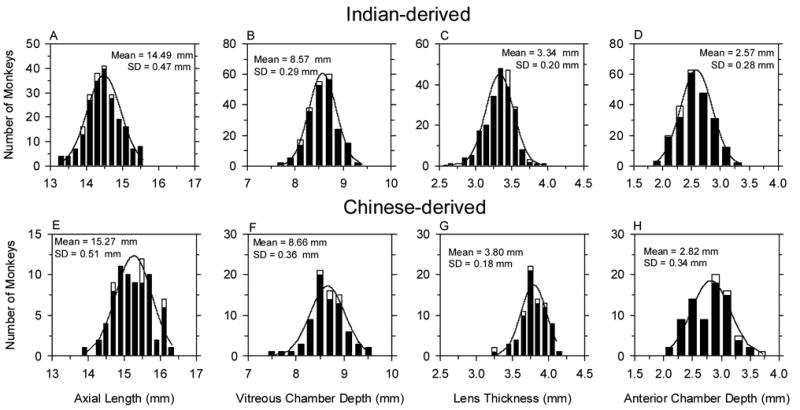
Comparisons of the distributions of axial length (A & E), vitreous chamber depth (B & F), lens thickness (C & G) and anterior chamber depth (D & H) between Indian-derived (top row) and Chinese-derived rhesus monkeys (bottom row) at 3 weeks of age. The cross-sectional and longitudinal groups are represented by the filled and open bars, respectively.
The initial axial dimensions for the subgroups of monkeys that were followed longitudinally were comparable to those of the larger cross-sectional groups (two-sample t-test, p > 0.05 for both groups). Figure 3 illustrates the longitudinal changes in axial dimensions; the format is similar to that used in Figure 1C. Both groups of monkeys exhibited exponential increases in anterior chamber depth, vitreous chamber depth, and overall axial length. The magnitudes of the increases during the first year of life were similar in the two groups of monkeys (two-sample t-test, p = 0.17 for axial length, p = 0.07 for anterior chamber, p = 0.32 for vitreous chamber depth). However, axial growth was slightly faster in the Chinese-derived monkeys. Using the axial dimensions at 1 year of age as a reference, the anterior chamber, vitreous chamber and axial length in Chinese-derived monkeys reached 90% of the 1-year values by 220, 260 and 270 days of age, respectively. In comparison the Indian-derived monkeys reached the 90% values at 250, 290 and 280 days, respectively. In both subspecies, lens thickness was relatively constant over the first year of life with the Chinese-derived monkeys always showing slightly thicker lenses (Mean = 0.14mm, SE = 0.0016 mm, bootstrap resampling, p < 0.05).
Figure 3.
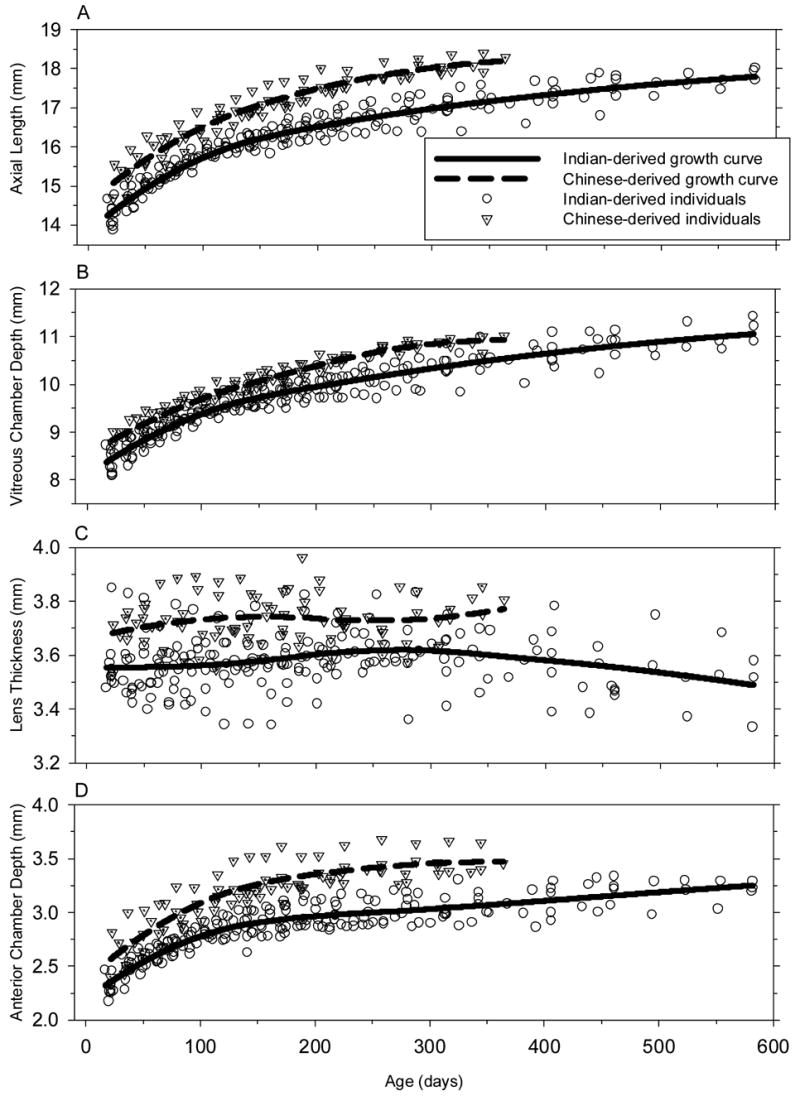
Axial dimensions (A, axial length; B, vitreous chamber depth; C, lens thickness; D, anterior chamber depth) for Chinese- (dotted triangles) and Indian-rhesus monkeys (open circles) plotted as a function of age for individual animals. The solid and dashed lines represent the LOESS growth curves for the Indian-derived and Chinese-derived rhesus monkeys, respectively.
Corneal Power
Figure 4 compares the distributions for corneal powers at 3 weeks of age and the longitudinal changes in corneal power for the Indian- and Chinese-derived monkeys. The distribution of corneal powers was well described by a normal Gaussian distribution for the Indian-derived monkeys (one-sample Kolmogorov-Smirnov Test of composite normality, p > 0.15), but not for the Chinese-derived group (p = 0.037). On average, the Indian-derived infants had steeper, more powerful corneas (+62.26 ± 1.72 D versus +59.76 ± 1.70 D; two-sample t-test, p = 0.001), but the variance of corneal powers was comparable for both subspecies. Both subspecies exhibited exponential decreases in corneal power with age. The growth curves for both subspecies were essentially parallel throughout the observation period with the Indian-derived monkeys showing corneal powers that were on average 2.87 D (bootstrap resampling, p < 0.05) steeper than those of the Chinese-derived animals. The absolute magnitudes of the age-dependent decreases in corneal power during the first year of life were similar in both subspecies (average = 7.58 ± 0.87 D in Chinese vs. 8.22 ± 1.05 D in Indian; two sample t-test, p = 0.25,) with 90% of the one-year changes in power taking place by 220 days in both the Chinese- and Indian-derived monkeys.
Figure 4.
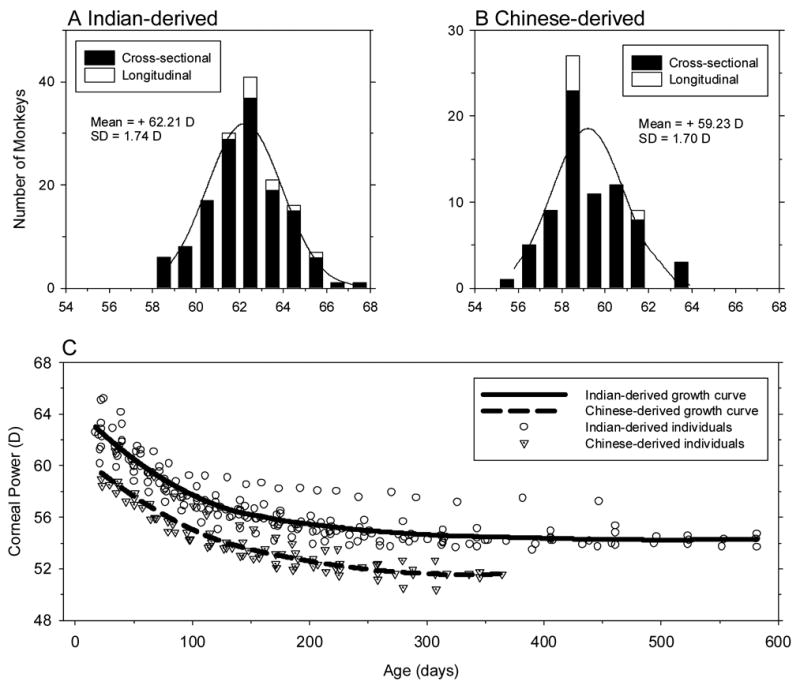
Comparisons of corneal power between Chinese-derived and Indian-derived rhesus monkeys in the cross-sectional and longitudinal group. Panels A and B show the distributions of corneal power in 3-week-old Indian- and Chinese-derived monkeys, respectively. Corneal power plotted as a function of age for Chinese- and Indian-derived monkeys in panel C. See Figure 1 for other details.
Crystalline Lens
At the start of the observation period, the Indian- and Chinese-derived monkeys had crystalline lenses that had similar equivalent refracting powers (+56.17 ± 3.38 D in Indian-derived vs. +57.84 ± 1.76 D in Chinese-derived, two-sample t-test, p = 0.23); however, there were differences in the shapes of the crystalline lenses (Figure 5). In comparison to the Chinese-derived infants, the Indian-derived infants had similar anterior lens radii (anterior lens radius = 5.19 ± 0.35 mm in Indian-derived vs. 5.33 ± 0.24 mm in Chinese-derived, two-sample t-test. p = 0.40), but shorter posterior lens radii (posterior lens radius = 4.13 ± 0.24 mm vs. 4.76 ± 0.29 mm, two-sample t-test, p = 0.005).
Figure 5.
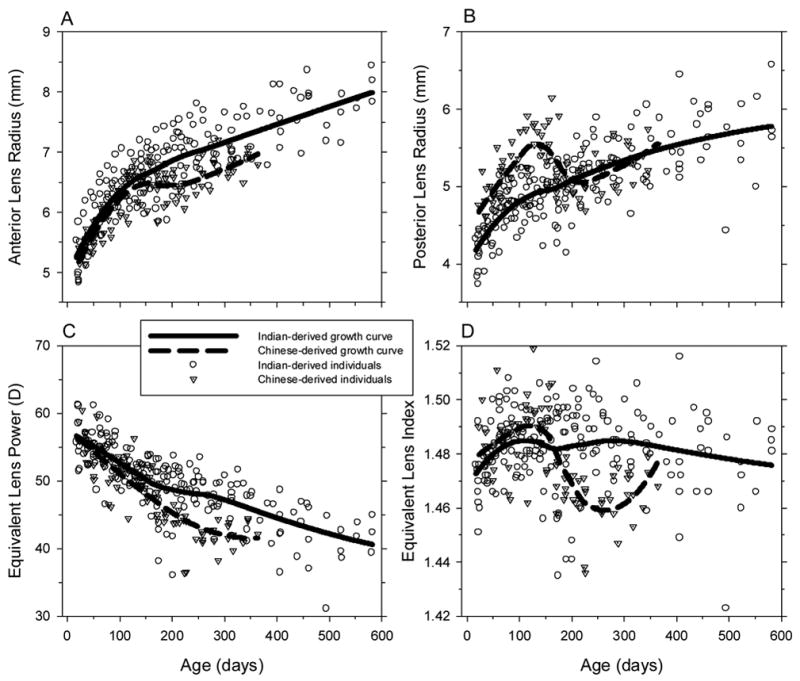
Crystalline lens parameters (A, anterior lens radius of curvature; B, posterior lens radius of curvature; C, equivalent lens power; D, equivalent lens index) plotted as a function of age for individual Chinese- (dotted triangles) and Indian-derived monkeys (open circles). The solid and dashed lines represent the LOESS growth curves for the Indian-derived and Chinese-derived rhesus monkeys, respectively.
Both subspecies showed substantial reductions in lens power over the course of the observation period with the Chinese-derived monkeys showing larger absolute lens power changes during the first year of life (15 vs. 11 D). For both subspecies, these changes in lens power were larger than the corneal power changes that were observed during the same time period and were associated with changes in the curvature of the anterior and posterior lens surfaces. For the Indian-derived monkeys the anterior and posterior lens radii increased in an exponential fashion (Figure 5A & 5B). In contrast, in the Chinese-derived monkeys the initial increases in radius of curvature were followed by a brief period starting at around 150 days of age when the anterior radius of curvature was relatively stable (Fig 5A) and there was an actual decrease in posterior lens radius (Fig 5B). Inspection of the data from individual animals showed that this two-phase pattern occurred in each of the 5 Chinese-derived monkeys, but it was not obvious in any of the Indian-derived monkeys. The calculated refractive index of the lens in the Chinese-derived group also showed a two-phase growth pattern while the lens refractive index for the Indian-derived group was relatively constant over time. There is no obvious biological explanation for these differences in growth patterns nor were there any methodological issues that could have obviously contributed to the observed differences. However, these differences should be viewed cautiously since there were only 5 animals in the Chinese-derived longitudinal group.
Astigmatism
In agreement with previous observations on Indian-derived rhesus monkeys (Kee et al., 2002) both the Indian- and Chinese-derived populations had a low prevalence of astigmatism. At three weeks of age, only 1 monkey in each group exhibited more than 1 D of refractive astigmatism (Fig 6 A & B). On average, the Indian-derived infants exhibited less refractive astigmatism at 3 weeks of age than the Chinese-derived monkeys (0.19 ± 0.22 D versus 0.30 ± 0.25 D; two-sample t-test, p < 0.001); however, the amounts of refractive astigmatism in both subspecies were quite small by clinical standards. As shown in Figure 7A, the amount of refractive astigmatism was relatively constant throughout the observation period in both subspecies.
Figure 6.
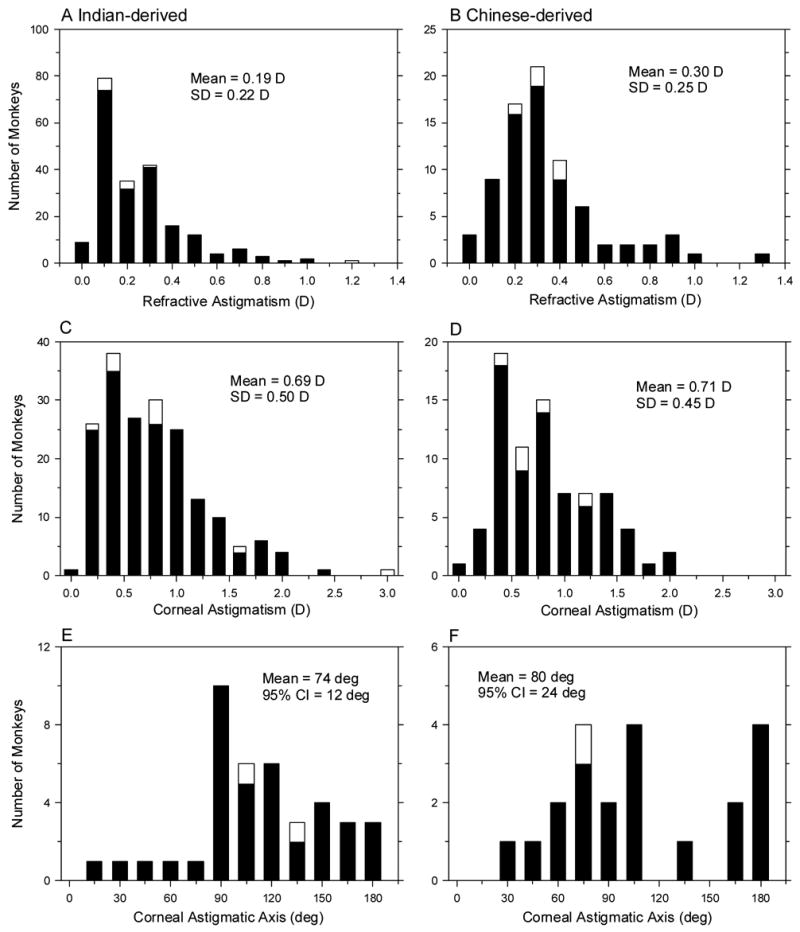
Distributions of refractive astigmatism (A & B), corneal astigmatism (C & D), and the corneal astigmatic axes (E & F) for the Indian- (left) and Chinese-derived monkeys (right) at 3 weeks of age. The cross-sectional and longitudinal groups are represented by the filled and open bars, respectively.
Figure 7.
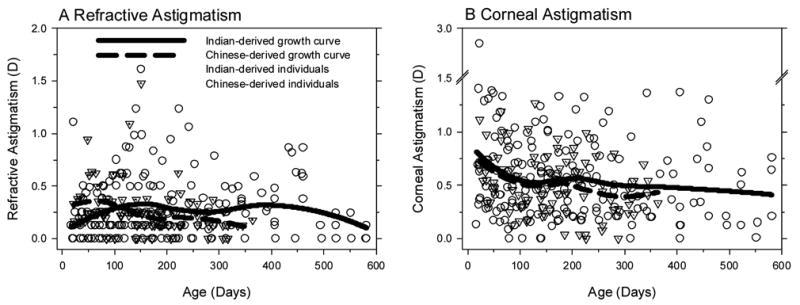
Refractive (A) and corneal astigmatism (B) plotted as a function of age for individual Chinese- (dotted triangles) and Indian-derived monkeys (open circles). The solid and dashed lines represent the LOESS growth curves for the Indian-derived and Chinese-derived rhesus monkeys, respectively.
In both subspecies, the magnitudes of corneal astigmatism at three weeks of age were similar (Indian = 0.69 ± 0.50 D, Chinese = 0.71 ± 0.45 D; two-sample t-test, p = 0.68) and larger than their respective amounts of refractive astigmatism (two-sample t-tests, p < 0.001). However, in both Indian- and Chinese-derived subspecies more than 70% of the monkeys exhibited less than 1.0 D of corneal astigmatism (Fig 6 C & D). There was a tendency for the amount of corneal astigmatism to decrease with age (Fig 7B); however, the observed changes in the average amounts of corneal astigmatism were less than 0.25 D and the average amounts of corneal astigmatism exceeded the amounts of refractive astigmatism at all ages. The fact that the amounts of refractive astigmatism were smaller than the amounts of corneal astigmatism suggests that some of the corneal astigmatism was counterbalanced by astigmatism associated with the eye’s internal optical components.
The axis of corneal astigmatism was also similar in the Indian- and Chinese-derived monkeys. Figures 6 E & F show the axes of astigmatism (axis of the minus cylinder correcting lens) for those monkeys that exhibited ≥ 1.0 D of corneal astigmatism. Both subspecies tended to exhibit against-the-rule astigmatism at 3 weeks of age. Rayleigh’s test revealed that the axis of astigmatism was not randomly distributed in either groups (Batschelet, 1965). The axes for the Indian-derived monkeys were clustered around a mean direction of 74° ± 12° (r2 = 0.79, n = 40, p < 0.05) while the mean axis for the Chinese-derived monkeys was 80° ± 24° (r2 = 0.69, n = 21, p < 0.05).
Schematic eyes of young rhesus monkeys
Based on the average refractive errors and ocular parameters of our rhesus monkeys at 1 month and 1 year of age, two schematic eye models were constructed for the Chinese and Indian-derived monkeys. Full morphometric information is presented in Table 2. Figure 8 shows the scaled schematic representations of the model eyes, including the locations of the calculated principal planes, nodal points and focal points. It is quite clear that Chinese-derived monkeys had larger eyes at both ages. Nevertheless, the relative positions of the cardinal points were very similar in the Chinese and Indian-derived monkeys (Table 2).
Table 2.
Schematic Eyes for Chinese- and Indian-Derived Rhesus Monkeys
| Indian-derived monkeys 30 days | Indian-derived monkeys 360 days | Chinese-derived monkeys 30 days | Chinese-derived monkeys 360 days | ||
|---|---|---|---|---|---|
| Radii of curvature (mm) | |||||
| cornea | r1 | 5.64 | 6.53 | 6.25 | 6.72 |
| lens: anterior surface | r2 | 5.19 | 7.28 | 5.33 | 6.79 |
| lens: posterior surface | r3 | −4.24 | −5.45 | −4.76 | −5.36 |
| Axial dimensions (mm) | |||||
| depth of anterior chamber | d1 | 2.31 | 3.06 | 2.60 | 3.46 |
| thickness of crystalline lens | d2 | 3.43 | 3.59 | 3.68 | 3.70 |
| depth of vitreous chamber | d3 | 8.41 | 10.54 | 8.86 | 10.88 |
| overall axial length | 14.15 | 17.19 | 15.14 | 18.04 | |
| Mean refractive indices | |||||
| aqueous humour | n2 | 1.336 | 1.336 | 1.336 | 1.336 |
| lens | n3 | 1.4742 | 1.4802 | 1.4870 | 1.4654 |
| vitreous humour | n4 | 1.336 | 1.336 | 1.336 | 1.336 |
| Surface powers (D) | |||||
| cornea | F1 | +59.59 | +51.43 | +53.77 | +50.02 |
| lens: anterior surface | F2 | +26.61 | +19.80 | +28.33 | +19.06 |
| lens: posterior surface | F3 | +32.59 | +26.46 | +31.70 | +24.16 |
| Equivalent powers (D) | |||||
| lens | FL | +57.18 | +44.99 | +57.81 | +42.06 |
| eye | Fo | +106.37 | +87.83 | +101.30 | +83.59 |
| Equivalent focal lengths of eye (mm) | |||||
| anterior (PF) | fo | −9.40 | −11.39 | −9.87 | −11.96 |
| posterior (P′F′) | f′o | 12.56 | 15.21 | 13.19 | 15.98 |
| Distances from corneal vertex (mm) | |||||
| first principal point | A1P | 1.64 | 1.90 | 1.89 | 2.03 |
| second principal point | A1P′ | 2.01 | 2.32 | 2.32 | 2.40 |
| first nodal point | A1N | 4.80 | 5.73 | 5.20 | 6.05 |
| second nodal point | A1N′ | 5.16 | 6.14 | 5.64 | 6.42 |
| first principal focus | A1F | −7.76 | −9.48 | −7.99 | −9.93 |
| second principal focus | A1F′ | 14.57 | 17.53 | 15.51 | 18.38 |
| Refractive Correction (D) | K | +3.69 | +2.01 | +2.87 | +1.85 |
Figure 8.
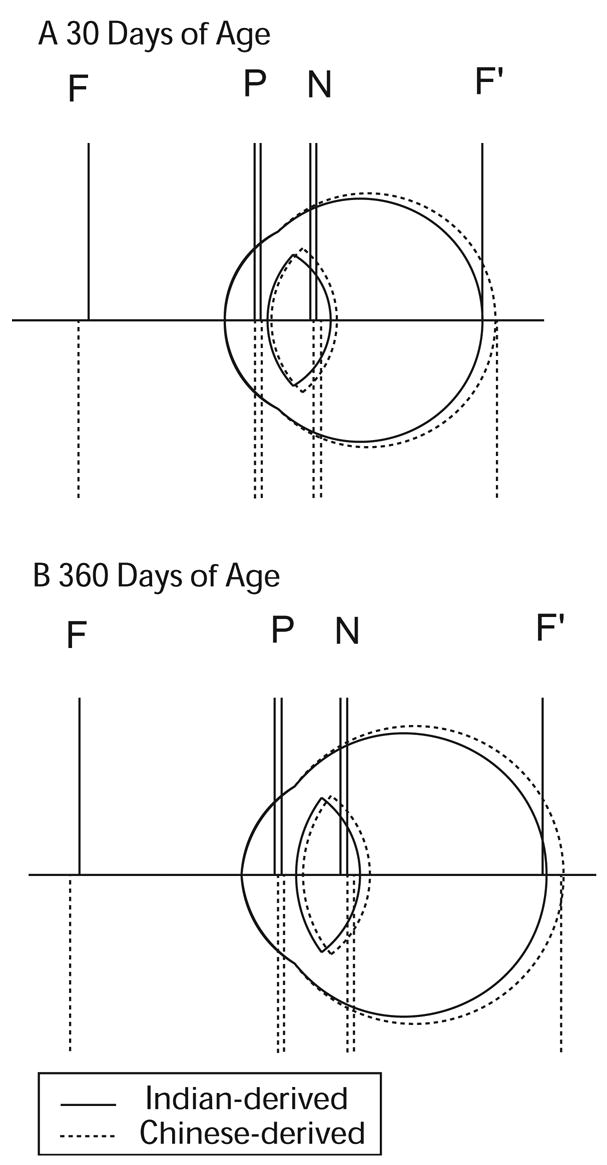
Schematic eye models for the Chinese- (broken lines) and Indian-derived monkeys (solid lines) at 1 (A) and 12 months of age (B). F and F′ = anterior and posterior focal point, P and P′ = principal points, N and N′ = nodal points.
DISCUSSION
Despite obvious differences in ocular dimensions, refractive development proceeded in similar fashion in Indian- and Chinese-derived monkeys. Specifically, the range and variance of spherical and astigmatic refractive errors found in newborns, the time course for emmetropization, and the magnitude of refractive changes that took place during the first year of life were very comparable. Likewise the growth curves for individual ocular components, with the possible exception of the crystalline lens, were also very similar in terms of the magnitude of the dimensional changes and the rate at which these changes took place. In addition, the optical organization of their eyes, as represented by schematic optical models and the changes in the positions of the cardinal points over time, were essentially the same in the two groups of monkeys. However, at all ages the Chinese-derived rhesus monkeys had larger eyes with slightly less hyperopic refractive errors than their Indian-derived counterparts. In particular, the Chinese-derived monkeys showed deeper anterior and vitreous chambers, thicker crystalline lenses, longer overall axial lengths and flatter corneas than the Indian-derived monkeys.
Prior to the 1970s, Indian-derived subspecies were used almost exclusively in biomedical and behavioral research involving rhesus monkeys. However, since then there has been a gradual replacement of Indian-derived monkeys with Chinese-derived monkeys in medical research. This transition was accelerated in the mid 1980s when Chinese-derived subspecies became increasingly available from breeding colonies of wild-caught Chinese-derived rhesus monkeys (Champoux et al., 1997, Smith & McDonough, 2005). Consequently, it is critical to identify anatomical and physiological differences between these subspecies groups that could influence the results of studies using a single subspecies group or when members of both of these subspecies groups are combined. In this respect, previous studies have reported morphometric differences between Chinese- and Indian-derived monkeys (Clarke & O’Neil, 1999, Paterson, 1996). In particular, Clarke and O’neil (1999) reported that Chinese-derived rhesus monkeys were heavier and taller than their Indian-derived counterparts even when the two subgroups were maintained in identical housing, with identical diets, climates and group sizes. This is potentially important because in some species overall body size has a small, but significant, influence on eye size (Zhou & Williams, 1999b). In fact it has been reported in humans that taller individuals tend to have longer axial lengths and flatter corneas (Ojaimi et al., 2005a, Saw et al., 2002, Wong et al., 2001). However, there were no significant differences in body weight between our two subspecies groups at either 3 weeks or 300 days of age. Thus, the observed differences in eye size can not be attributed in a simple way to overall differences in body size. It is possible that other morphometric differences may have contributed to the differences in eye size. For example, it has also been reported that Chinese-derived monkeys, both males and females, have wider heads than their Indian-derived counterparts (Clarke & O’Neil, 1999). It is possible that wider heads reflect larger skulls and possibly larger orbits, which would more easily accommodate the larger eyes observed in this study.
Our retinoscopy measures indicated that at all ages our Indian-derived monkeys were more hyperopic than our Chinese-derived monkeys. The average differences were 0.51 D for the cross-sectional group of neonates and 0.41 D for the longitudinal group over the entire observation period. However, since the Indian-derived monkeys also had shorter average axial lengths (0.76 mm for the cross-sectional group and 0.48 mm for the longitudinal group), some of the measured refractive-error differences can be attributed to differences in the magnitude of the small eye artifact associated with retinoscopy (Glickstein & Millodot, 1970). If we assume that the retina is between 200 to 300 microns thick in rhesus monkeys and constant with age and between subspecies groups, then the differences in the small eye artifact between Chinese and Indian monkeys would be between 0.18 to 0.28 D at 1 months of age and 0.12 to 0.19 D at 12 months of age (Glickstein & Millodot, 1970). Taking these potential measurement discrepancies into account, the true refractive-error differences between our Chinese- and Indian-derived monkeys would be smaller and on average only about 0.25 D. Thus, when potential methodological issues are taken into account, the refractive errors differences between these two subspecies groups are probably small enough to warrant pooling of refractive error data.
We have assumed that the observed ocular size differences reflect genetic differences related to the origins of these two subspecies groups. In this respect, the differences between our Chinese- and Indian-derived rhesus monkeys appear to be analogous to some of the inter-strain differences found in chickens (Guggenheim et al., 2002, Schmid & Wildsoet, 1996, Stone et al., 1995, Troilo et al., 1995). However, it is also possible that the differences that we observed in our Chinese- and Indian-derived monkeys might simply reflect the potential differences between any two restricted colonies of rhesus monkeys, irrespective of subspecies. In this respect, it is important to note that significant intra-strain differences in ocular dimensions have been reported between different cohorts of chicks (Guggenheim et al., 2002). Moreover, differences in overall body size have been reported for members of a given subspecies of rhesus monkeys that were acclimated to different environments (Clarke & O’Neil, 1999). Although our two groups of monkeys came from different colonies, both colonies were located in the same general geographical location and the basic environments in both colonies were similar. Specifically, the climates were similar; both colonies included substantial outdoor open caging systems and maintained the animals on similar diets. Therefore, it is more likely that the observed differences in eye size reflect genetic differences rather than general environmental differences.
Genetic factors are likely to influence not only the initial ocular dimensions of infants but also the operating properties of the vision-dependent mechanisms that mediate emmetropization. Consequently even though the course and outcome of the emmetropization process was very similar in our Chinese- and Indian-derived groups when they were allowed unrestricted vision, it is not known whether alterations in visual experience affect refractive development in these two subspecies in a similar manner. Therefore, the subspecies composition of rhesus monkeys used in experiments on refractive development should be taken into consideration until this issue is resolved.
The substantial differences in ocular dimensions observed in our two populations of rhesus monkeys provide an opportunity to explore the genetic factors that influence eye size in a species that is very similar to humans. In humans, ethnic differences in refractive error are well documented. For example, many studies have reported that the prevalence of myopia differs with ethnicity with the highest prevalence occurring in Asians, followed by Hispanics, Caucasians and African-Americans (Hyman, et al., 2005, Katz, et al., 1997, Kleinstein et al., 2003, Sperduto et al., 1983, Voo, et al., 1998). Even when children grow up in the same geographical area and are exposed to the same educational system, clear ethnic differences in refractive error have been observed. For instance, Garner et al. (Garner et al., 1990) found that the prevalence of myopia in Melanesian school-aged children was 2.9% versus 25.6 % for Malaysian children attending the same schools. As might be expected in populations that have different refractive errors, there were also substantial differences in the ocular dimensions between the Melanesian and Malaysian children. Substantial ocular dimension differences have also been observed in children among different ethnic groups from similar sociological and geographical environments (Ojaimi et al., 2005b, Zadnik et al., 2006). For example, Zadnik et al. (2006) reported that emmetropic Native Americans have flatter corneas, longer eyes and lower powered lenses compared to all other ethnic groups and that Hispanic emmetropic children have longer eyes and flatter corneas compared with Caucasian children. Ojaimi et al. (2005b) also found shorter axial lengths and deeper anterior chambers in Caucasian children in comparison to a group of mixed ethnicities,
In conclusion, genetic differences are likely to be responsible for the ocular differences that we observed between our Chinese- and Indian-derived rhesus monkeys. These differences could potentially provide insights into the ethnic differences that are observed in humans and facilitate the identification of genetic markers associated with refractive errors. However, in light of the observed biometric differences caution should be used when pooling data from monkeys from different colonies and/or different subspecies groups.
Acknowledgments
Thanks to Dr Ying-Sheng Hu for her assistance with the statistical analyses.
Supported by National Eye Institute Grants RO1 EY03611 and P30 EY07551 and funds from the UH Foundation and Vision CRC, Sydney Australia.
Footnotes
Proprietary interest: None
Publisher's Disclaimer: This is a PDF file of an unedited manuscript that has been accepted for publication. As a service to our customers we are providing this early version of the manuscript. The manuscript will undergo copyediting, typesetting, and review of the resulting proof before it is published in its final citable form. Please note that during the production process errors may be discovered which could affect the content, and all legal disclaimers that apply to the journal pertain.
References
- Batschelet E. Statistical methods for the analysis of problems in animal orientation and certain biological rhythms. Washington: American Institute of Biological Sciences; 1965. [Google Scholar]
- Bear JC. Epidemiology and Genetics of Refractive Anomalies. In: Grosvenor T, Flom MC, editors. Refractive Anomalies: Research and clinical applications. Stoneham, MA: Butterworth-Heinemann; 1991. pp. 57–80. [Google Scholar]
- Bennett AG, Rabbetts RB. The Schematic Eye. In: Bennett AG, Rabbetts RB, editors. Clinical Visual Optics. London: Butterworths; 1989. pp. 249–274. [Google Scholar]
- Champoux M, Higley JD, Suomi SJ. Behavioral and physiological characteristics of Indian and Chinese-Indian hybrid rhesus macaque infants. Developmental Psychobiology. 1997;31(1):49–63. [PubMed] [Google Scholar]
- Champoux M, Kriete MF, Higley JD, Suomi SJ. CBC and Serum Chemistry Differences Between Indian-Derived and Chinese-Indian Hybrid Rhesus Monkeys Infants. American Journal of Primatology. 1996;79:79–84. doi: 10.1002/(SICI)1098-2345(1996)39:1<79::AID-AJP6>3.0.CO;2-P. [DOI] [PubMed] [Google Scholar]
- Champoux M, Suomi SJ, Schneider ML. Temperament differences between captive Indian and Chinese-Indian hybrid rhesus macaque neonates. Laboratory Animal Science. 1994;44(4):351–357. [PubMed] [Google Scholar]
- Clarke MR, O’Neil JA. Morphometric comparison of Chinese-origin and Indian-derived rhesus monkeys (Macaca mulatta) American Journal of Primatology. 1999;47(4):335–346. doi: 10.1002/(SICI)1098-2345(1999)47:4<335::AID-AJP5>3.0.CO;2-Y. [DOI] [PubMed] [Google Scholar]
- Garner LF. Calculation of the radii of curvature of the crystalline lens surfaces. Ophthalmic & Physiological Optics. 1997;17(1):75–80. [PubMed] [Google Scholar]
- Garner LF, Meng CK, Grosvenor TP, Mohidin N. Ocular dimensions and refractive power in Malay and Melanesian children. Ophthalmic & Physiological Optics. 1990;10(3):234–238. [PubMed] [Google Scholar]
- Glickstein M, Millodot M. Retinoscopy and eye size. Science. 1970;168(931):605–606. doi: 10.1126/science.168.3931.605. [DOI] [PubMed] [Google Scholar]
- Goss DA, Hampton MJ, Wickham MG. Selected review on genetic factors in myopia. Journal of the American Optometric Association. 1988;59(11):875–884. [PubMed] [Google Scholar]
- Guggenheim JA, Erichsen JT, Hocking PM, Wright NF, Black R. Similar genetic susceptibility to form-deprivation myopia in three strains of chicken. Vision Research. 2002;42(25):2747–2756. doi: 10.1016/s0042-6989(02)00383-8. [DOI] [PubMed] [Google Scholar]
- Harris WF. Algebra of sphero-cylinders and refractive errors, and their means, variance, and standard deviation. American Journal of Optometry and Physiological Optics. 1988;65(10):794–802. doi: 10.1097/00006324-198810000-00003. [DOI] [PubMed] [Google Scholar]
- Henderson AR. The bootstrap: a technique for data-driven statistics. Using computer-intensive analyses to explore experimental data. Clinica Chimica Acta. 2005;359(1–2):1–26. doi: 10.1016/j.cccn.2005.04.002. [DOI] [PubMed] [Google Scholar]
- Hu DN. Twin study on myopia. Chinese Medical Journal. 1981;94(1):51–55. [PubMed] [Google Scholar]
- Hung LF, Crawford ML, Smith EL., III Spectacle lenses alter eye growth and the refractive status of young monkeys. Nature Medicine. 1995;1(8):761–765. doi: 10.1038/nm0895-761. [DOI] [PubMed] [Google Scholar]
- Kee CS, Hung LF, Qiao Y, Habib A, Smith EL., III Prevalence of astigmatism in infant monkeys. Vision Research. 2002;42(11):1349–1359. doi: 10.1016/s0042-6989(02)00060-3. [DOI] [PubMed] [Google Scholar]
- Kleinstein RN, Jones LA, Hullett S, Kwon S, Lee RJ, Friedman NE, Manny RE, Mutti DO, Yu JA, Zadnik K. Refractive error and ethnicity in children. Archives of Ophthalmology. 2003;121(8):1141–1147. doi: 10.1001/archopht.121.8.1141. [DOI] [PubMed] [Google Scholar]
- Knobloch WH, Leavenworth NM, Bouchard TJ, Eckert ED. Eye findings in twins reared apart. Ophthalmic Paediatrics and Genetics. 1985;5(1–2):59–66. doi: 10.3109/13816818509007856. [DOI] [PubMed] [Google Scholar]
- McBrien NA, Adams DW. A longitudinal investigation of adult-onset and adult-progression of myopia in an occupational group. Refractive and biometric findings. Investigative Ophthalmology & Visual Science. 1997;38(2):321–333. [PubMed] [Google Scholar]
- Miller EM. Reported myopia in opposite sex twins: a hormonal hypothesis. Optometry and Vision Science. 1995;72(1):34–36. doi: 10.1097/00006324-199501000-00007. [DOI] [PubMed] [Google Scholar]
- Mose LE, Gale LC, Altmann J. Methods for analysis of unbalanced, longitudinal, growth data. American Journal of Primatology. 1992;28:49–59. doi: 10.1002/ajp.1350280105. [DOI] [PubMed] [Google Scholar]
- Mutti DO, Mitchell GL, Moeschberger ML, Jones LA, Zadnik K. Parental myopia, near work, school achievement, and children’s refractive error. Investigative Ophthalmology & Visual Science. 2002;43(12):3633–3640. [PubMed] [Google Scholar]
- Mutti DO, Zadnik K, Adams AJ. A video technique for phakometry of the human crystalline lens. Investigative Ophthalmology & Visual Science. 1992;33(5):1771–1782. [PubMed] [Google Scholar]
- Mutti DO, Zadnik K, Adams AJ. Myopia. The nature versus nurture debate goes on. Investigative Ophthalmology & Visual Science. 1996;37(6):952–957. [PubMed] [Google Scholar]
- Naiglin L, Clayton J, Gazagne C, Dallongeville F, Malecaze F, Calvas P. Familial high myopia: evidence of an autosomal dominant mode of inheritance and genetic heterogeneity. Annales de Génétique. 1999;42(3):140–146. [PubMed] [Google Scholar]
- Naiglin L, Gazagne C, Dallongeville F, Thalamas C, Idder A, Rascol O, Malecaze F, Calvas P. A genome wide scan for familial high myopia suggests a novel locus on chromosome 7q36. Journal of Medical Genetics. 2002;39(2):118–124. doi: 10.1136/jmg.39.2.118. [DOI] [PMC free article] [PubMed] [Google Scholar]
- Norton TT, Siegwart JT., Jr Animal models of emmetropization: matching axial length to the focal plane. Journal of the American Optometric Association. 1995;66(7):405–414. [PubMed] [Google Scholar]
- Ojaimi E, Morgan IG, Robaei D, Rose KA, Smith W, Rochtchina E, Mitchell P. Effect of stature and other anthropometric parameters on eye size and refraction in a population-based study of Australian children. Investigative Ophthalmology & Visual Science. 2005a;46(12):4424–4429. doi: 10.1167/iovs.05-0077. [DOI] [PubMed] [Google Scholar]
- Ojaimi E, Rose KA, Morgan IG, Smith W, Martin FJ, Kifley A, Robaei D, Mitchell P. Distribution of ocular biometric parameters and refraction in a population-based study of Australian children. Investigative Ophthalmology & Visual Science. 2005b;46(8):2748–2754. doi: 10.1167/iovs.04-1324. [DOI] [PubMed] [Google Scholar]
- Paluru P, Ronan SM, Heon E, Devoto M, Wildenberg SC, Scavello G, Holleschau A, Makitie O, Cole WG, King RA, Young TL. New locus for autosomal dominant high myopia maps to the long arm of chromosome 17. Investigative Ophthalmology & Visual Science. 2003;44(5):1830–1836. doi: 10.1167/iovs.02-0697. [DOI] [PubMed] [Google Scholar]
- Puk O, Dalke C, Favor J, de Angelis MH, Graw J. Variations of eye size parameters among different strains of mice. Mammalian genome : official journal of the International Mammalian Genome Society. 2006;17 (8):851–857. doi: 10.1007/s00335-006-0019-5. [DOI] [PubMed] [Google Scholar]
- Rosenfield M, Gilmartin B. Myopia and nearwork: causation or merely association? In: Rosenfield M, Gilmartin B, editors. Myopia and nearwork. Oxford: Butterworth-Heinemann; 1998. pp. 193–212. [Google Scholar]
- Saw SM, Chua WH, Hong CY, Wu HM, Chia KS, Stone RA, Tan D. Height and its relationship to refraction and biometry parameters in Singapore Chinese children. Investigative Ophthalmology & Visual Science. 2002;43(5):1408–1413. [PubMed] [Google Scholar]
- Schmid K, Wildsoet C. Breed- and gender-dependent differences in eye growth and form deprivation responses in chick. Journal of Comparative Physiology. A, Sensory, Neural, and Behavioral physiology. 1996;178(4):551–561. doi: 10.1007/BF00190185. [DOI] [PubMed] [Google Scholar]
- Shammas HJ, Dunne S, Fisher YL. Three-dimensional Ultrasound Tomography of the Eye. Ontario: NovaCoast Publishing; 1998. p. 214. [Google Scholar]
- Smith DG, McDonough J. Mitochondrial DNA variation in Chinese and Indian rhesus macaques (Macaca mulatta) American Journal of Primatology. 2005;65(1):1–25. doi: 10.1002/ajp.20094. [DOI] [PubMed] [Google Scholar]
- Smith EL., III . Environmentally induced refractive errors in animals. In: Rosenfield M, Gilmartin B, editors. Myopia and Nearwork. Oxford, UK: Butterworth-Heinemann; 1998. pp. 57–90. [Google Scholar]
- Smith EL, III, Hung LF. The role of optical defocus in regulating refractive development in infant monkeys. Vision Research. 1999;39(8):1415–1435. doi: 10.1016/s0042-6989(98)00229-6. [DOI] [PubMed] [Google Scholar]
- Sorsby A, Leary GA, Fraser GR. Family studies on ocular refraction and its components. Journal of Medical Genetics. 1966;3(4):269–273. doi: 10.1136/jmg.3.4.269. [DOI] [PMC free article] [PubMed] [Google Scholar]
- Sperduto R, Siegel D, Roberts J. Prevalence of myopia in the United States. Archives of Ophthalmology. 1983;101:405–407. doi: 10.1001/archopht.1983.01040010405011. [DOI] [PubMed] [Google Scholar]
- Stone RA, Lin T, Desai D, Capehart C. Photoperiod, early post-natal eye growth, and visual deprivation. Vision Research. 1995;35(9):1195–1202. doi: 10.1016/0042-6989(94)00232-b. [DOI] [PubMed] [Google Scholar]
- Tay MT, Au Eong KG, Ng CY, Lim MK. Myopia and educational attainment in 421,116 young Singaporean males. Annals of the Academy of Medicine, Singapore. 1992;21(6):785–791. [PubMed] [Google Scholar]
- Teikari J, Koskenvuo M, Kaprio J, O’Donnell J. Study of gene-environment effects on development of hyperopia: a study of 191 adult twin pairs from the Finnish Twin Cohort Study. Acta Geneticae Medicae et Gemellologiae. 1990;39(1):133–136. doi: 10.1017/s0001566000005651. [DOI] [PubMed] [Google Scholar]
- Teikari J, O’Donnell JJ, Kaprio J, Koskenvuo M. Genetic and environmental effects on oculometric traits. Optometry and Vision Science. 1989;66(9):594–599. doi: 10.1097/00006324-198909000-00005. [DOI] [PubMed] [Google Scholar]
- Teikari JM, O’Donnell J, Kaprio J, Koskenvuo M. Impact of heredity in myopia. Human Heredity. 1991;41(3):151–156. doi: 10.1159/000153994. [DOI] [PubMed] [Google Scholar]
- Teikari JM, O’Donnell JJ. Astigmatism in 72 twin pairs. Cornea. 1989;8(4):263–266. [PubMed] [Google Scholar]
- Troilo D, Li T, Glasser A, Howland HC. Differences in eye growth and the response to visual deprivation in different strains of chicken. Vision Research. 1995;35(9):1211–1216. doi: 10.1016/0042-6989(94)00230-j. [DOI] [PubMed] [Google Scholar]
- Wallman J, Winawer J. Homeostasis of eye growth and the question of myopia. Neuron. 2004;43(4):447–468. doi: 10.1016/j.neuron.2004.08.008. [DOI] [PubMed] [Google Scholar]
- Wildsoet CF. Active emmetropization--evidence for its existence and ramifications for clinical practice. Ophthalmic & Physiological Optics. 1997;17(4):279–290. [PubMed] [Google Scholar]
- Wong TY, Foster PJ, Johnson GJ, Klein BE, Seah SK. The relationship between ocular dimensions and refraction with adult stature: the Tanjong Pagar Survey. Investigative Ophthalmology & Visual Science. 2001;42(6):1237–1242. [PubMed] [Google Scholar]
- Young TL, Atwood LD, Ronan SM, Dewan AT, Alvear AB, Peterson J, Holleschau A, King RA. Further refinement of the MYP2 locus for autosomal dominant high myopia by linkage disequilibrium analysis. Ophthalmic Genetics. 2001;22(2):69–75. doi: 10.1076/opge.22.2.69.2233. [DOI] [PubMed] [Google Scholar]
- Young TL, Ronan SM, Alvear AB, Wildenberg SC, Oetting WS, Atwood LD, Wilkin DJ, King RA. A second locus for familial high myopia maps to chromosome 12q. American Journal of Human Genetics. 1998a;63(5):1419–1424. doi: 10.1086/302111. [DOI] [PMC free article] [PubMed] [Google Scholar]
- Young TL, Ronan SM, Drahozal LA, Wildenberg SC, Alvear AB, Oetting WS, Atwood LD, Wilkin DJ, King RA. Evidence that a locus for familial high myopia maps to chromosome 18p. American Journal of Human Genetics. 1998b;63(1):109–119. doi: 10.1086/301907. [DOI] [PMC free article] [PubMed] [Google Scholar]
- Zadnik K, Mutti DO, Mitchell GL, Jones LA, Manny RE, Kleinstein RN, Cotter SA, Twelker JD. Ocular components in emmetropic children as a function of ethnicity. Ophthalmic & Physiological Optics. 2006;26(S1):25. [Google Scholar]
- Zhang YP, Shi LM. Phylogenetic relationships of macaques as inferred from restriction endonuclease analysis of mitochondrial DNA. Folia Primatologica; International Journal of Primatology. 1993;60(1–2):7–17. doi: 10.1159/000156671. [DOI] [PubMed] [Google Scholar]
- Zhou G, Williams RW. Eye1 and Eye2: gene loci that modulate eye size, lens weight, and retinal area in the mouse. Investigative Ophthalmology & Visual Science. 1999a;40(5):817–825. [PubMed] [Google Scholar]
- Zhou G, Williams RW. Mouse models for the analysis of myopia: an analysis of variation in eye size of adult mice. Optometry and Vision Science. 1999b;76(6):408–418. doi: 10.1097/00006324-199906000-00021. [DOI] [PubMed] [Google Scholar]
- Zylbermann R, Landau D, Berson D. The influence of study habits on myopia in Jewish teenagers. Journal of Pediatric Ophthalmology and Strabismus. 1993;30(5):319–322. doi: 10.3928/0191-3913-19930901-12. [DOI] [PubMed] [Google Scholar]