

Abstract
Binge-like exposure to ethanol early in development results in neurotoxic impairments throughout the brain, including the cerebellum and brainstem. Rats exposed to ethanol, during a period of time commensurate with the human third trimester, also show deficits in classical eyeblink conditioning (EBC), a cerebellar-dependent associative learning procedure. The relationship between ethanol-mediated EBC deficits and the intensity of the unconditioned stimulus (US) was explored in the current study. Neonatal rats were intubated and infused with ethanol (EtOH rats), sham-intubated and given no ethanol (SI rats), or reared as unhandled controls (UC rats). As adults, all rats underwent 10 days of 350 ms delay eyeblink conditioning with a tone conditioned stimulus (CS) and one of three co-terminating periorbital shock US. The frequency and topography of the conditioned eyeblink response (CR) were impaired in EtOH rats relative to UC rats. EtOH rats produced fewer CRs, with longer onset latencies, at all US intensities. In contrast, CR amplitude was impaired in EtOH rats at the highest US intensity only. Following conditioning, the unconditioned eyeblink response (UR) was analyzed in subsets of rats from each treatment group at five US intensities. Early ethanol exposure did not impair UR peak amplitude. The deficits in CR production are proposed to result from ethanol-mediated damage within specific regions of the EBC neural circuit.
Keywords: Classical eyeblink conditioning, Ethanol, Conditioned response, Cerebellum, Unconditioned stimulus, Rat
1. Introduction
Women who consume alcohol during pregnancy run the risk of delivering babies afflicted with a spectrum of mental and physical birth deficits. Fetal alcohol syndrome (FAS)—the most thoroughly characterized and diagnosed fetal alcohol spectrum disorder (FASD)—has a birth prevalence of approximately 0.5 to 2 per 1000 live births (May and Gossage, 2001). FAS is typically characterized by abnormal facial features, growth retardation, and central nervous system dysfunction (Bertrand et al., 2004; Hoyme et al., 2005). In addition, children with FAS often suffer from low IQ, poor learning and memory, impairments in visuospatial and motor skills, and difficulties with speech and hearing (Olson et al., 1998; Streissguth et al., 1996).
The teratogenic effects of prenatal alcohol exposure can vary considerably depending on the dose, pattern, and timing of exposure (Hanningan, 1996). Alcohol consumed during the first trimester typically leads to facial abnormalities and deficits in the migration and organization of neurons throughout the brain. Alcohol consumption during the second trimester is associated with neuronal abnormalities in the neocortex and hippocampus. Alcohol consumed during the third trimester leads to decreased fetal growth and abnormalities in the proliferation, generation, and migration of cerebellar Purkinje and granule cells (Clarren, 1986; Renwick and Asker, 1983; Roebuck et al., 1998).
Over the last two decades, an animal model has been developed for investigating the neurotoxic effects of alcohol on the developing brain, particularly the cerebellum. Neonatal rats—whose cerebellum in the weeks following birth is roughly equivalent to the human cerebellum during the third trimester (Bayer et al., 1993; Goodlett and Johnson, 1999)—are exposed to varying concentrations of ethanol during the “brain growth spurt” period of early postnatal life. The extent of cerebellar dysfunction depends on the interaction of two factors—developmental timing of ethanol exposure and the resulting blood alcohol concentration (BAC). Developmentally, the greatest levels of cerebellar neurotoxicity occur when ethanol is administered over postnatal days (PD) 4–9 (Altman, 1972; Goodlett et al., 1998). Once administered, appreciable cerebellar cellular damage only occurs when daily peak blood alcohol concentrations exceed 200 mg/dl (Bonthius and West, 1991; Goodlett et al., 1998; Napper and West, 1993; Thomas et al., 1998).
Exposure to ethanol early in development also produces deficits in associative learning—deficits which persist through adulthood. The cerebellar and brainstem areas damaged by alcohol are the same brain regions required for the acquisition and expression of classical eyeblink conditioning (EBC). In this learning protocol, a tone or light conditioned stimulus (CS) is repeatedly paired with a mildly aversive unconditioned stimulus (US), such as a periorbital electrical shock. The US evokes a reflexive, unconditioned eyeblink response (UR). After repeated CS-US pairings, subjects learn to produce a conditioned eyeblink response (CR). In well-trained subjects, the CR peak amplitude latency coincides with the onset of the US.
The neural circuitry mediating EBC has been well-characterized over the last three decades (reviewed in Lavond, 2002; Medina et al., 2000; Steinmetz, 2000; Thompson, 2005). CS sensory information is relayed to the cerebellum through mossy fibers in the basilar pontine nuclei (Steinmetz et al., 1987; Steinmetz and Sengelaub, 1992), while US sensory information is relayed to the cerebellum via climbing fiber neurons in the inferior olive complex (McCormick et al., 1985; Sears and Steinmetz, 1991). Associative synaptic plasticity is thought to occur in neurons that receive convergent CS-US inputs—in particular, neurons in the interpositus (IP) nucleus and Purkinje cells in the cerebellar cortex.
Rat pups exposed to binge-like levels of ethanol across PD 4–9 are impaired in eyeblink conditioning, both as weanlings (Stanton and Goodlett, 1998; Tran et al., 2005) and adult rats (Green et al., 2002a; Green et al., 2002b; Green et al., 2000). In addition to their behavioral deficits, adult rats exposed as neonates to alcohol have up to 50% fewer cerebellar deep nuclear neurons (Green et al., 2002b), as well as a corresponding reduction in learning-related neural activity in the IP (Green et al., 2002a). One issue that makes interpretation of these results potentially problematic, however, is that the intensity of the periorbital shock US was independently titrated for each subject in order to produce a defined conditioned response—making it difficult to establish if US intensity was a major factor in determining the ethanol-mediated conditioning deficits.
In terms of the unconditioned eyeblink response, Stanton & Goodlett (1998) reported no differences in UR amplitude between ethanol-exposed and control weanling rats. Moreover, adult rats exposed to ethanol as neonates produced approximately the same percentage of spontaneous blinks during unpaired eyeblink conditioning, and at the same rate, as control animals (Green et al., 2000). Accordingly, early ethanol exposure has been posited to selectively impair cerebellar associative learning areas and not blink-production circuitry. To date, however, the effects of neonatal ethanol exposure on UR amplitude have not been systematically explored in adult rats.
In the current study, neonatal rats were exposed to one of three treatment protocols across PD 4–9. Ethanol-exposed (EtOH) rats were intubated and infused with 5 g/kg of alcohol twice daily; sham-intubated (SI) rats were intubated but received no ethanol; and unhandled control (UC) rats were left undisturbed. As adults, all rats experienced 10 days of delay eyeblink conditioning at one of three US shock intensities (1.0, 1.5, or 2.0 mA). A subset of rats from each group received an additional five days of conditioning at five different US intensities (1.0, 1.5, 2.0, 3.0, and 4.0 mA). The latter was undertaken to assess and compare the amplitude of UR blinks, during US-alone trials, among the three neonatal treatment groups.
The experimental aims of this study were two-fold. The primary sensory processes associated with US intensity were examined to better understand how they interact and contribute to the frequency, magnitude, and timing of the blink CR—both within and between neonatal treatment groups. The aim was to assess the effects, if any, of analyzing ethanol-mediated learning deficits in subjects for whom the optimal US intensity for eliciting a blink was individually set prior to the start of conditioning (Green et al., 2002a; Green et al., 2000; Green et al., 2002b; Tran et al., 2005). The second aim was to confirm (systematically, with multiple US intensities) that the deficits exhibited by adult rats exposed to ethanol as neonates are associative and cerebellar-dependent, and are not due to motor impairments in the UR production circuit.
2. Results
2.1. Blood Alcohol Concentration
Blood samples were analyzed from 28 ethanol-exposed rat pups on PD 4. Their mean (± SE) blood alcohol concentration was 334.0 ± 10.5 mg/dl.
2.2. Conditioned Response Analysis
Statistical analyses were applied to three elements of the learned motor response. CR frequencies were based on the percentage of CRs produced during all CS-US paired trials. CR amplitudes and latencies were measured during CS-alone trials in order to avoid contamination from the shock artifact and performance of the UR.
CR Frequency
Acquisition of eyeblink conditioning was analyzed across all 10 days of conditioning, with two between-subjects factors: neonatal treatment (UC, SI, and EtOH rats; Figs. 1A–C) and US intensity (1.0, 1.5, and 2.0 mA; Figs. 1D–F). A mixed 3 × 3 × 10 repeated measures ANOVA revealed a significant treatment effect, F(2, 77) = 5.63, p < 0.01, but no US intensity or treatment × intensity interaction effect. The conditioning day effect was also significant, F(9, 693) = 51.68, p < 0.001. Tukey-Kramer post hoc analysis of the treatment effect indicated that UC rats produced significantly more CRs than EtOH rats (p < 0.05). The two control groups did not differ from each other. The data indicate that the number of blink CRs increased, on average, across each of the 10 days of conditioning, and that neonatal treatment, but not shock intensity, significantly impacted CR frequency. Fig. 2 depicts an overall summary of CR performance—collapsed across the three US shock intensities—among UC, SI, and EtOH rats. The asterisks and section sign signify that significantly more CRs were produced by UC rats than EtOH or SI rats, respectively, on 9 of the 10 conditioning days, as revealed by a series of one-way ANOVAs.
Fig. 1.

Conditioned eyeblink response (CR) acquisition curves in three treatment groups at three periorbital shock intensities. Percentage of CRs (mean ± SE) in delay eyeblink conditioning as a function of neonatal treatment (A–C) and unconditioned stimulus intensity (D–F).
Fig. 2.
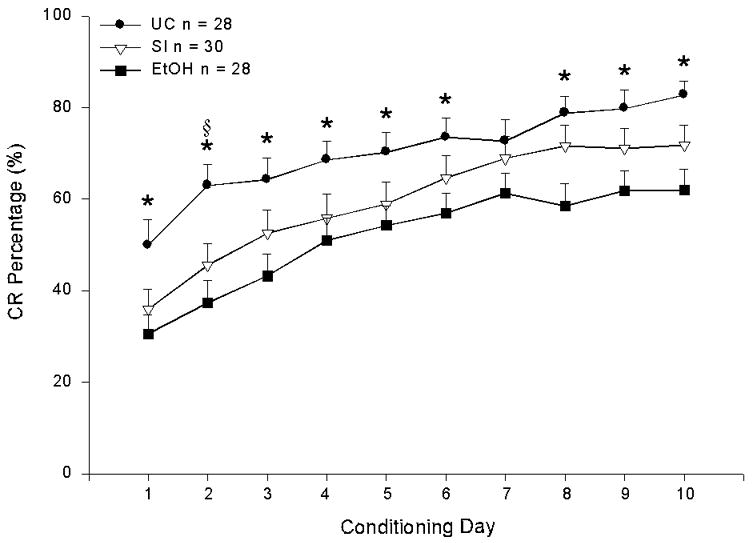
Neonatal ethanol exposure impaired classical eyeblink conditioning in adult rats. Percentage of conditioned responses (mean ± SE) over 10 days of delay eyeblink conditioning, collapsed across the three unconditioned stimulus intensities.
A statistically significant difference in percent CR was not found, somewhat surprisingly, between SI and EtOH rats in the repeated measures ANOVA outlined above. Further analysis of CR frequency using a 3 × 3 between-subjects ANOVA did reveal a significant treatment × intensity interaction effect, F(4, 851) = 4.07, p < 0.01. Tukey-Kramer post hoc analysis of the treatment effect indicated that significantly more blink CRs were produced by UC than SI rats, by UC than EtOH rats and, importantly, by SI than EtOH rats. Post hoc analysis of the US intensity effect revealed that rats conditioned with the 1.5 and 2.0 mA US produced significantly more blink CRs than rats conditioned with the 1.0 mA US. The number of blink CRs produced by rats conditioned with the 1.5 and 2.0 mA US were not significantly different.
Each neonatal treatment group (Figs. 1A–C) was analyzed next using a mixed 3 × 10 repeated measures ANOVA, with US intensity as the between-subjects factor. The main effect of shock intensity was not significant. Dropping the repeated measures, the data was reanalyzed using a single factor ANOVA. This time, there was a significant US intensity effect for all three treatment groups: UC, F(2, 277) = 6.78, p < 0.01; SI, F(2, 297) = 3.25, p < 0.05, and EtOH, F(2, 277) = 8.19, p < 0.001. Post hoc analysis of the intensity effect revealed that UC and EtOH rats produced significantly more CRs with the highest than the lowest shock intensity (Figs. 1A & C). For SI rats, significantly more CRs were produced with the 1.5 mA than the 1.0 mA US only (Fig. 1B).
Using neonatal treatment as the between-subjects factor, a mixed 3 × 10 repeated measures ANOVA was calculated at each US intensity (Figs. 1D–F). The treatment effect was significant in rats conditioned with the 1.0 mA US, F(2, 26) = 4.10, p < 0.05, and the 2.0 mA US, F(2, 25) = 3.58, p < 0.05. The conditioning day main effect, but not the treatment × day interaction, was significant at all three US intensities (p < 0.0001). Post hoc analysis of the treatment effect, in rats conditioned with the 1.0 and 2.0 mA US, revealed significantly higher CR frequencies in UC rats than EtOH rats. A similar, though non-significant, pattern was seen in rats conditioned with the 1.5 mA US. A closer examination of CR frequency in the 1.0 mA rats—calculating one-way ANOVAs on each conditioning day—indicated that UC rats produced significantly more CRs than EtOH rats on conditioning days 1, 2, 8, and 10 (asterisks in Fig. 1D). The same analysis on the 2.0 mA rats found that UC rats produced significantly more CRs than SI rats on day 1, than both SI and EtOH rats on day 3, and than EtOH rats on day 9 (section signs and asterisks in Fig. 1F).
On average, all three treatment groups produced more CRs as the US intensity was increased. Nevertheless, EtOH rats generated significantly fewer CRs than UC rats—from the first days of conditioning—with the lowest and highest shock intensity. Acquisition rates for SI rats were intermediate to those observed in UC and EtOH rats.
CR Amplitude
Mean and peak CR amplitudes, averaged across the 10 days of conditioning, were analyzed using a between-subjects 3 × 3 ANOVA. A significant treatment × intensity interaction was achieved for both CR mean amplitude, F(4, 851) = 3.93, p < 0.01 and CR peak amplitude, F(4, 851) = 2.59, p < 0.05. Tukey-Kramer post hoc analysis of the interaction effect indicated that the highest shock intensity always produced the largest amplitude conditioned eyeblink (p < 0.05). In addition, CR mean amplitude, but not peak amplitude, was significantly larger in UC than EtOH rats.
All three neonatal treatment groups were individually analyzed in order to determine if US intensity affected CR amplitude levels. A single factor ANOVA revealed a significant intensity effect on CR mean and peak amplitude in UC rats, F(2, 277) = 9.49, p < 0.0001 and F(2, 277) = 9.33, p < 0.0001; and SI rats, F(2, 297) = 4.79, p < 0.05 and F(2, 297) = 3.14, p < 0.05; but not EtOH rats. Post-hoc analysis of the intensity effect found that both control groups displayed larger amplitude blink CRs with higher US shock intensities. Next, the effect of neonatal treatment on CR amplitude was analyzed at each US intensity (see Figs. 3A & B). The results for both mean and peak CR amplitude were the same—a significant treatment effect in rats conditioned with the 2.0 mA US (mean amplitude, F(2, 277) = 8.75, p < 0.001; peak amplitude, F(2, 277) = 5.34, p < 0.01), but not the two lower US intensities. Post-hoc analysis of the treatment effect revealed that both UC and SI rats produced significantly higher CR mean amplitudes than EtOH rats (Fig. 3A, far right). CR peak amplitudes, on the other hand, were significantly higher in UC than EtOH rats only (Fig. 3B, far right).
Fig. 3.
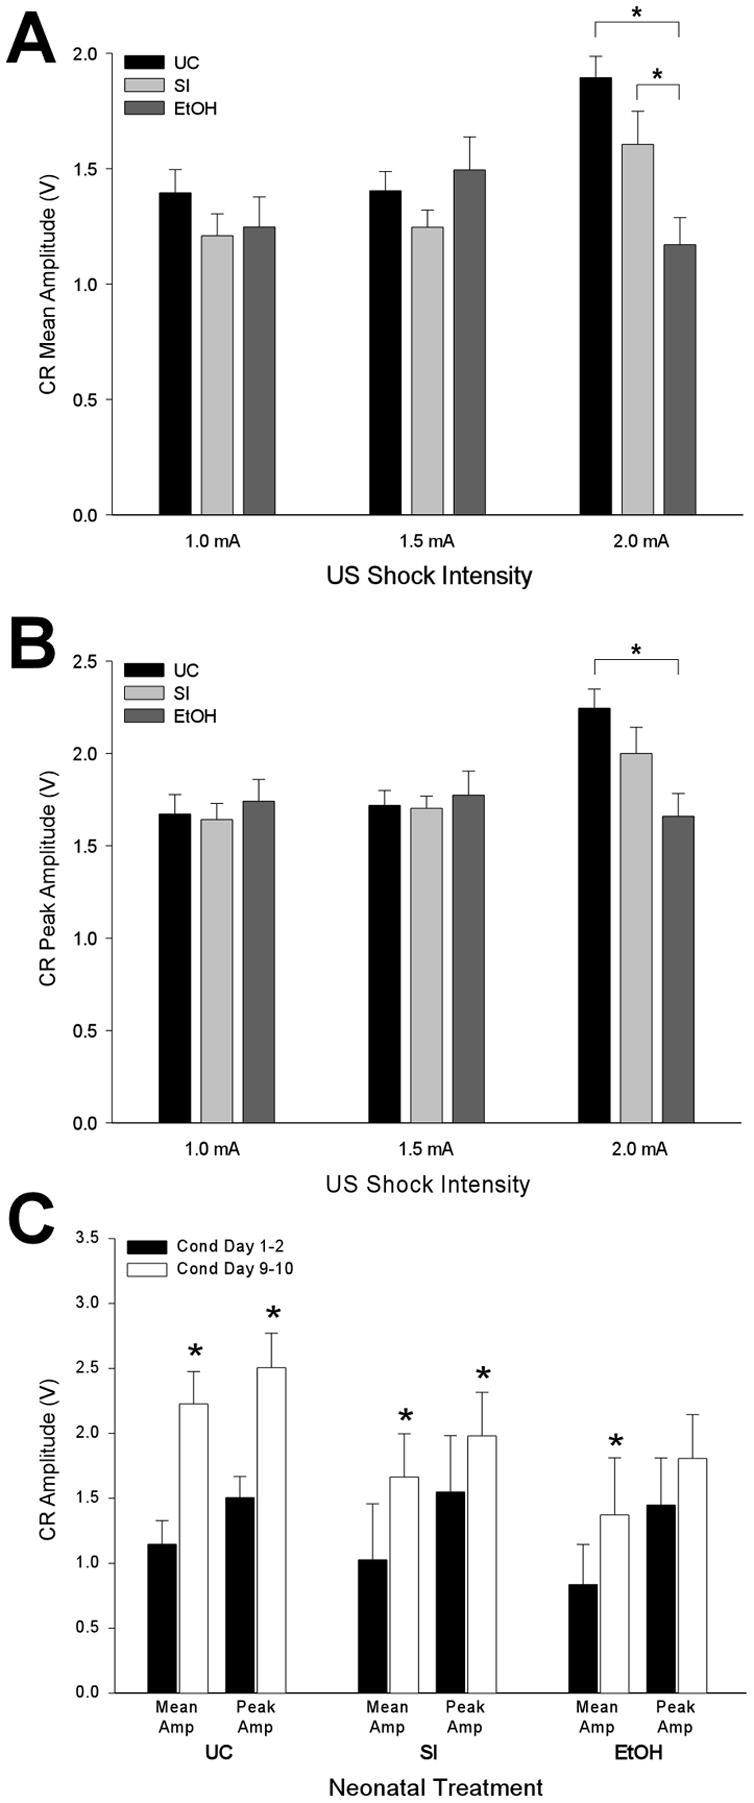
Ethanol-exposure impaired conditioned eyeblink response (CR) amplitudes with the highest but not lower unconditioned stimulus (US) intensities. CR mean (A) and peak (B) amplitudes (± SE) are presented as a function of neonatal treatment and US intensity. (C) CR mean and peak amplitudes (± SE) at the beginning (Cond Day 1–2; black bars) and end (Cond Day 9–10; white bars) of conditioning in rats trained with the 2.0 mA US.
To understand if the differences in CR amplitude (for rats trained with the 2.0 mA US) are present from the outset or arise over the course of training, mean and peak CR amplitudes were analyzed and contrasted across the first two and last two days of conditioning. Early in conditioning, a single factor (Treatment) ANOVA was non-significant for both CR mean and peak amplitude, indicating amplitude levels were comparable among the three treatment groups. Conversely, by the end of training significant differences in CR mean amplitude, but not peak amplitude, existed among the three treatment groups, F(2, 53) = 3.74, p < 0.05. Post-hoc analysis found CR mean amplitudes were significantly higher in UC than EtOH rats. The same data set was reanalyzed in order to compare CR amplitudes within, rather than between, the three neonatal treatment groups. Specifically, CR mean and peak amplitudes recorded early in training (average of conditioning days 1 & 2 for each subject) were analyzed and contrasted with the same two metrics at the end of training (average of conditioning days 9 & 10 for each subject). Paired t-tests revealed significant increases in CR mean amplitude across training for UC rats, t(8) = 4.99, p < 0.01, SI rats, t(9) = 4.80, p < 0.001), and EtOH rats t(8) = 2.39, p < 0.05 (Fig. 3C). Significant increases in CR peak amplitude across training were limited to UC rats, t(8) = 3.93, p < 0.01, and SI rats, t(9) = 2.37, p < 0.05 (Fig. 3C).
Ethanol-exposed rats were the only group to not produce larger CR amplitudes with higher intensity periorbital shocks. Only with the highest US intensity were EtOH rats impaired relative to control animals—due to lower learning-dependent increases in CR mean and peak amplitude across the 10 days of conditioning.
CR Latency
CR onset latencies and peak amplitude latencies were analyzed using a between-subjects 3 × 3 ANOVA. A significant treatment × intensity interaction was achieved for both CR onset latency, F(4, 851) = 3.19, p < 0.05, and CR peak latency, F(4, 851) = 6.53, p < 0.001. Tukey-Kramer post hoc analysis of the interaction effect indicated that the shortest CR onset latencies were achieved with the highest US intensity (p < 0.05). Moreover, UC rats had significantly shorter CR onset latencies than SI or EtOH rats. Despite the significant interaction effect, post hoc analysis revealed no significant comparisons with the CR peak latency data.
Each treatment group was analyzed to determine if US intensity affected the conditioned blink’s onset and peak latencies. A single factor AVOVA revealed a significant intensity effect in UC rats for both CR onset latency, F(2, 277) = 7.23, p < 0.001 and CR peak latency, F(2, 277) = 11.26, p < 0.0001. The intensity effect on CR onset latency in EtOH rats was also significant, F(2, 277) = 3.88, p < 0.05. In all cases, post hoc analysis revealed that CR latencies decreased as the shock intensity was increased. There were no significant decreases in CR onset or peak latencies in SI rats as the shock intensity was increased. A single factor ANOVA was calculated next to analyze the effect of neonatal treatment at each US intensity. A significant treatment effect was found for CR onset latency in rats conditioned with the 1.0 mA US, F(2, 287) = 7.47, p < 0.001 and the 2.0 mA US, F(2, 277) = 12.77, p < 0.0001. Neonatal treatment also had a significant effect on CR peak latency in rats conditioned with the 1.5 mA US, F(2, 287) = 4.51, p < 0.05 and the 2.0 mA US, F(2, 277) = 10.94, p < 0.0001. Post-hoc analyses of the treatment effects revealed that UC rats had significantly shorter onset and peak latencies than EtOH rats. Though the difference did not reach statistical significance, UC rats also had shorter CR onset latencies than EtOH rats when trained with the 1.5 mA US.
Averaging across the three shock intensities, a single factor ANOVA revealed a significant treatment effect on CR onset latency, F(2, 857) = 15.18, p < 0.001 (Fig. 4, far left), but not CR peak latency (Fig. 4, far right). Tukey-Kramer post hoc analysis revealed significantly shorter CR onset latencies in UC rats than SI or EtOH rats. All told, CR onset latencies, but not peak latencies, were significantly shorter in UC than EtOH rats. Nevertheless, onset latencies in both groups grew shorter as the intensity of the periorbital shock was incremented upwards.
Fig. 4.
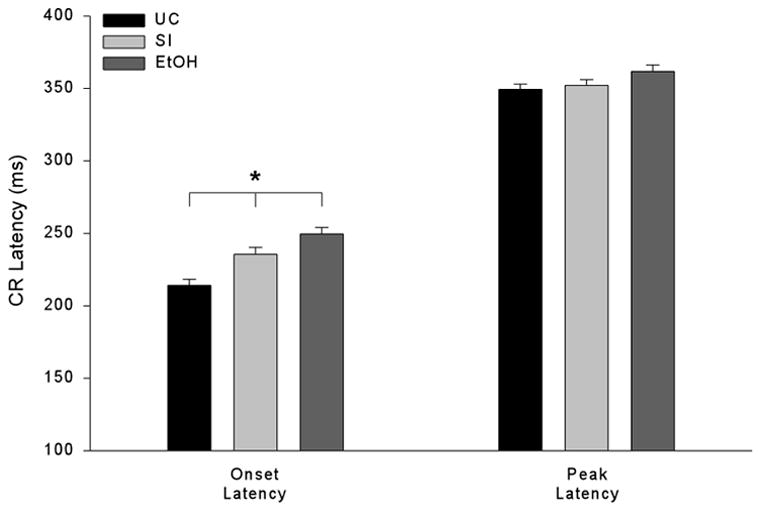
Conditioned eyeblink response (CR) onset latencies, but not peak latencies, were impaired in ethanol-exposed rats. CR onset and peak latencies (± SE) in adult rats, collapsed across the three unconditioned stimulus intensities.
2.3. Unconditioned Response Analysis
UR Amplitude
Unconditioned response amplitudes were analyzed in 29 rats (UC = 10, SI = 10, EtOH = 9) at five US intensities (1.0, 1.5, 2.0, 3.0, and 4.0 mA). The duration of the latter two intensities were shortened from 100 ms to 25 ms and 10 ms, respectively, in order to limit excessive shock-induced movement by the rat. We chose these five combinations of US intensity and duration in part because these parameters are commonly used in rat eyeblink conditioning studies. It is the case, however, that the differences in shock duration prevent a linear analysis of UR peak amplitude across the five shock intensities. Assuming shock energy is approximated by the product of current and duration, the values generated by our five current pulses range from 40 units (4.0 mA × 10 ms) to 200 units (2.0 mA × 100 ms).
A mixed 3 × 5 ANOVA, with UR peak amplitude as the dependent variable (see Fig. 5), revealed no significant treatment, intensity, or interaction effects. Single factor ANOVAs found no significant differences in UR peak amplitude between the three neonatal treatment groups at any US intensity. For ease of illustration, the five shock intensities are presented in sequential order in Fig. 5, with each shock’s total stimulus energy listed beneath. The data indicate that neonatal ethanol exposure did not significantly impair UR production in adult rats at any of the five shock intensities.
Fig. 5.
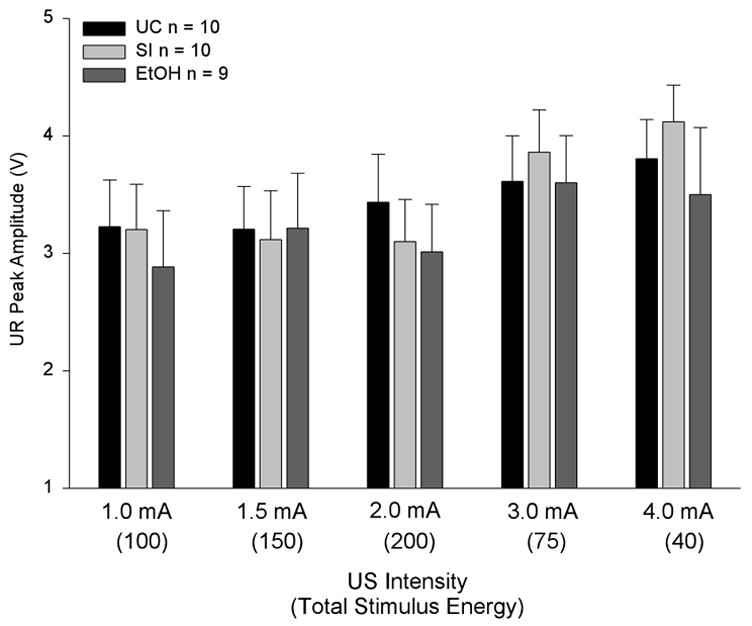
Unconditioned eyeblink response (UR) amplitudes (± SE) were not affected by neonatal ethanol exposure in adult rats. UR peak amplitudes are presented as a function of neonatal treatment and US intensity. Total stimulus energy is listed parenthetically beneath US intensity (see text for details).
3.0 Discussion
Results from the current study provide further evidence that the acquisition of classical eyeblink conditioning is retarded in rats exposed to ethanol early in development (see Fig. 2). Mean and peak CR amplitudes of rats exposed to ethanol were also lower than controls, but only when a high US intensity was used (Figs. 3A–B). Finally, relative to controls, ethanol-exposed rats had shorter CR onset latencies at all three shock intensities (Fig. 4). In spite of its effects on the learned motor response, however, neonatal exposure to ethanol had no discernable impact on UR peak amplitude (Fig. 5).
3.1. The Conditioned Eyeblink Response
Rat neonates exposed to binge-levels of ethanol were impaired in the acquisition of 350 ms delay eyeblink conditioning as adult rats (Fig. 2), a result in line with earlier findings (Green et al., 2002a; Green et al., 2000). On the last day of conditioning, CR frequency in rats conditioned with the lowest intensity (1.0 mA; Fig. 1D) closely matches the averages reported by Green and colleagues: on average, about a 30% difference in percent CRs between UC and EtOH rats. In general, increasing the US intensity produced a proportionally higher frequency of CRs in UC, SI, and EtOH rats (Figs. 1A–C)—albeit the number of CRs produced by UC rats trained with the 1.5 mA US was uncharacteristically low (see Figs. 1A & 1E). At the same time, an ethanol-mediated conditioning deficit was evident at all three shock intensities (Figs. 1D–F). The results indicate that the titration of US intensity for each subject prior to training had no significant impact on the conditioning deficits previously observed in EtOH rats (Green et al., 2002a; Green et al., 2000; Green et al., 2002b; Tran et al., 2005).
In terms of CR amplitude, neonatal ethanol treatment had no significant effect at the two lowest US intensities. Only with the highest shock intensity were both mean and peak CR amplitudes diminished in EtOH rats (Figs. 3A–B). Even with the 2.0 mA rats, however, no treatment-mediated differences in CR mean or peak amplitude were evident early in conditioning. Only at the end of conditioning did significant differences in CR mean amplitude emerge between the three treatment groups. This, despite the fact that all three groups showed significant learning-dependent increases in CR mean amplitude across the 10 days of conditioning (Fig. 3C). Significant increases in CR peak amplitude were limited to UC and SI rats (Fig. 3C). The data suggest that early in conditioning all three groups produced comparable CR amplitude levels. Even later in conditioning, CR amplitude levels remained comparable with the two lower US intensities. Only with the highest US intensity, during the latter conditioning sessions, were EtOH rats unable to produce CR amplitudes on par with UC and SI rats.
CR onset latencies were longer in EtOH rats than UC rats (Fig. 4). Green et al. (2000) found a similar lengthening of CR onset latencies in EtOH rats. Sham-intubated rats had CR onset latencies intermediate to unhandled control and ethanol-exposed rats (Fig. 4). Green et al. (2000) also reported that CR peak latencies were significantly shorter in EtOH rats than UC rats. In the current study, CR peak latencies in EtOH and UC rats were equivalent at the lowest shock intensity. As the US intensity was increased, peak latencies in UC rats decreased, while the EtOH rats’ latencies remained roughly constant. Together with the CR frequency and CR amplitude data, the latency data support the proposition that adult rats exposed to ethanol early in life are impaired in the acquisition of EBC.
What brain deficits may account for the impairments in EBC seen in rats neonatally exposed to alcohol? Several regions of the EBC neural circuit, including the IP, cerebellar cortex, and inferior olive, are known to incur cellular damage as a result of binge-like alcohol exposure. Of the three, the IP plays an especially critical role in classical eyeblink conditioning. Repeated pairings of the CS and US are proposed to modify the efficacy of the mossy fiber-IP synapse, enabling the CS, by itself, to activate the IP and downstream blink motor nuclei. At least a portion of the CS-US associative memory trace underlying EBC is proposed to be located in the anterior dorsolateral region of the IP (Bracha et al., 1998; Clark et al., 1992; Krupa et al., 1993; Skelton, 1988; Steinmetz et al., 1991).
Adult rats exposed to ethanol as neonates have up to 50% fewer IP neurons than controls (Green et al., 2002b; Tran et al., 2005). The degree of depletion corresponds to the peak BAC level in the neonatal rat (Green et al., 2006). EtOH rats also display reduced IP unit activity across training relative to the learning-dependent increases in unit activity observed in control rats (Green et al., 2002a). That is, UC and SI rats display significant increases in IP unit activity, relative to baseline, during the CS-US interstimulus interval by the fifth of 10 days of conditioning. In contrast, EtOH rats are impaired in CR acquisition and, importantly, fail to show significant changes in IP unit activity until the last day of conditioning (Green et al., 2002a). Based on the above, Green (2004) posited that ethanol-mediated depletion of IP neurons is the primary reason EtOH rats are such poor learners—they have fewer IP neurons capable of encoding and driving the blink CR. And yet, although EtOH rats were impaired in the current study, their improvements in learning associated with increased shock intensity were comparable to those observed in the two control groups (see Figs. 1A–C), suggesting that even in EtOH rats, which have fewer total IP neurons, conditioning with higher US intensities engages a higher proportion of those neurons that are available.
In addition to the IP, rat neonates exposed to ethanol also have dramatic reductions in the total estimated number of Purkinje cells in the cerebellar cortex (Goodlett et al., 1998; Pauli et al., 1995; Thomas et al., 1998; Tran et al., 2005), an effect that remains relatively constant across the rat’s life span (Bonthius and West, 1991; Napper and West, 1995). Purkinje cell numbers, relative to untreated controls, are reduced from 20–50%, with some regional differences in the pattern of Purkinje cell depletion. The greatest reductions appear to be concentrated in Larsell’s lobules I–V and VIII–X and the lowest reductions in lobules VI–VII (Light et al., 2002; Pierce et al., 1989; Pierce et al., 1993). Recordings in lobules IX and X suggest that those Purkinje cells that do survive ethanol insult remain physiologically normal (Backman et al., 1998). While the role of cerebellar cortex is not entirely understood as of yet, it clearly plays an important role in EBC, perhaps in the establishment of IP plasticity or as a modulator of CR amplitude and CR timing.
The difficultly in fully understanding cerebellar cortex function is illustrated by two recent experimental studies. The first, by Green and Steinmetz (2005), found Purkinje cells in the cerebellar anterior lobe of rabbits (encompassing lobules I–V) that appear to encode the timing of blink CRs, as assessed by single-unit recording. On the other hand, Nolan and Freeman (2006) report that the global depletion of Purkinje cells throughout the cerebellar cortex in rats, via the immunotoxin OX7-saporin, had no impact on CR timing. Despite the contradictory results, however, it remains likely that deficiencies in cerebellar cortical processing due to ethanol-induced loss of neurons accounts for at least some of the deficits in CR acquisition, amplitude and timing observed in the present and previous studies.
3.2. Sham-intubation
It is important to note that not all impairments in CR production were the direct result of ethanol administration. As in previous work (Green et al., 2000; Green et al., 2002a; Green et al., 2002b; Stanton and Goodlett, 1998; Tran et al., 2005), sham-intubated rats in the present study were mildly impaired, relative to UC rats, in both CR frequency and amplitude. Importantly, the learning deficits in SI rats are not tied to significant reductions in neuronal numbers or abnormal patterns of unit activity in the anterior IP (Green et al., 2002a, 2002b), suggesting that the SI conditioning deficit is likely not mediated by cerebellar mechanisms.
In the present study, CR frequency, as assessed with the repeated measures ANOVA, was not significantly different between SI and EtOH rats. The lack of statistical significance is partly attributable to 3 SI rats that learned exceptionally poorly, producing very few CRs across the 10 days of conditioning. Still, the number of blink CRs produced by the two groups of rats did significantly differ when the analysis was based on the average of all 10 days of conditioning—with a higher mean CR percentage in SI rats than EtOH rats. Similarly, CR amplitude, at the highest US intensity, was significantly higher in SI than EtOH rats (Fig. 3A), a result in line with previous research (Green et al., 2000; Green et al., 2002a; Green et al., 2002b; Stanton and Goodlett, 1998; Tran et al., 2005).
The learning impairments observed in SI rats may be the result of stress effects on the rat pup’s developing brain caused by handling, separation from the dam, or the acute intragastric intubation procedure. Our laboratory has recently examined the effects of neonatal handling and maternal separation on EBC in adult rats, as well as changes in IP neuron number and glucocorticoid receptor (GR) expression (unpublished data; Wilber et al., 2006). Handling and maternal separation across PD 2 to 14 led to increases in corticosterone in all rats. Moreover, male, but not female, rats separated from the dam for 15 or 60 minutes per day were impaired as adults in delay eyeblink conditioning, with those separated for 60 minutes showing significant increases in GR expression in the posterior IP. Neither males nor females showed significant reductions of cerebellar deep nuclei neurons as a result of handling or maternal separation. The data suggest that stress effects surrounding the infusion process can affect later conditioning. Our earlier data, however, suggest that this effect is not mediated through anatomical or physiological impairments in the anterior IP (Green et al., 2002a, 2002b)—the region of IP critical for successful eyeblink conditioning. Instead, the deficits are likely caused by anatomical or physiological impairments in other cerebellar or non-cerebellar areas.
While the stress effects related to intubation and its procedural antecedents can modify the neonatal rat brain, leading to learning deficits in adulthood, it remains unclear why the SI effect is larger in the current study than others. It is possible, for example, that the rats were stressed more in the present study than in previous studies at the time of intubation. Regardless, SI rats clearly acquire and produce CRs at a higher rate and amplitude than EtOH rats (Figs. 2 and 3). As the intubation procedure is identical for both groups, the deleterious effects of ethanol exposure on learning are presumably mediated through cerebellar abnormalities that cannot be explained by the stress effects alone. Thus, we conclude that the SI effect can be separated out from the EtOH effect on the basis of brain areas affected and the magnitude of the behavioral impairment. The data indicate that in future studies we must, nevertheless, strive to minimize stress effects at the time of ethanol administration.
3.3. The Unconditioned Eyeblink Response
Conditioned and unconditioned eyeblink responses rely on the same cranial motor nuclei, nerves, and muscles. CR-related neural activity within IP is relayed through the red nucleus to motoneurons in the accessory abducens and facial nuclei (Holstege et al., 1986). US-related neural activity is relayed from the eye region to the inferior olive and trigeminal nucleus, which in turn has direct and indirect projections to the accessory abducens and facial nuclei (Tamai et al., 1986; Van Ham and Yeo, 1996). At the final stage, the facial nucleus’ seventh nerve innervates the orbicularis oculi (OO) muscle, which regulates the downward motion of the eyelid during conditioned and unconditioned eyeblinks (Gong et al., 2003; Pellegrini and Evinger, 1995).
UR peak amplitude, assessed at five different US intensities, did not differ among adult UC, SI, or EtOH rats (Fig. 5). These results are in line with a previous study which assessed startle responses to the acoustic CS and, separately, UR amplitudes in weanling (PD 23–24) rats (Stanton and Goodlett, 1998). No significant differences in either measure were found among the three neonatal treatment groups. Likewise, non-associative responding—as assessed by explicitly unpaired eyeblink conditioning—was found to be statistically no different in adult rats exposed to ethanol as neonates than control rats (Green et al., 2000).
The present data provide strong evidence that the EBC deficits observed in EtOH rats are not due to impairments in UR production. While the EtOH rats showed deficits in EBC when compared to control rats, they still showed increasing numbers of CRs as the US intensity was increased (Fig. 1C). Equally important, no differences between treatment groups were seen when UR amplitudes were compared across US intensities. Despite the nonlinearity inherent in our design (i.e., higher current intensities presented for shorter durations of time) the two highest US intensities (with the lowest total shock energy) generally resulted in higher amplitude UR blinks than the three lower US intensities for all three groups of rats (Fig. 5). Taken together, the data support the hypothesis that ethanol’s deleterious effects on eyeblink conditioning result from damage to associative learning processes in the cerebellum and are not due to impaired processing of the US or performance of the UR.
Interestingly, the amplitude and latency of the UR can be modified as a result of CS-US paired conditioning, an effect termed conditioning-specific reflex modification (CRM) (Schreurs, 2003; Schreurs et al., 2000). The UR changes are associative—they do not occur in rats exposed to unpaired CS-US conditioning, or following restraint without CS-US presentations (Schreurs et al., 1995). Following 10 days of paired conditioning in the current study, UR amplitudes in EtOH rats were not significantly different from the amplitudes of controls rats at multiple shock intensities, suggesting CRM was not significantly affected by neonatal ethanol exposure either. Future studies should assess UR production in ethanol-exposed and control rats before and after eyeblink conditioning.
3.3. Summary
In summary, the current results replicate previous research demonstrating that neonatal ethanol exposure impairs classical eyeblink conditioning. Importantly, however, the ethanol-mediated impairments have now been demonstrated to occur across multiple US shock intensities in adult rats—even, presumably, at intensities that are not optimal for producing a blink CR in particular subjects within a group. The frequency of CR blinks was lowered and their onset latencies shortened, relative to control animals, at all three US intensities. CR mean and peak amplitudes, in contrast, were diminished by ethanol exposure at only the highest US intensity. Finding no differences in UR amplitude among treatment groups, the deficits in CR production are proposed to result from anatomical abnormalities in various regions of the EBC neural circuit. In the future, as the differential vulnerabilities of the developing cerebellum to ethanol are better understood, our ability to co-localize particular deficits in CR performance to specific anatomical or physiological abnormalities will undoubtedly improve.
4. Experimental Procedures
4.1. Subjects
Long-Evans male and female breeders, housed in the Department of Psychological and Brain Science’s rodent vivarium at IU Bloomington, were placed together on designated days to mate. Vaginal smears were taken each subsequent morning until a sperm plug was detected. The morning following copulation was defined as gestational day (GD) 0. Litters were typically born on GD 21 or 22, thereafter referred to as postnatal day (PD) 0. On PD 3 litters were culled to 10 pups, retaining equal numbers of males and females when possible. On the same day a small amount of nontoxic black ink was subcutaneously injected into one or more paws for identification purposes. Rats were weaned on PD 21, separated by sex on PD 45, and then individually housed following surgery (see below).
Eighty-six experimentally naïve Long-Evans rats—42 male and 44 female—were maintained on a 12 hour light/dark cycle with ad-lib access to food and water. Surgical and behavioral procedures were conducted during the light phase. All procedures, including surgery and postoperative care, were in strict compliance with the Indiana University animal care guidelines, and all necessary measures were taken to minimize pain and discomfort.
4.2. Neonatal Treatment
On PD 4, rat pups were pseudo-randomly assigned to one of three treatment groups: ethanol-exposed (EtOH), sham-intubated (SI), or unhandled control (UC). Pups in the EtOH treatment group underwent intragastric intubations three times daily from PD 4 to PD 9, each intubation separated by 2 hr. The first two daily intubations consisted of 11.33% (5 g/kg/day) ethanol in milk formula; the third intubation was milk formula only. The SI pups were intubated three times daily, though no formula was ever given. UC pups were left undisturbed with the dam.
4.3. Blood Alcohol Concentration (BAC)
For SI and EtOH rat pups, 20 μl of blood was collected in heparinized capillary tubes from a tail clip immediately before the final intubation on PD 4. Blood samples were dispensed into microcentrifuge tubes, centrifuged, and plasma separated. BACs were determined using an oximetric assay procedure. An Analox GL5 Analyzer (Analox Instruments, Lunenberg, MA) was used to measure the rate of oxygen consumption resulting from oxidation of ethanol in the sample.
4.4. Surgical Procedures
All surgical procedures were performed under aseptic conditions. Beginning on PD 80, rats were anesthetized using intraperitoneal (ip) injections of an anesthetic cocktail (2.0 ml/kg), consisting of physiological saline (9.0 mg/kg), ketamine (74.0 mg/kg), xylazine (3.7 mg/kg), and acepromazine (0.74 mg/kg). Ketamine boosters were administered as required. Each subject was surgically prepared with differential electromyographic (EMG) wires and a bipolar periocular stimulator. EMG activity was recorded in the OO muscle surrounding the eye by passing two ultrathin (0.003″) Teflon-coated stainless steel wires subdermally beneath the anterior portion of the upper eyelid. Gold-coated stainless steel wires were implanted in the dorso-caudal portion of the OO muscle for delivery of the periorbital electrical shock US. A ground wire was connected to one of three stainless steel skull screws. The two EMG wires and separate ground wire all terminated in gold pins inside a 3-pin plastic connector. The headstage and US bipolar stimulating electrodes were fixed in dental cement. The wound was salved with antibiotic ointment (Povidone), and the animals were given at least 6 days to recover before the start of training.
4.5. Experimental Design
Eyeblink conditioning utilized a mixed 3 × 3 × 10 design: two between-subjects factors, neonatal treatment (UC, SI, or EtOH) and US intensity (1.0, 1.5, or 2.0 mA), and one within-subjects factor, conditioning day (1–10). Following surgery, each adult rat experienced 1 day of adaptation and 10 days of eyeblink conditioning. Subsets of rats from each neonatal treatment group then underwent an additional 5 days of conditioning. A mixed 3 × 5 design was used, with neonatal treatment (UC, SI, or EtOH) as the between-subjects factor and US shock intensity (1.0, 1.5, 2.0, 3.0, and 4.0 mA) as the within-subjects factor.
4.6. Behavioral Training and Testing
Eyeblink conditioning took place in standard operant boxes (Coulburn Instruments, Allentown, PA), contained within sound-attenuating chambers. Each operant box had two stainless steel walls, two Plexiglas walls and a grid floor composed of 0.5 cm stainless steel bars placed approximately 1.5 cm apart. The electrode leads attached to each subject’s head swiveled freely on a 10-channel commutator connected to a counterbalanced, pivoting arm. All animals were able to move freely about in the conditioning chamber.
All subjects received one day of adaptation (45 min), with the commutator attached but no stimuli presented. The first of 10 conditioning sessions began the next day. The CS was a 450 ms, 2.8 kHz, 85 dB SPL tone delivered from an overhead speaker. The US was a co-terminating 100 ms, 60 Hz, constant-current square wave, periocular stimulation of the left eyelid (1.0, 1.5, or 2.0 mA). Each conditioning session consisted of 10 blocks of 10 trials—8 CS-US paired trials and 2 CS-alone trials. For paired trials, the CS-US interstimulus interval (ISI) was 350 ms. The intertrial interval (ITI) was 25 ± 5 s.
Eyelid EMG activity was amplified (1000X) and bandpass filtered (300–1000 Hz) by a differential AC amplifier (model 1700, A-M Systems, Carlsborg, WA). The raw EMG signal was displayed by oscilloscope for inspection purposes. The EMG signal was simultaneously digitized (500 Hz), rectified, smoothed (10 ms time constant), time-shifted (10 ms, to compensate for smoothing), and stored for offline analysis using the Spike 2 waveform analysis system (CED Limited, Cambridge, England).
After completing 10 days of conditioning, subsets of rats were pseudo-randomly selected in order to analyze unconditioned eyeblink responses. Each rat underwent a further five days of delay eyeblink conditioning, receiving 80 CS-US paired trials and 20 US-alone trials per day. For the first three days, the 100 ms US shock was pseudo-randomly set at 1.0, 1.5, or 2.0 mA. On day four, the US intensity was raised to 3.0 mA, while the duration was shortened to 25 ms. On day five, a 10 ms, 4.0 mA US was used. We chose to decrease US duration when the intensity was set to 3.0 and 4.0 mA as longer durations produced excessive movements in the rats, including elevated blink rates. The five combinations of US intensity and duration were chosen because these parameters are commonly used in rat eyeblink conditioning studies. To prevent US-induced saturation of the amplifier during US-alone trials the EMG input to the amplifier was clamped (model 2804; CED Ltd.) beginning 2 ms before US onset and released 2 ms after US offset. In actuality, the clamp took around 10 to 15 ms to fully block the EMG signal.
4.7. Data Analysis
EMG data from paired trials were used to compute the percentage of CRs produced during each session, whereas data from CS-alone trials was used to compute the amplitude and timing of the averaged CR. On each trial, EMG activity from the OO muscle was sampled for 1000 ms, divided into three periods: (i) a 350 ms pre-CS period, prior to CS onset; (ii) a 350 ms CS-US period, between CS onset and US onset; and (iii) a 300 ms post-US period, following US onset.
Trials in which CS-elicited EMG activity exceeded pre-CS mean EMG activity by 8 standard deviations or more were counted as CRs. Elevated EMG activity during the first 100 ms of the CS was considered an alpha response and not counted as a CR. Trials with elevated EMG activity during the 100 ms period immediately preceding CS onset were deemed bad trials and excluded from analysis. Any subject whose bad trials exceeded 25% of the total on five or more conditioning days was not used in the study. UR peak amplitudes were assessed in a subset of conditioning subjects. Data were analyzed using t-tests, ANOVA, repeated measures ANOVA, and, when appropriate, Tukey-Kramer post-hoc tests. A significant post-hoc effect implies p < 0.05.
Acknowledgments
This research was supported by National Institute on Alcohol Abuse and Alcoholism grant AA011945. DHL and JES are now in the Departments of Molecular Biosciences and Psychology at the University of Kansas, Lawrence, KS.
Abbreviations
- BAC
blood alcohol concentration
- CR
conditioned response
- CRM
conditioning-specific reflex modification
- CS
conditioned stimulus
- EMG
electromyogram
- EtOH
ethanol
- EBC
eyeblink conditioning
- FAS
fetal alcohol syndrome
- FASD
fetal alcohol spectrum disorder
- GD
gestational day
- GR
glucocorticoid receptor
- IP
interpositus nucleus
- ISI
interstimulus interval
- ITI
intertrial interval
- mA
milliamp
- OO
orbicularis oculi muscle
- PD
postnatal day
- SI
sham-intubated
- UC
unhandled control
- UR
unconditioned response
- US
unconditioned stimulus
Footnotes
Publisher's Disclaimer: This is a PDF file of an unedited manuscript that has been accepted for publication. As a service to our customers we are providing this early version of the manuscript. The manuscript will undergo copyediting, typesetting, and review of the resulting proof before it is published in its final citable form. Please note that during the production process errors may be discovered which could affect the content, and all legal disclaimers that apply to the journal pertain.
References
- Altman J. Postnatal development of the cerebellar cortex in the rat. II Phases in the maturation of Purkinje cells and the molecular layer. J Comp Neurol. 1972;145:399–464. doi: 10.1002/cne.901450402. [DOI] [PubMed] [Google Scholar]
- Backman C, West JR, Mahoney JC, Palmer MR. Electrophysiological characterization of cerebellar neurons from adult rats exposed to ethanol during development. Alcoholism: Clin Exp Res. 1998;22:1134–1175. [PubMed] [Google Scholar]
- Bayer SA, Altman J, Russo RJ, Zhang X. Timetables of neurogenesis in the human brain based on experimentally determined patterns in the rat. Neurotoxicology. 1993;14:83–144. [PubMed] [Google Scholar]
- Bertrand J, Floyd RL, Weber MK, O’Connor M, Riley EP, Johnson KA, Cohen DE. Centers for Disease Control and Prevention. Atlanta, GA: 2004. National Task Force on FAS/FAE: Guidelines for referral and diagnosis; pp. 1–50. [Google Scholar]
- Bonthius DJ, West JR. Permanent neuronal deficits in rats exposed to alcohol during the brain growth spurt. Teratology. 1991;44:147–163. doi: 10.1002/tera.1420440203. [DOI] [PubMed] [Google Scholar]
- Bracha V, Irwin KB, Webster ML, Wunderlich DA, Stachowiak MK, Bloedel JR. Microinjections of anisomycin into the intermediate cerebellum during learning affect the acquisition of classically conditioned responses in the rabbit. Brain Res. 1998;788:169–178. doi: 10.1016/s0006-8993(97)01535-7. [DOI] [PubMed] [Google Scholar]
- Clark RE, Zhang AA, Lavond DG. Reversible lesions of the cerebellar interpositus nucleus during acquisition and retention of a classically conditioned behavior. Behav Neurosci. 1992;106:879–888. doi: 10.1037//0735-7044.106.6.879. [DOI] [PubMed] [Google Scholar]
- Clarren SK. Neuropathology in fetal alcohol syndrome. In: West JR, editor. Alcohol and brain development. Oxford University Press; New York, NY: 1986. pp. 158–166. [Google Scholar]
- Gong S, Zhou Q, LeDoux MS. Blink-related sensorimotor anatomy in the rat. Anat Embryol. 2003;207:193–208. doi: 10.1007/s00429-003-0341-6. [DOI] [PubMed] [Google Scholar]
- Goodlett CR, Johnson TB. Temporal windows of vulnerability to alcohol during the third trimester equivalent: Why “knowing when” matters. In: Hanningan JH, Spear LP, Spear NE, Goodlett CR, editors. Alcohol and alcoholism: Effects on brain and development. Lawrence Erlbaum; Hillsdale, NJ: 1999. pp. 59–91. [Google Scholar]
- Goodlett CR, Pearlman AD, Lundahl KR. Binge neonatal alcohol intubations induce dose-dependent loss of Purkinje cells. Neurotoxicol Teratol. 1998;20:285–292. doi: 10.1016/s0892-0362(97)00102-5. [DOI] [PubMed] [Google Scholar]
- Green JT. The effects of ethanol on the developing cerebellum and eyeblink classical conditioning. Cerebellum. 2004;3:178–187. doi: 10.1080/14734220410017338. [DOI] [PubMed] [Google Scholar]
- Green JT, Arenos JD, Dillon CJ. The effects of moderate ethanol exposure on eyeblink conditioning and deep cerebellar nuclei neuron numbers in the rat. Alcohol. 2006;39:135–150. doi: 10.1016/j.alcohol.2006.09.002. [DOI] [PubMed] [Google Scholar]
- Green JT, Johnson TB, Goodlett CR, Steinmetz JE. Eyeblink classical conditioning and interpositus nucleus activity are disrupted in adult rats exposed to ethanol as neonates. Learn Mem. 2002a;9:304–320. doi: 10.1101/lm.47602. [DOI] [PMC free article] [PubMed] [Google Scholar]
- Green JT, Rogers RF, Goodlett CR, Steinmetz JE. Impairment in eyeblink classical conditioning in adult rats exposed to ethanol as neonates. Alcoholism: Clin Exp Res. 2000;24:438–447. [PubMed] [Google Scholar]
- Green JT, Steinmetz JE. Purkinje cell activity in the cerebellar anterior lobe after rabbit eyeblink conditioning. Learn Mem. 2005;12:260–269. doi: 10.1101/lm.89505. [DOI] [PMC free article] [PubMed] [Google Scholar]
- Green JT, Tran T, Steinmetz JE, Goodlett CR. Neonatal ethanol produces cerebellar deep nuclear cell loss and correlated disruption of eyeblink conditioning in adult rats. Brain Res. 2002b;956:302–311. doi: 10.1016/s0006-8993(02)03561-8. [DOI] [PubMed] [Google Scholar]
- Hanningan JH. What research with animals is telling us about alcohol-related neurodevelopmental disorder. Pharmacol Biochem Behav. 1996;55:489–499. doi: 10.1016/s0091-3057(96)00251-1. [DOI] [PubMed] [Google Scholar]
- Holstege G, Van Han JJ, Tan J. Afferent projections to the orbicularis oculi motoneuronal cell group. An autoradiographic tracing study in the cat. Brain Res. 1986;374:306–320. doi: 10.1016/0006-8993(86)90425-7. [DOI] [PubMed] [Google Scholar]
- Hoyme HE, May PA, Kalberg W, Kodituwakku P, Gossage JP, Trujillo PM, Buckley D, Miller JH, Aragon AS, Khaole N, Viljoen DL, Jones KL, Robinson LK. A practical clinical approach to diagnosis of fetal alcohol syndrome disorders: Clarification of the 1996 Institute of Medicine criteria. Pediatrics. 2005;115:39–47. doi: 10.1542/peds.2004-0259. [DOI] [PMC free article] [PubMed] [Google Scholar]
- Krupa DJ, Thompson JK, Thompson RF. Localization of a memory trace in the mammalian brain. Science. 1993;260:989–991. doi: 10.1126/science.8493536. [DOI] [PubMed] [Google Scholar]
- Lavond DG. Role of the nuclei in eyeblink conditioning. Ann NY Acad Sci. 2002;978:93–105. doi: 10.1111/j.1749-6632.2002.tb07558.x. [DOI] [PubMed] [Google Scholar]
- Light KE, Belcher SM, Pierce DR. Time course and manner of Purkinje neuron death following a single ethanol exposure on postnatal day 4 in the developing rat. Neuroscience. 2002;114:327–337. doi: 10.1016/s0306-4522(02)00344-5. [DOI] [PubMed] [Google Scholar]
- May PA, Gossage JP. Estimating the prevalence of fetal alcohol syndrome: A summary. Alcohol Res Health. 2001;25:159–167. [PMC free article] [PubMed] [Google Scholar]
- McCormick DA, Steinmetz JE, Thompson RF. Lesions of the inferior olivary complex cause extinction of the classically conditioned eyeblink response. Brain Res. 1985;359:120–130. doi: 10.1016/0006-8993(85)91419-2. [DOI] [PubMed] [Google Scholar]
- Medina JF, Nores WL, Ohyama T, Mauk MD. Mechanisms of cerebellar learning suggested by eyelid conditioning. Curr Opin Neurobiol. 2000;10:717–724. doi: 10.1016/s0959-4388(00)00154-9. [DOI] [PubMed] [Google Scholar]
- Napper RMA, West JR. Decreased total number of Purkinje cells in the cerebellum of the ten day old rat following postnatal ethanol exposure. Alcoholism: Clin Exp Res. 1993;17:485. [Google Scholar]
- Napper RMA, West JR. Permanent neuronal cell loss in the cerebellum of rats exposed to continuous low blood alcohol levels during the brain growth spurt: A stereological investigation. J Comp Neurol. 1995;362:283–292. doi: 10.1002/cne.903620210. [DOI] [PubMed] [Google Scholar]
- Nolan BC, Freeman JH. Purkinje cell loss by OX7-saporin impairs acquisition and extinction of eyeblink conditioning. Learn Mem. 2006;13:359–365. doi: 10.1101/lm.168506. [DOI] [PMC free article] [PubMed] [Google Scholar]
- Olson HC, Feldman JJ, Streissguth AP, Sampson PD, Bookstein FL. Neuropsychological deficits in adolescents with fetal alcohol syndrome: clinical findings. Alcoholism: Clin Exp Res. 1998;22:1998–2012. [PubMed] [Google Scholar]
- Pauli J, Wilce P, Bedi KS. Acute exposure to alcohol during early postnatal life causes a deficit in the total number of cerebellar Purkinje cells in the rat. J Comp Neurol. 1995;360:506–512. doi: 10.1002/cne.903600311. [DOI] [PubMed] [Google Scholar]
- Pellegrini JJ, Evinger C. The trigeminally evoked blink reflex: II. Mechanisms of paired-stimulus suppression. Exp Brain Res. 1995;107:181–196. doi: 10.1007/BF00230040. [DOI] [PubMed] [Google Scholar]
- Pierce DR, Goodlett CR, West JR. Differential neuronal loss following early postnatal alcohol exposure. Teratology. 1989;40:113–126. doi: 10.1002/tera.1420400205. [DOI] [PubMed] [Google Scholar]
- Pierce DR, Serbus DC, Light KE. Intragastric intubation of alcohol during postnatal development of rats results in selective cell loss in the cerebellum. Alcoholism: Clin Exp Res. 1993;17:1275–1280. doi: 10.1111/j.1530-0277.1993.tb05241.x. [DOI] [PubMed] [Google Scholar]
- Renwick JH, Asker RL. Ethanol-sensitive times for the human conceptus. Early Hum Dev. 1983;8:99–111. doi: 10.1016/0378-3782(83)90065-8. [DOI] [PubMed] [Google Scholar]
- Roebuck TM, Mattson SN, Riley EP. A review of the neuroanatomical findings in children with fetal alcohol syndrome or prenatal exposure to alcohol. Alcoholism: Clin Exp Res. 1998;22:339–344. doi: 10.1111/j.1530-0277.1998.tb03658.x. [DOI] [PubMed] [Google Scholar]
- Schreurs BG. Classical conditioning and modification of the rabbit’s (Oryctolagus cuniculus) unconditioned nictitating membrane response. Behav Cogn Neurosci Rev. 2003;2:83–96. doi: 10.1177/1534582303255014. [DOI] [PubMed] [Google Scholar]
- Schreurs BG, Oh MM, Hirashima C, Alkon DL. Conditioning-specific modification of the rabbit’s unconditioned nictitating membrane response. Behav Neurosci. 1995;109:24–33. doi: 10.1037//0735-7044.109.1.24. [DOI] [PubMed] [Google Scholar]
- Schreurs BG, Shi T, Pineda SI, Buck DL. Conditioning the unconditioned response: modification of the rabbit’s (Oryctolagus cuniculus) unconditioned nictitating membrane response. J Exp Psychol Anim Behav Process. 2000;26:144–156. doi: 10.1037//0097-7403.26.2.144. [DOI] [PubMed] [Google Scholar]
- Sears LL, Steinmetz JE. Dorsal accessory inferior olive activity diminishes during acquisition of the rabbit classically conditioned eyelid response. Brain Res. 1991;545:114–122. doi: 10.1016/0006-8993(91)91276-7. [DOI] [PubMed] [Google Scholar]
- Skelton RW. Bilateral cerebellar lesions disrupt conditioned eyelid responses in unrestrained rats. Behav Neurosci. 1988;102:586–590. doi: 10.1037//0735-7044.102.4.586. [DOI] [PubMed] [Google Scholar]
- Stanton ME, Goodlett CR. Neonatal ethanol exposure impairs eyeblink conditioning in weanling rats. Alcoholism: Clin Exp Res. 1998;22:270–275. [PubMed] [Google Scholar]
- Steinmetz JE. Brain substrates of classical eyeblink conditioning: A highly localized but also distributed system. Behav Brain Res. 2000;110:13–24. doi: 10.1016/s0166-4328(99)00181-3. [DOI] [PubMed] [Google Scholar]
- Steinmetz JE, Logan CG, Rosen DJ, Thompson JK, Lavond DG, Thompson RF. Initial localization of the acoustic conditioned stimulus projection system to the cerebellum essential for classical eyelid conditioning. Proc Natl Acad Sci USA. 1987;84:3531–3535. doi: 10.1073/pnas.84.10.3531. [DOI] [PMC free article] [PubMed] [Google Scholar]
- Steinmetz JE, Sears LL, Gabriel M, Kubota Y, Poremba A, Kang E. Cerebellar interpositus nucleus lesions disrupt classical nictitating membrane conditioning but not discriminative avoidance learning in rabbits. Behav Brain Res. 1991;45:71–80. doi: 10.1016/s0166-4328(05)80182-2. [DOI] [PubMed] [Google Scholar]
- Steinmetz JE, Sengelaub DR. Possible conditioned stimulus pathway for classical eyelid conditioning in rabbits. I Anatomical evidence for direct projections from the pontine nuclei to the cerebellar interpositus nucleus. Behav Neural Biol. 1992;57:103–115. doi: 10.1016/0163-1047(92)90593-s. [DOI] [PubMed] [Google Scholar]
- Streissguth AP, Bookstein FL, Barr HM. A dose-response study of the enduring effects of prenatal alcohol exposure: Birth to 14 years. In: Spohr H-L, Steinhausen H-C, editors. Alcohol, pregnancy, and the developing child. Cambridge University Press; Cambridge, UK: 1996. pp. 141–168. [Google Scholar]
- Tamai Y, Iwamoto M, Tsujimoto T. Pathway of the blink reflex in the brainstem of the cat: Interneurons between the trigeminal nuclei and the facial nucleus. Brain Res. 1986;380:19–25. doi: 10.1016/0006-8993(86)91424-1. [DOI] [PubMed] [Google Scholar]
- Thomas JD, Goodlett CR, West JR. Alcohol-induced Purkinje cell loss depends on developmental timing of alcohol exposure and correlates with motor performance. Dev Brain Res. 1998;105:159–166. doi: 10.1016/s0165-3806(97)00164-8. [DOI] [PubMed] [Google Scholar]
- Thompson RF. In search of memory traces. Annu Rev Psychol. 2005;56:1–23. doi: 10.1146/annurev.psych.56.091103.070239. [DOI] [PubMed] [Google Scholar]
- Tran TD, Jackson HD, Horn KH, Goodlett CR. Vitamin E does not protect against neonatal ethanol-induced cerebellar damage or deficits in eyeblink classical conditioning in rats. Alcoholism: Clin Exp Res. 2005;29:117–129. doi: 10.1097/01.alc.0000150004.53870.e1. [DOI] [PubMed] [Google Scholar]
- Van Ham JJ, Yeo CH. The central distribution of primary afferents from the external eyelids, conjunctiva, and cornea in the rabbit, studied using WGA-HRP and B-HRP as transganglionic tracers. Exp Neurol. 1996;142:217–225. doi: 10.1006/exnr.1996.0193. [DOI] [PubMed] [Google Scholar]
- Wilber AA, Southwood CJ, Sokoloff G, Wellman CL, Steinmetz JE. Neonatal maternal separation alters adult eyeblink conditioning and glucocorticoid receptor expression in the interpositus nucleus of the cerebellum. Soc for Neurosci. 2006 doi: 10.1002/dneu.20549. Abstract 562.18. [DOI] [PubMed] [Google Scholar]