

Abstract
Although brain pathways activated by sepsis may respond acutely to endotoxin administration, the long-term central response to sepsis is not known. We prepared male rats for hormonal sampling at the circadian nadir (AM) and peak (PM) after cecal ligation and puncture (CLP) or sham surgery. Diurnal variation of corticosterone was present on postoperative day (D) 3 and D4 after sham surgery but not after CLP. CLP increased Fos immunostaining in the nucleus of tractus solitarius (NTS), ventrolateral medulla, medullary raphe, parabrachial nucleus, hypothalamus, amygdala, bed nucleus of stria terminalis, and preoptic region. Fos responses were generally greatest on D1 but persisted to the AM of D4. The number of Fos-positive cell nuclei in the NTS on D3 and D4 did not differ but had greater variance on D3 than on D4 (P < 0.01) with a divergent response in the PM of D3 that was correlated with plasma ACTH (r = 0.927, P<0.01) but not with corticosterone. CLP increased CRH-staining intensity in the hypothalamic paraventricular neurons uniformly from D1 through D4 (P<0.01). Similar to Fos in NTS, this response was correlated with plasma ACTH (r = 0.738, P<0.05) and adrenal size (r = 0.730, P<0.05) in the PM of D3. Neuronal CRH became detectable after CLP in specific medullary areas on D1 and in the preoptic region on D3 and D4. Thus, the suppression of circadian variation by CLP was associated with central neural responses that increased in relation to plasma ACTH without apparent influence on the release of corticosterone.
Keywords: ACTH, catecholaminergic neurons, corticosterone, CRH, nucleus of the solitary tract, parabrachial nucleus, hypothalamic paraventricular nucleus, preoptic, sepsis, seritonergic neurons
Introduction
The administration of bacterial endotoxin has gained wide use as a systemic inflammatory stimulus (Beishuizen and Thijs, 2003; Carlson et al., 1997; Elmquist and Saper, 1996; Elmquist et al., 1996; Gaykema et al., 1995; Wan et al., 1994; Watkins et al., 1994), but the utility of endotoxin administration as an experimental model of sepsis has been questioned (Mathiak et al., 2000; Wichterman et al., 1980). The central neural responses to acute doses of endotoxin (Elmquist, et al., 1996; Wan, et al., 1994) or inflammatory cytokines (Chan et al., 1993; Crane et al., 2003; Ericsson et al., 1994; Xu et al., 1999) have been well described and are likely to be present in sepsis but may comprise only a subset of the complete response to prolonged systemic infection. The central modulation of the immune system and of metabolism is likely to affect the clinical course of sepsis significantly. The septic state includes altered regulation of body temperature, impaired host-defense (Ebong et al., 1999), abnormal sleep patterns (Mundigler et al., 2002), suppression of appetite (Campbell, 1999), and blunted daily rhythms in behavior (Ebong et al., 1999) and hormonal secretion (Bornstein et al., 1998; Carlson et al., 2006) that are all influenced by the central nervous system.
A major focus of our laboratory has been the adrenocortical response to sepsis. Adrenalectomized animals face a lethal risk to inflammatory challenges that are normally nonlethal (Hinshaw et al., 1985), and recent evidence suggests that intermittent and tapered low doses of corticosteroid can improve outcome in septic patients (Annane et al., 2004; Minneci et al., 2004). Thus, the endogenous adrenocortical response to sepsis appears in some way inadequate as a natural defense mechanism, and the central neural response to sepsis may contribute to this inadequacy. Circadian patterns of hormonal release and host-defense are also blunted in models of chronic behavioral stress (McEwen, 2003) in which numerous central neural responses including the upregulation of both hypothalamic (Makino et al., 1995) and extrahypothalamic (Makino et al., 2002; Schulkin, 2003) corticotropin releasing hormone (CRH) have been observed. The purpose of the present study was to assess whether similar responses are present after cecal ligation and puncture (CLP) (Wichterman, et al., 1980), an established model of polymicrobial sepsis.
Materials and Methods
Sprague-Dawley male rats (Charles River) weighing 300-450 grams were housed two to three per cage and acclimated to a 12-hour light/dark cycle with lights on at 0600 h for at least five days. Rat chow and water were provided ad libitum. Experimental protocols were approved by the University of Maryland IACUC in accord with the guidelines of the National Institutes of Health.
Cecal ligation and puncture
Rats were brought to the surgical suite at about 0900 h and were anesthetized with an ip dose of ketamine (75 mg/kg) and xylazine (5 mg/kg). A femoral arterial catheter was placed and tunneled under the skin to exit between the scapulae (Carlson, 1997; Carlson, et al., 1997). CLP based on (Wichterman, et al., 1980) was done as described in detail previously (Carlson, et al., 2006) through a midline abdominal incision with either a 21- or an 18-gauge needle (CLP21 and CLP18, respectively). For sham surgery, the cecum was exposed but was not ligated or punctured. Each rat was housed individually with its indwelling catheter protected by a stainless steel spring and then tethered to the top of its cage. During recovery rats were administered 3 ml/100g of normal saline either sc or in 2.5 ml boluses ia at 20-30 min intervals. Surgeries were done in groups of five to seven rats from 1000 to 1400 h with the specific procedure selected randomly for each rat.
Blood sampling and perfusion
On the afternoon of the day of surgery rats were returned to the animal quarters with no change in the established light-dark cycle. Blood samples (0.4-0.5 ml) were drawn each day in the AM (0800 h to 1000 h) and the PM (1600 h to 1800 h) and were replaced with equal volumes of heparinized (10 units/ml) saline until the rats were perfused in either the AM or the PM of day (D) 1 after surgery or in the PM of D3 or the AM of D4. At perfusion each rat was deeply anesthetized with pentobarbital (50-60 mg/kg, iv) and infused with 300-500 units of heparin. The thorax was opened and normal saline with 2% sodium nitrite at 4 °C was infused through the left cardiac ventricle and drained from the right cardiac atrium to flush out red cells. Then 4% buffered paraformaldehyde (pH 6.8) with 2.5% acolein was infused to fix the tissues followed by saline with sodium nitrite. Brains and adrenals were immersed for an additional hour in 4% paraformaldehyde then were saved in 25% sucrose. The major (a) and minor (b) axes of one or both fixed adrenals from each rat were measured, and the normalized volume estimated as π•(a2b + ab2)/12 divided by the presurgical body weight.
Histology
Thirty-five micron coronal sections were cut and stored in cyroprotectant antifreeze solution (Watson et al., 1986). For immunochemistry (Berghorn et al., 1994), selected sections were rinsed 10x over 1 h in 0.05 M potassium phosphate buffered saline (KPBS), placed in 1% sodium borohydride in KPBS for 20 min at room temperature, and then rinsed multiple times in KPBS to remove bubbles. Incubation in primary antibodies (Ab) for 1 h at room temperature followed by 48-72 h at 4 °C was done in KPBS with 0.4% Triton X-100 with the following dilutions: Fos Ab made in rabbit (EMD biosciences, La Jolla, CA, cFos (Ab-5), Cat. No. PC#38, lot 4190-1-3) 1:150,000; CRH Ab made in rabbit (Courtesy of Dr. Ann-Judith Silverman, CRF 3a) 1:300,000; tyrosine hydroxylase (TH) mouse monoclonal Ab (Immunostar, Hudson, WI, Cat. No. 22941) 1:400,000; dopamine beta hydroxylase (DBH) Ab made in rabbit (Immunostar, Cat. No. 22806) 1:35,000; phenylethanolamine-N-methyl-transferase (PNMT) Ab made in rabbit (Immunostar, Cat. No. 22572) 1:25,000; and serotonin Ab made in rabbit (Immunostar, Cat. No. 20080) 1:300,000. Sections were rinsed 10x over 1 h in KPBS then incubated in biotinylated secondary antibody (Vector Laboratories, Burlingame, CA) directed against the immunoglobulins of the species of the primary Ab diluted 1:600 for 1 h at room temperature. Sections were then rinsed 5x over 50 min in KPBS and incubated in AB solution made with the ABC Elite Kit (Vector) using 45 μl of A and 45 μl of B per 10 ml of KPBS with 0.4% Triton X-100. To visualize antibody to Fos, sections were rinsed 3 × 5 min with KPBS and 3 × 5 min with 175 mM sodium acetate then reacted for 20 min in nickel-enhanced 3, 3′-diaminobenzidine tetrahydrochloride (DAB) solution (2 mg DAB plus 250 mg Nickel (II) Sulfate with 8.3 μl 3% H2O2 per 10ml of 175 mM sodium acetate) to yield a black reaction product. When sections were immunostained for a second antigen, the procedure above was followed through the incubation in AB solution. Sections were then rinsed 3 × 5 min in KPBS followed by 3 × 5 min in Tris (pH 7.2, .769 g Tris per 100 ml saline) buffer and then reacted in DAB chromogen solution (2 mg DAB with 8.3 μl 3% H2O2 per 10 ml of Tris buffer) to yield a brown reaction product. After the chromogen reactions, sections were rinsed 3 × 5 min in the appropriate buffer to stop the reaction and then 3 × 5 min in KPBS before mounting on gelatin-coated slides.
Image analysis
Neuronal counts and microdensitometry were done using an image analysis system with the Nova Prime software package (Bioquant Image Analysis Corporation, Nashville, TN). To determine the number of Fos-positive cells in the dorsomedial medulla, bilateral manual counts for each rat were made in two sections located caudal to the area postrema, two sections at the level of the area postrema, and two sections rostral to the area postrema. The software marked each cell to prevent duplicate counting and kept a running total. The average count per section was computed for each rat. The optical density of immunoreactivity for CRH was determined in the hypothalamic paraventricular nucleus (PVH). CRH staining was selected by digital thresholding in representative square fields of 10000 μ2 in the medial parvocellular PVH. The average grey level of the selected pixels was measured and then corrected for the background grey level of an adjacent area with no detectable signal to determine the optical density of staining. The staining densities from two such fields (one on each side) were averaged for each rat. In addition the number of CRH-positive cells in each of the analyzed fields was counted. Since the CRH reactivity used for grey levels in the measured fields often included dendritic staining as well as CRH cells that overlapped or were only partially in the section, we measured the integrated optical density of 10 representative CRH neurons whose entire soma were visible and distinct on each side of the third ventricle. For each pixel the logarithm of the ratio of the measured grey level to the background grey level was computed so that pixels at the background level yielded a signal of zero. The results from all pixels within an elliptical area surrounding each measured cell body were summed to determine the integrated optical density per neuron. Measurements from the 20 CRH neurons were averaged for each rat.
Assays
Immunoreactive ACTH in plasma was assayed (Nicholson et al., 1984) with an antibody raised in a rabbit to ACTH1-24 conjugated to bovine serum albumin and with radioiodinated ACTH1-39 (DiaSorin, Stillwater, MN). Crossreactivities with ACTH18-39, α-, β-, and γ-melanocyte stimulating hormone, and β-endorphin were all <0.1%. Sensitivity of the assay was 30 pg/ml. Intra- and interassay coefficients of variation were 7.4% and 9.0%, respectively. Plasma corticosterone was determined by a radioimmunoassay kit (MP Biomedicals, Inc., Irvine, CA). Crossreactivities with deoxycorticosterone, testosterone, cortisol, and several other physiological steroids were < 1%. Sensitivity was 10 ng/ml. Intra- and interassay coefficients of variation were 7.1% and 7.2%, respectively.
Statistics
Hormonal measurements were tested with analysis of variance (ANOVA) corrected for repeated measures in time, and histological measures were tested with ANOVA for independent samples. When comparisons between multiple means were indicated by overall significance of the ANOVA, the Newman-Keuls post hoc test was used (Winer, 1971). Variances were compared using the F statistic (Snedecor and Cochran, 1989). A P value of 0.05 was classed as significant.
Results
Hormonal responses to CLP
One group of rats was perfused on D1 after CLP or sham surgery and another was perfused on D3 or D4. The hormonal responses in these two groups were similar (Figs. 1 and 2). Plasma corticosterone and ACTH were greater after CLP than after sham surgery in the PM of the day of surgery and in the AM of D1 (Fig. 1). Corticosterone remained elevated through the AM of day 2 (Fig. 2B). By the PM of D3 the mean values of plasma corticosterone in the CLP groups were intermediate between the AM and PM values after sham surgery, and the AM values on D4 were greater after CLP than after sham surgery (P<0.01, Fig. 2B). In the PM of D3 after sham surgery, corticosterone exceeded the AM values measured on days two to four (P < 0.01, Fig 1B). ACTH after CLP was modestly elevated above sham values from D1 through D4 to yield a significant interaction by ANOVA (P < 0.01, Fig 2A).
Figure 1.

Plasma ACTH (A) and corticosterone (B) in rats perfused on the first day after sham surgery or cecal ligation and puncture with either a 21- (CLP21) or an 18-gauge (CLP18). Shading indicates dark period. Number adjacent to symbol indicates number of rats perfused at that time point. Hormonal value differs from sham value: +P < 0.05, *P < 0.01.
Figure 2.

Plasma ACTH (A) and corticosterone (B) in rats perfused on the third or fourth day after sham surgery or cecal ligation and puncture with either a 21- (CLP21) or an 18-gauge (CLP18). Shading indicates dark period. Number adjacent to symbol indicates number of rats perfused at that time point. Modest elevation of ACTH after CLP in A leads to an overall interaction by ANOVA (P < 0.05). Hormonal value differs from sham value: +P < 0.05, *P < 0.01.
Responses in the dorsomedial medulla
Representative examples of Fos expression in the dorsomedial medulla on D1 after surgery are shown in Fig. 3. Table 1 summarizes these results in relation to other areas of the brain. After CLP Fos was present within the dorsomedial, medial, and commissural subnuclei of the nucleus tractus solitarius (NTS) in a distribution similar to that reported at 2 or 6 h after intravenous administration of endotoxin (Elmquist, et al., 1996). Fos also appeared in the area postrema in the rats with the most intensely stained and greatest number of Fos-positive neurons (Fig. 3D). However, as was found for the hormonal results after CLP, the number of Fos-positive cells did not differ significantly for cecal punctures made with different gauge needles. Fos was also present on D3 and D4 after CLP but in fewer neurons and with lesser intensity (Fig. 3E). The mean number of Fos-positive cells in the dorsomedial medulla was greater after CLP than after sham surgery in both the AM and the PM of D1 and in the AM of D4 (Fig. 4A). The mean number of positive cells on D3 did not differ from the number on D4 but had significantly greater variance (P < 0.01). Furthermore, the two rats with the greatest number of Fos-positive cells in the PM of D3 after CLP led to significant correlations between the Fos response and both the AM and PM values of plasma ACTH on D3 (as shown for the PM values of ACTH in Fig. 4B) but not to the values of corticosterone. A correlation between the expression of Fos in the dorsomedial medulla and plasma ACTH was absent in the AM of D4 after CLP and at all times after sham surgery.
Figure 3.
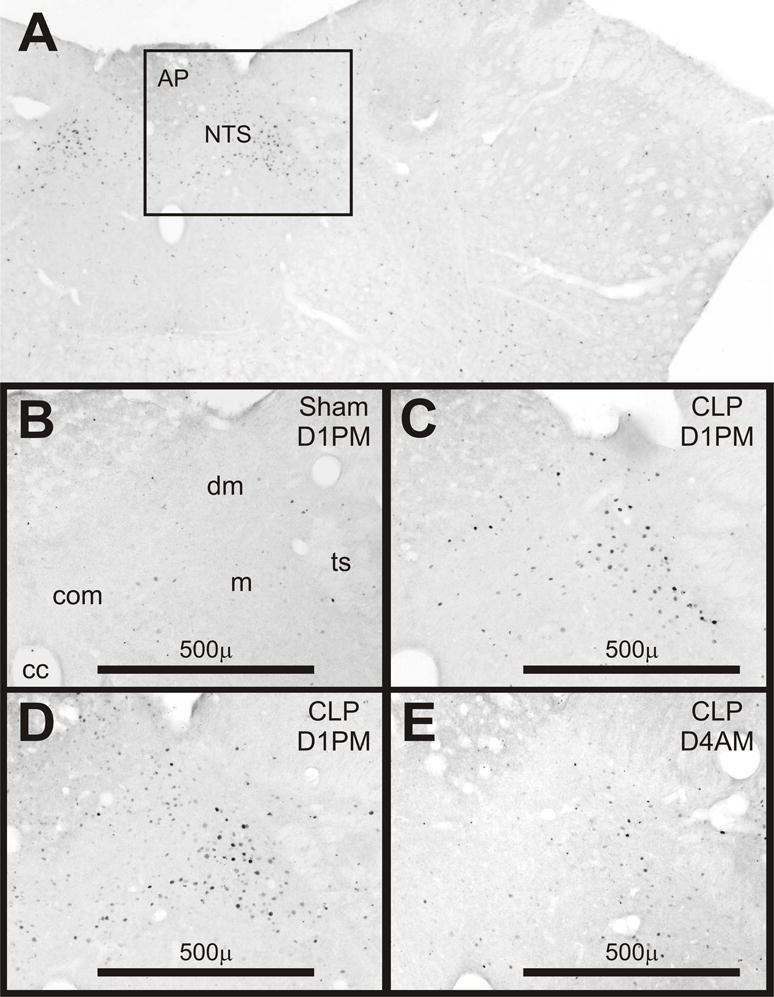
Expression of Fos in coronal sections of the dorsomedial medulla. A) Low power view of outlined area shown in panel D. B-E) Examples from rats after sham surgery or cecal ligation and puncture (CLP) on day 1 in the PM (D1PM) or on D4AM as noted in the upper right of each panel. Abbreviations: AP, area postrema; NTS, Nucleus of the tractus solitarius; cc, central canal; com, commissural subnucleus; dm, dorsomedial subnucleus; m, medial subnucleus; ts, tractus solitarius.
Table 1.
Immunocytochemical detection of Fos and CRH during surgically induced sepsis.
| Time after CLP | Day 1 | Day 3 | Day 4 | |||||||||
|---|---|---|---|---|---|---|---|---|---|---|---|---|
| AM | PM | PM | AM | |||||||||
| Brain Areas | Fos | CRH de novo | Fos & CRH | Fos | CRH de novo | Fos & CRH | Fos | CRH de novo | Fos & CRH | Fos | CRH de novo | Fos & CRH |
| NTS commisuralis | +++ | + | + | +++ | ++ | ++ | ++ | ++ | + | ++ | + | |
| Main NTS | +++ | + | +++ | ++ | + | ++ | + | ++ | ||||
| A1 and C1 | +++ | +++ | + | + | ||||||||
| Periambiguous | ++ | ++ | ++ | ++ | ++ | ++ | +− | + | +− | +− | +− | +− |
| LC | ++ | ++ | ++ | + | ||||||||
| LSC | +++ | ++ | ++ | ++ | ||||||||
| Medullary raphe | ++ | ++ | ++ | + | ||||||||
| Parabrachial | +++ | ++ | +− | + | +− | + | +− | |||||
| DMH | ++ | ++ | + | + | ||||||||
| LHA | ++ | ++ | + | + | ||||||||
| PVH | ++ | + | + | + | ||||||||
| PEV | + | + | +− | +− | ||||||||
| SON | +− | + | + | + | ||||||||
| PVT | + | + | + | + | ||||||||
| CEA | ++ | ++ | +− | +− | ||||||||
| BNST dorsal | + | + | + | +− | +− | +− | +− | |||||
| BNST ventral | ++ | +− | ++ | + | +− | +− | + | +− | ||||
| Preoptic region | + | + | +− | +− | + | + | + | + | + | + | ||
Symbols in each cell indicate the relative intensity and incidence of Fos and CRH staining observed after cecal ligation and puncture (CLP) compared to sham surgery: +++, pronounced in all rats; ++ moderate in a majority of rats; + moderate in a minority of rats; +− variable in a minority of rats; no symbol indicates no response. Abbreviations: NTS, nucleus tractus solitarius; LC, locus coeruleus; LSC, locus subcoeruleus; DMH, hypothalamic dorsomedial nucleus; LHA, lateral hypothalamic area; PVH, hypothalamic paraventricular nucleus; PEV, hypothalamic periventricular nucleus; SON, supraoptic nucleus; PVT, thalamic paraventricular nucleus; CEA, central amygdaloid nucleus; BNST bed nucleus of the stria terminalis (dorsal is adjacent to internal capsule and ventral lies ventral to anterior commissure).
Figure 4.
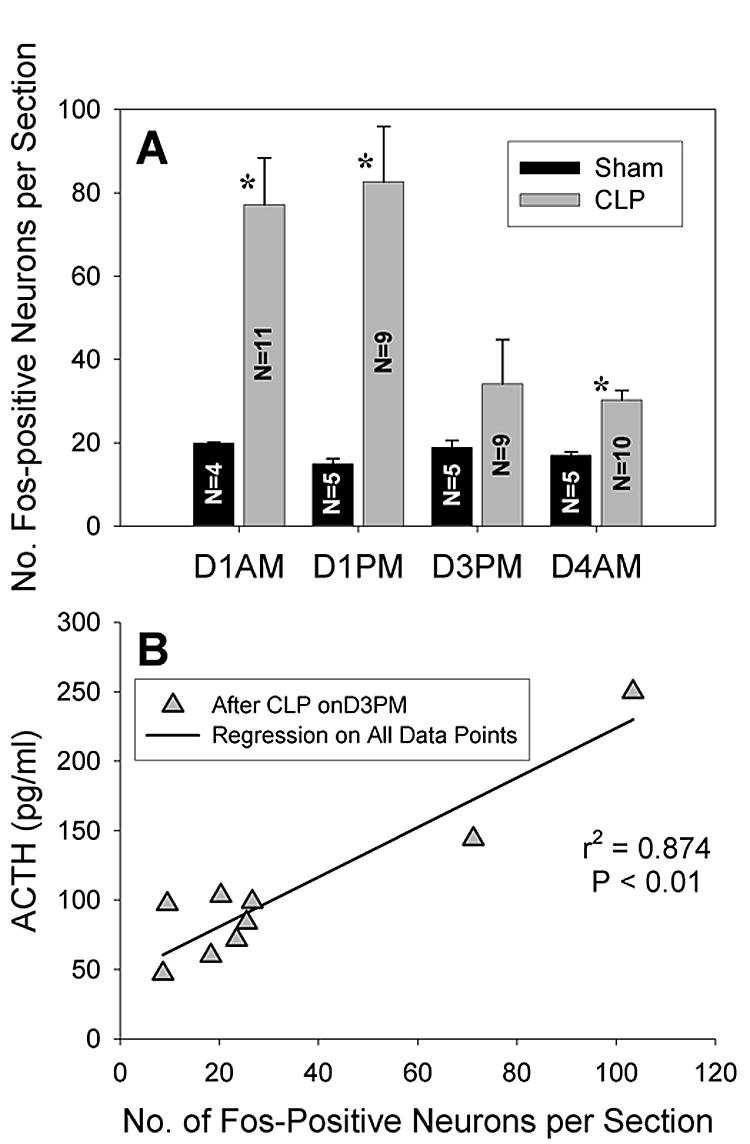
A) Fos expression in the dorsomedial medulla after CLP exceeds sham values (mean responses for CLP groups did not differ for different needle sizes). *P < 0.01 for difference from sham surgery. Note the large standard error of the mean on day 3 in the PM (D3PM) after CLP when the variance exceeds its value on D4AM (P < 0.01). B) Fos expression on D3PM after CLP is correlated to plasma ACTH on D3PM and also to ACTH on D3AM (not shown, r2 = 0.878, P < 0.01).
Within the dorsomedial medulla, a minority of the Fos-positive cells was also immunoreactive for TH (Fig. 5B). Immunostaining for PNMT confirmed that many of the cells that were Fos-positive in the rostral portion of the NTS could synthesize epinephrine and comprised the C2 area (Fig. 5E). More caudal areas of NTS were negative for PNMT but did show Fos-positive cells with reactivity for DBH consistent with inclusion in A2.
Figure 5.
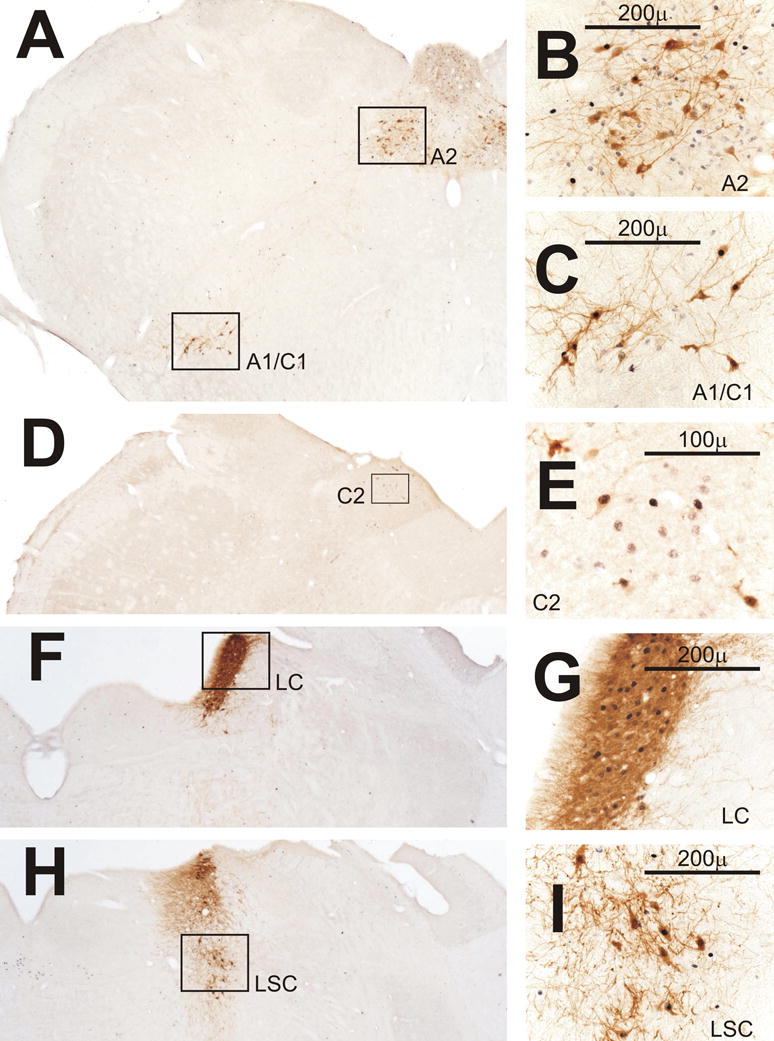
Fos expression in catecholaminergic cell groups after CLP. A) Low power view from a rat perfused on day 1 in the AM (D1AM) after CLP of A2 shown in panel B and of A1/C1 shown in panel C. B) Some A2 neurons in nucleus tractus solitarius (NTS) that stain for tyrosine hydroxylase (TH, brown) are Fos-positive (black). Other TH-negative cells also express Fos. C) Many A1/C1 neurons in the ventrolateral medulla are positive for both Fos and TH. D) Low power view from another rat perfused on D1AM after CLP of C2 shown in panel E. E) C2 neurons in NTS rostral to the area postrema are positive for both phenylethanolamine-N-methyl-transferase (brown) and Fos. F and H) Low power views from a rat perfused on D1PM after CLP of the locus coeruleus (LC) and locus subcoeruleus (LSC) in panels G and I, respectively. G) Many LC neurons positive for TH express Fos. H) Several Fos-positive neurons in LSC are also positive for TH.
In the commissural subdivision of the NTS caudal to the area postrema, immunoreactivity for CRH was not detected after sham surgery except for occasional lightly stained cells observed in the PM of D3. In contrast, CRH was readily detected in this area after CLP (Fig. 6A) from D1 through D4. In both the AM and PM of D1 and in the PM of D3, several of the CRH-positive cells in this area also stained for Fos. At the level of the area postrema in the dorsomedial and medial subdivisions of NTS, CRH-positive cells were absent after sham surgery but did appear on D1 and D3 after CLP (Fig. 6B) with the incidence of double-staining for Fos greatest in the PM of D1.
Figure 6.

Expression of corticotropin releasing hormone (CRH) in the medulla after CLP. Insets in B and C show outlined areas at higher magnification. A) Fos-positive cells in the commissural subnucleus of the nucleus tractus solitarius (NTS) with an example of double-staining for CRH on day 1 in the AM (D1AM). B) CRH-containing neurons among Fos-positive cells in the medial subnucleus of the NTS in another rat on D1AM. C) Neurons stained for both CRH and Fos in the vicinity of nucleus retroambiguous in a third rat on D1AM. Abbreviations: ap, area postrema; cc, central canal.
Responses in the ventrolateral medulla
In both the AM and the PM of D1, Fos was more prominent in the ventrolateral medulla after CLP than after sham surgery. Fos-positive cells were found in a region that extended rostrally from the caudal ventrolateral medulla coincident with the A1 catecholaminergic area into the C1 area. Double-staining for either TH or DBH revealed that a subset the Fos-positive cells were members of A1 (Fig. 5C). In the heart of C1 just rostral to the area postrema, there were groups of PNMT-positive cells where a majority were also reactive for Fos in the rats that responded most vigorously to CLP. Other Fos-positive cells that were negative for the catecholamine-synthetic enzymes were noted dorsally in the vicinity of the nucleus retroambiguous (Paxinos and Watson, 1982) that we will refer to as the periambiguous region (Figs. 5A and 6C). By D3 and D4, Fos of lesser intensity was noted in the ventrolateral medulla in four of nine CLP rats in the PM and in six of 10 CLP rats in the AM.
On D1 after CLP but not after sham surgery, CRH often appeared in several neurons on the dorsomedial aspect of the A1/C1 area in the periambiguous region. The majority of these neurons were also positive for Fos (Fig. 6C). CRH was detected less frequently in this area after D1, but was observed in two brains from D3 and two brains from D4.
Responses in the locus coeruleus and subcoeruleus
On D1 after CLP there was modest to dense expression of Fos in the locus coeruleus in both the well-defined caudal portion of this nucleus (Fig. 5F-G) and the more diffuse rostral portion adjacent to the parabrachial nucleus. At this latter level, Fos was also evident in the subcoeruleus area (Fig. 5H-I) and in the laterodorsal tegmental nucleus but not in the nucleus of Barrington. This pattern of staining persisted in 5 of 9 CLP rats on D3 and in 8 of 10 CLP rats on D4. Double-staining for Fos and either DBH or TH indicated that when Fos expression occurred in the well-defined caudal portion of the locus coeruleus that it was exclusively in catecholaminergic cells (Fig. 5F-G). More rostrally at the level of the brachium conjunctivum some catecholaminergic cells within the locus coeruleus and subcoeruleus were also Fos-positive (Fig. 5H-I), but Fos also appeared in non-catecholaminergic cells. Fos appeared less frequently in the rostral portion of the A5 catecholaminergic area at the level of the parabrachial nucleus and only in the brains showing the most robust responses in the ventrolateral medulla and the locus coeruleus.
Response in the medullary raphe
Increased Fos expression was noted after CLP in raphe magnus and pallidus and the adjoining alpha division of the gigantocellular reticular nucleus (Paxinos and Watson, 1982) about 1.5 mm posterior to the intraaural line (Fig. 7). When Fos was expressed within this area of the medullary raphe, Fos was also observed in the ventrolateral and dorsolateral periaqueductal grey (example not shown) that provides major input to the raphe (Hermann et al., 1997) in a distribution similar to that reported in response to acute administration of endotoxin (Elmquist, et al., 1996). However, Fos of lesser intensity was observed in the ventrolateral grey after sham surgery in some rats, and Fos of similar intensity to that after CLP was seen in the dorsolateral grey. Double-staining for Fos and serotonin indicated that the majority of cells in the raphe magnus, pallidus and adjoining gigantocellular reticular area alpha that expressed Fos were serotonergic (Fig. 7).
Figure 7.
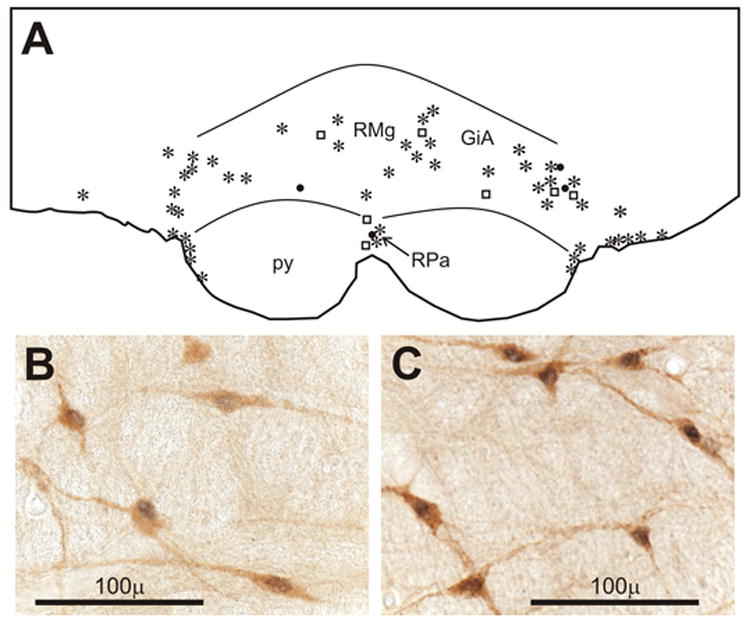
A) Line drawing of a section of the parapyramidal area from a rat perfused on day 4 in the AM (D4AM) after CLP showing the distribution of neurons stained for Fos alone (filled circles), serotonin (open squares), or both (asterisks). B) Doubly stained neurons for serotonin (brown) and Fos (black) from the section in A. C) Doubly stained neurons in same area from another rat perfused on D1AM after CLP. Abbreviations: GiA, gigantocellular reticular nucleus, α; py, pyramidal tract; RMg, raphe magnus; RPa, raphe pallidus.
Response in the parabrachial nucleus
Fos expression in the parabrachial nucleus after CLP was evident in the dorsolateral, central lateral, and external lateral subdivisions (Fig. 8) in a similar distribution to that reported after intravenous endotoxin (Elmquist, et al., 1996). The intensity and frequency of the staining was greater on D1 than on D3 and D4. Small neurons that were double stained for CRH and Fos were observed occasionally in the dorsolateral subdivision of the parabrachial nucleus in the AM of D1 after sham surgery and from D1 through D4 after CLP (Fig. 8B).
Figure 8.
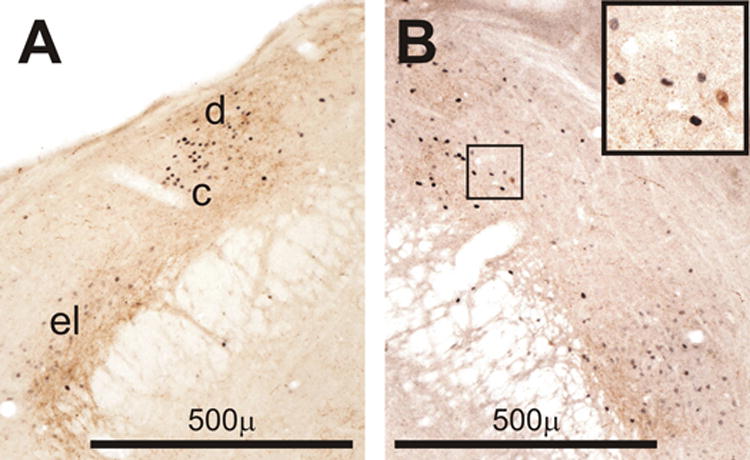
Examples of Fos expression (black) in the parabrachial region of a rat perfused on day 1 in the PM (D1PM, B) after CLP and a rat perfused on D3PM after CLP (B). Brown staining indicates immunreactive corticotropin releasing hormone (CRH). Note the spatial relationship of the CRH-containing processes and the Fos-positive cell nuclei. Inset in the upper right shows a small doubly stained neuron in the outlined area in panel B at higher magnification. Abbreviations of parabrachial subnuclei: c, central lateral; d, dorsolateral; el, external lateral.
Response in the diencephalon
After CLP Fos was observed in several hypothalamic cell groups. Responses were variable (compare the views of the supraoptic nucleus in Figs. 9F-G) but exceeded the expression found after sham surgery in the dorsomedial hypothalamic nucleus (Fig. 9A), the lateral hypothalamic area, portions of the hypothalamic paraventricular nucleus (PVH, Fig. 9D), the periventricular nucleus (Fig. 9B) in the retrochiasmatic and chiasmatic area, and the supraoptic nucleus (Fig. 9F-G). With the exception of the supraoptic nucleus, the intensity of Fos-staining was greater on D1 after CLP than on D3 and D4. When intense staining for Fos was seen in the supraoptic nucleus, it occurred in brains harvested in the PM of D1 or D3 (Fig. 9G). Fos in the supraoptic nucleus and the magnocellular portion of the PVH was most prominent in areas where vasopressinergic neurons predominate (Hou-Yu et al., 1986). Although the arcuate and suprachiasmatic nuclei, the anterior and posterior hypothalamic areas, and the zona incerta often showed faint to moderate staining, similar results were present after sham surgery.
Figure 9.
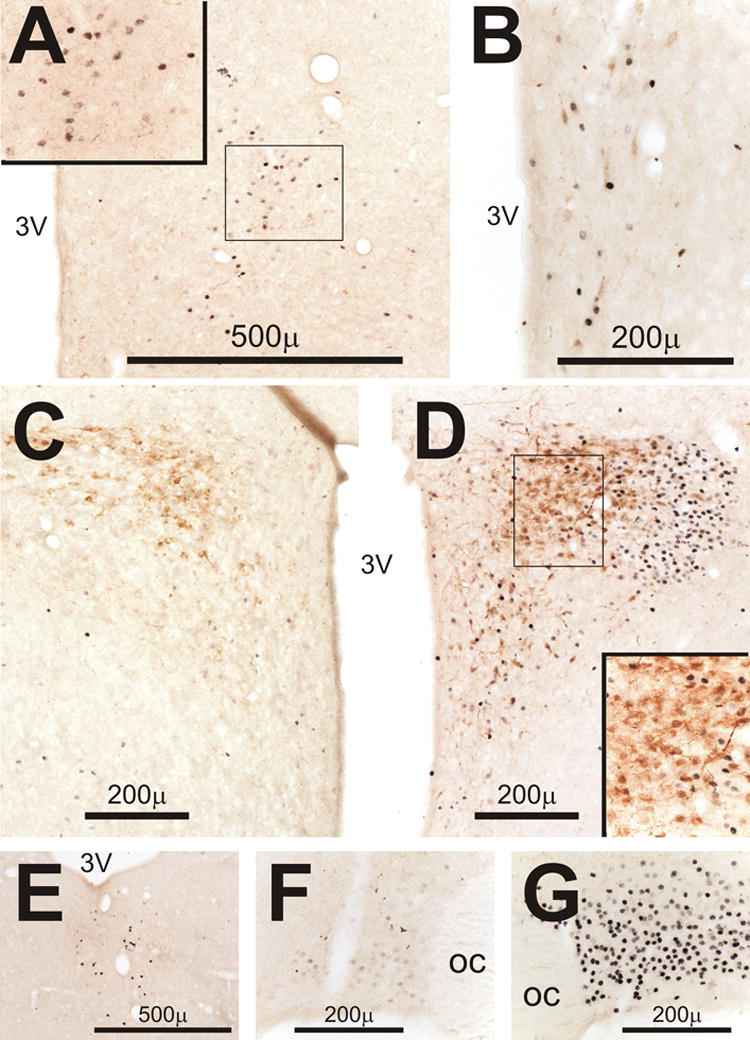
Double-staining in the diencephalon for Fos (black) and corticotropin releasing hormone (CRH, brown). Insets in A and D show outlined areas at higher magnification. A) Fos-positive cells in the dorsomedial nucleus of the hypothalamus on day 1 in the PM (D1PM) after CLP. B) Fos-positive cells with a few small CRH-containing cells in the hypothalamic periventricular nucleus in another rat perfused on D1AM after CLP. C) CRH staining and minimal expression of Fos in the hypothalamic paraventricular nucleus (PVH) on D1PM after sham surgery. D) CRH staining and Fos expression in PVH on D1PM after CLP. Note the minimal staining of Fos in the CRH-containing neurons in inset. E) Fos-positive cells in the thalamic paraventricular nucleus on D3PM after CLP. F) Light staining for Fos in the supraoptic nucleus (SON) on D1AM after CLP. G) Intense Fos staining in SON on D3PM after CLP.
Double staining for Fos and CRH revealed that the majority of Fos-positive cells in the dorsal and caudal portions of the PVH were not positive for CRH (Fig. 9D inset). When doubly stained neurons occurred in this area, they were found in those brains harvested on D1 after CLP with the most intense and widespread Fos responses. Doubly labeled neurons were observed in both the medial and anterior parvocellular divisions of the PVH in the AM and primarily in the anterior division in the PM. Despite the near absence of Fos in CRH neurons within the PVH, the optical density of CRH staining in representative 10000 μ2 fields of the medial parvocellular PVH was greater after CLP than after sham surgery from D1 through D4 (Table 2, overall treatment effect by ANOVA, P < 0.01). In addition, the number of neurons with detectable CRH in the sampled fields was greater after CLP than after sham surgery throughout D1 (Table 2, P < 0.01), but this difference was not present on D3 and D4. The integrated optical density of distinct CRH neurons in the PVH after CLP did not change from D1 through D4 but was greater than that after sham surgery (P < 0.02, Fig. 10A). In addition, the variance of this measure in the CLP groups was greater in both the PM of D1 and D3 than in either the AM of D1 or D4 (P < 0.05 in each case). For the brains harvested in the PM of D3, there was a significant correlation of neuronal staining intensity with both the AM and PM values of plasma ACTH measured on D3 (as shown in Fig. 10B for the PM values) and with adrenal volume (Fig. 10C), but not with plasma corticosterone.
Table 2.
Intensity and detection of CRH immunostaining in 10,000 μ2 fields within the hypothalamic paraventricular nucleus.
Figure 10.

Integrated optical density (OD) of corticotropin releasing hormone (CRH)-containing neurons in the hypothalamic paraventricular nucleus (PVH) is increased by CLP. *P < 0.05 for difference from sham surgery. Note the large standard error of the mean on day 3 in the PM (D3PM) after CLP when the variance exceeds its value on D4AM (P < 0.05). On D3 PM both ACTH (B) and adrenal size (C) are correlated to the integrated OD of CRH neurons in the PVH.
Lightly-to-heavily stained Fos-positive cells appeared in the paraventricular nucleus of the thalamus (PVT, Fig. 9E) on D1 through D4 after CLP. In addition, scattered lightly stained cells were noted in a few cases in the vicinity of mediodorsal, centromedian, and rhomboid thalamic nuclei near the midline especially on D4.
Response in the limbic system and forebrain
Fos appeared in the central nucleus of the amygdala (Fig. 11A-B) with its greatest frequency and intensity on D1 after CLP and a reduced incidence on D3 and D4. CRH-positive neurons and processes were also seen in the central nucleus of the amygdala after both sham surgery and CLP (Fig. 11A-B), but most of the CRH neurons were not Fos-positive. Rather, Fos was found in the area ventrolateral to the CRH-containing cells in the lateral and lateral capsular subdivisions of the central nucleus (Moga and Gray, 1985). In a few cases in the PM of D1 and D3 after CLP, light Fos was observed in the basolateral and medial amygdaloid nuclei.
Figure 11.
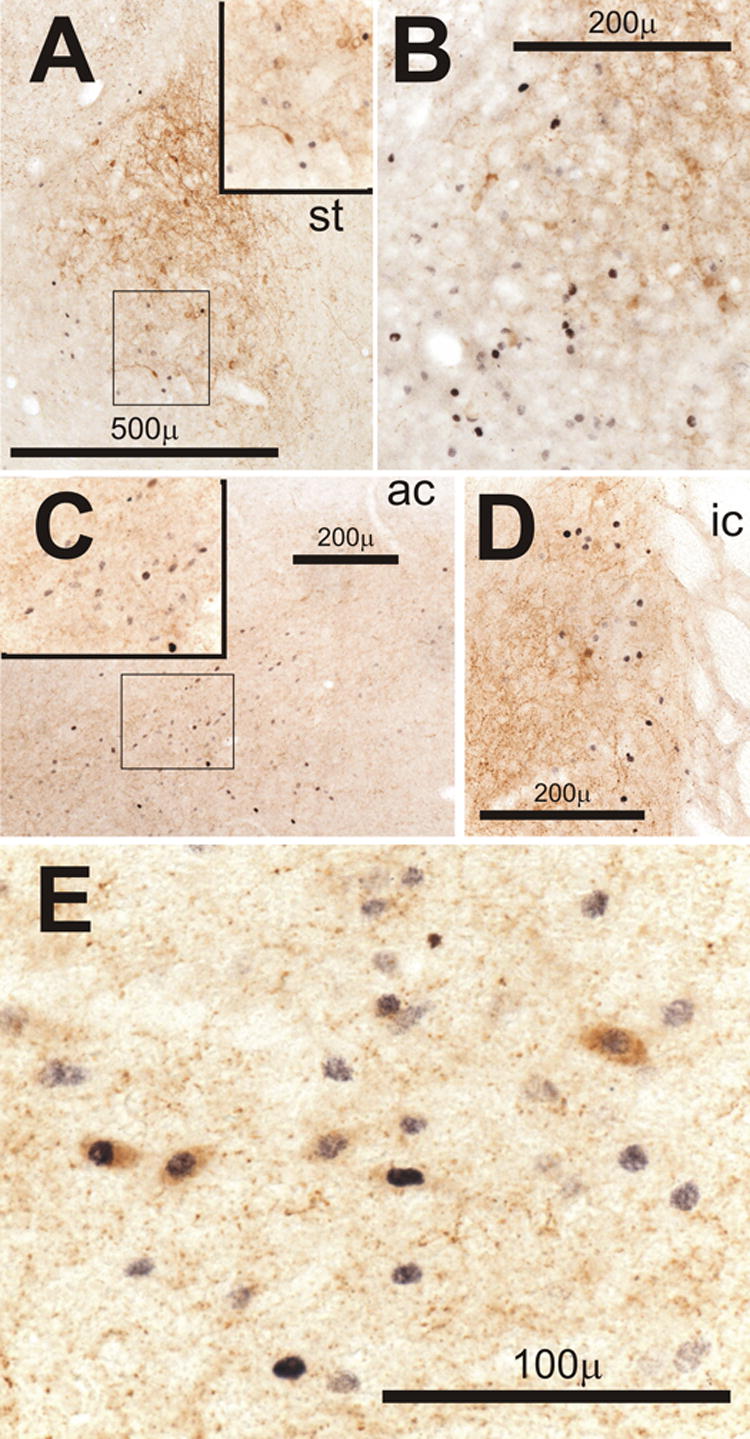
Double-staining in limbic areas for Fos (black) and corticotropin releasing hormone (CRH, brown). Insets in A and C show outlined areas at higher magnification. A and B) Examples of Fos-positive cells in the central nucleus of the amygdala on the ventrolateral aspect of the area containing CRH positive neurons and processes on Day 1 in the AM (D1AM, A) and D1PM (B) after CLP. C) Fos-positive cells in the bed nucleus of stria terminalis (BNST) ventrolateral to the anterior commissure (ac) on D4AM after CLP. D) Fos-positive cells in the BNST adjacent to the internal capsule (ic) among CRH-containing processes in another rat on D4AM after CLP. E) Neurons in the BNST ventral to the ac that stain for both CRH and Fos on D3PM after CLP. Abbreviation: st, stria terminalis.
In the bed nucleus of the stria terminalis, Fos was most prominent in its subdivisions on the ventral aspect of the anterior commissure (Fig. 11C and E) adjacent to the preoptic area and also in the posterolateral and anterolateral subnuclei on the medial aspect of the internal capsule (Fig. 11D). The Fos-positive cells were often situated in fields of CRH-positive processes (Fig. 11C-E). CRH-positive neurons in the bed nucleus were observed occasionally after CLP and were frequently double-stained for Fos (Fig. 11D-E).
In the preoptic area the distribution of Fos-positive cells after CLP was similar to that after intravenous endotoxin (Elmquist, et al., 1996). Fos appeared in a region that extended mediodorsally from the anteroventral preoptic nucleus (Paxinos and Watson, 1982) to the median preoptic nucleus and also laterally into the lateral preoptic area (Fig 12A and C). In those brains with the most intense and numerous Fos-positive cells, Fos was often found in the median preoptic nucleus and in cells adjacent to the cap of the organum vasculosum of the lamina terminalis (Fig. 12C). In brains with lesser responses, CRH-positive neurons with Fos-positive nuclei were frequently observed on D3 and D4 after CLP in an area extending dorsolaterally from the junction of the anteroventral, medial and lateral preoptic areas (Fig. 12B and D). CRH was not detected in this area after sham surgery and was only present in 3 out of 16 brains on D1 after CLP. Brains with the most widespread and intense Fos responses showed Fos surrounding the core of the subfornical organ (Fig. 12E), otherwise Fos was absent or very faint in this structure.
Figure 12.
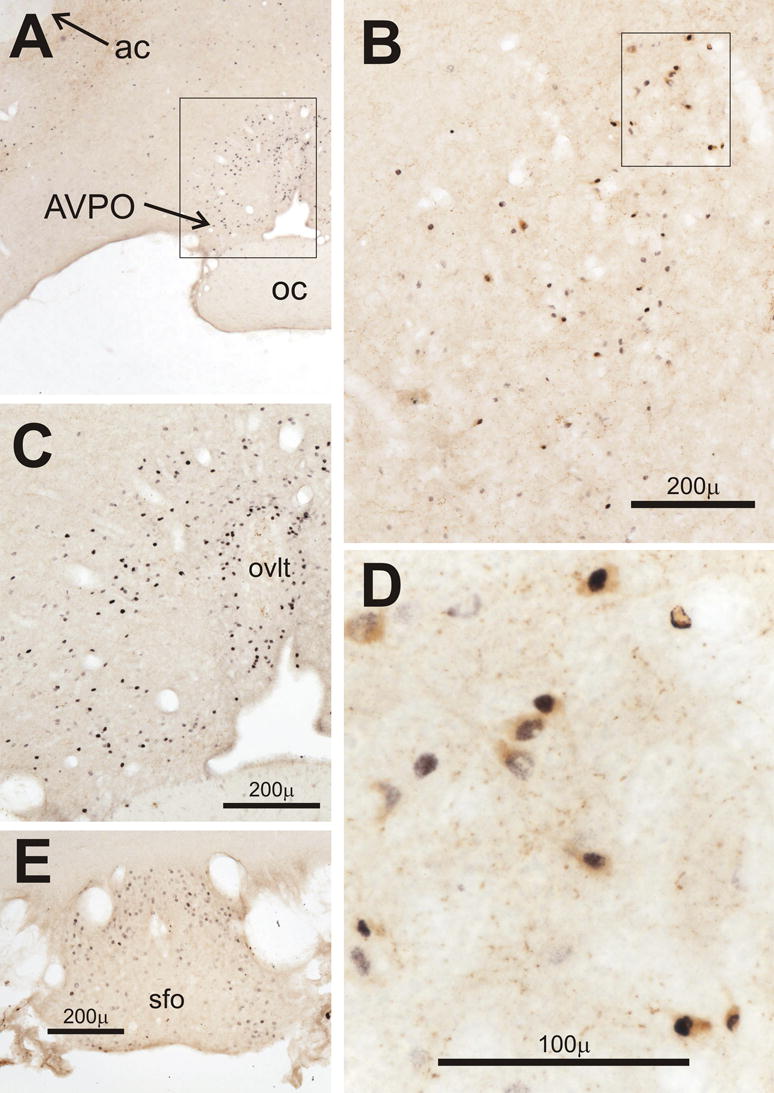
Double-staining in the preoptic and circumventricular areas of the forebrain for Fos (black) and corticotropin releasing hormone (CRH, brown). A and B) Low power views of the outlined areas shown in panels C and D, respectively. C) Fos-expression in the preoptic area and adjacent to the organum vasculosum of the lamina terminalis (ovlt) on day 4 in the AM (D4AM) after CLP. D) Preoptic neurons in another rat on D4AM after CLP that stain for both CRH and Fos. E) Fos-positive cells on the dorsal and lateral aspects of the subfornical organ (sfo) on D3PM after CLP. Abbreviations: ac, anterior commissure; AVPO, anteroventral preoptic nucleus.
A subset of the brains that were perfused was sectioned to examine Fos in the prelimbic, infralimbic, and dorsal peduncular cortices where neurons that innervate the PVH respond acutely to systemic endotoxin (Elmquist and Saper, 1996). Eight of ten brains examined showed modest expression of Fos in these areas on D1 after CLP while only four of twelve had expression on D3 or D4.
Discussion
The central neural response in the CLP model has received little attention. This surgical model mirrors the clinical course of sepsis and recreates a sequence of events that differs from that after a lethal dose of endotoxin in both time course and the release and distribution of inflammatory mediators (Mathiak, et al., 2000; Wichterman, et al., 1980). The presence of peritonitis and a surgically induced cecal abscess in the model may constitute a sustained stimulus to visceral sensory pathways that respond to tissue inflammation (Fleshner et al., 1995; Gaykema, et al., 1995; Kapcala et al., 1996; Wan, et al., 1994).
Our experimental design was based on our earlier report of the hormonal response to CLP (Carlson, et al., 2006). As in the previous study, plasma corticosterone was elevated for up to two days after CLP compared to sham surgery and then settled into the normal diurnal range with AM values that exceeded sham values on D4. Diurnal variation was absent on D3 and D4 after CLP despite its return after sham surgery. The expression of Fos was generally greatest on D1 after CLP suggesting a marked activation of cellular transcription in several areas during the initial hormonal response (Hoffman and Lyo, 2002). The reduced expression of Fos on D3 and D4 after CLP was associated with longer-term responses such as the appearance of CRH in the preoptic nucleus. In contrast, Fos was nearly absent in the CRH-containing cells of the PVH on D1. Responses of immediate early genes in these neurons lasting less than 24 h occur after hemorrhage (Chan, et al., 1993) or adrenalectomy that also causes a delayed increase in CRH mRNA (Brown and Sawchenko, 1997). A similar characteristic may account for the enhanced CRH content of PVH neurons that we observed from D1 through D4 and is present during repeated episodes of restraint (Makino, et al., 1995).
The responsive cells in the NTS included a subset of the neurons within the catecholaminergic A2 and C2 cell groups whose sites of projection include the parvocellular PVH (Cunningham et al., 1990; Cunningham and Sawchenko, 1988). Vagal sensory input from the abdomen implicated in the central neural (Wan, et al., 1994), hyperthermic (Watkins et al., 1995), and hormonal (Fleshner, et al., 1995; Gaykema, et al., 1995; Kapcala, et al., 1996) responses to inflammatory stimuli may have contributed to this response as may the action of circulating mediators on the area postrema (Cunningham et al., 1994). However, Fos appeared in this circumventricular organ only in the rats with the most intense dorsomedullary responses as reported previously during acute inflammation (Elmquist, et al., 1996; Ericsson, et al., 1994).
Fos was expressed in the ventrolateral medulla that receives projections from the NTS (Herbert et al., 1990) in both the noradrenergic cells of the caudally located A1 group and the adrenergic cells of the more rostral C1 area. The A1 area projects to the magnocellular divisions of the supraoptic and PVH nuclei (Cunningham and Sawchenko, 1988), whereas the rostral ventrolateral medulla is implicated cardiovascular control (Reis et al., 1989) and possibly in endotoxin-induced fever (Zhang et al., 2000) through its influence on sympathetic outflow. Additional Fos-positive cells in the ventrolateral medulla were not catecholaminergic and included more dorsally located cells in the vicinity of the nucleus retroambiguous.
Increased expression of Fos occurred in the locus coeruleus and subcoeruleus after CLP that mediate behavioral arousal through the release of norepinephrine from a major projection to the cerebral cortex (Berridge and Waterhouse, 2003) and may also influence limbic and hypothalamic function (Cunningham and Sawchenko, 1988). In sepsis, the locus coeruleus and subcoeruleus could play a critical role in the altered activity and sleep patterns (Ebong, et al., 1999) and in the control of ACTH release (Carlson and Gann, 1991; Carlson et al., 1994).
The responsive subnuclei of the parabrachial nucleus receive converging input from the NTS (Herbert, et al., 1990) and somatosensory structures (Cechetto et al., 1985) and were shown previously to respond to acute administration of endotoxin (Elmquist and Saper, 1996; Elmquist, et al., 1996) and interleukin-1 (Ericsson, et al., 1994). Many Fos-positive cells in this region were found among CRH-containing processes, and occasional small cells in the dorso- and central lateral subnuclei were double-stained for Fos and CRH after CLP. The CRH-containing terminals in the lateral parabrachial region originate in part from the medial and commissural subnuclei of the NTS (Herbert and Saper, 1990) and also from the bed nucleus of the stria terminalis (Moga et al., 1989), the central nucleus of the amygdala (Moga and Gray, 1985), and the lateral hypothalamus (Moga et al., 1990). The enhanced detection of CRH in the NTS and the colocalization of CRH with Fos in the bed nucleus after CLP suggest that the projections from these areas to the parabrachial nucleus are activated during sepsis. Functionally, microinjections of CRH into the dorsal aspect of the parabrachial nucleus in cats elicit increases in plasma ACTH (Carlson, et al., 1994) suggesting a role for the projection from this area to the PVH (Elmquist and Saper, 1996) in the increased density of CRH staining in the PVH after CLP.
The expression of Fos within raphe groups after inflammatory stimuli has been reported infrequently. Fos was found in the raphe magnus (Watkins, et al., 1994) and in the dorsal raphe (Turek and Ryabinin, 2005) after hypothermic ip doses of endotoxin greater than 50 μg/kg, but not in the raphe pallidus after an iv dose of 5 μg/kg (Zhang et al., 2003). The distribution after CLP was restricted to the area shown in Fig. 7A that receives projections from other Fos-positive areas including the preoptic region (Murphy et al., 1999), the bed nucleus of the stria terminalis, the central nucleus of the amygdala, the dorsal and lateral hypothalamic areas, the ventrolateral periaqueductal gray, the parabrachial nuclei, and the subcoeruleus area (Hermann, et al., 1997; Mason, 2001). This restricted area also projects to the preoptic area (Murphy, et al., 1999) and is the source of multisynaptic sympathetic pathways to brown fat and to blood vessels in the tail that induce fever (Smith et al., 1998). CLP induced Fos in serotonergic cells. These neurons respond to preoptic cooling or intracerebroventricular administration of PGE2 and fire at rates in direct proportion to the temperature of brown fat (Nason and Mason, 2006). However, both hyperthermia (Gourine et al., 1998) and hypothermia (Clemmer et al., 1992) can occur during the septic course, and glutaminergic cells in this same medullary area may also contribute to the control of core temperature (Nakamura et al., 2004).
Of the responsive areas in the diencephalon and limbic system, the PVT has been implicated in the suppression of the circadian rhythm of core temperature by chronic stress (Bhatnagar and Dallman, 1999). Furthermore, chronic cold exposure activates cholecystokinin-containing pathways from the parabrachial region to the PVT that suppress the ACTH response to acute restraint (Bhatnagar et al., 2000). The PVT and its sites of projection that include the hypothalamic dorsomedial nucleus, amygdala, bed nucleus of stria terminalis, and infralimbic cortex (Moga et al., 1995) can modulate the PVH (Sawchenko and Swanson, 1983). Projections through the amygdala (Xu, et al., 1999) and the bed nucleus (Crane, et al., 2003) participate in the acute response of ACTH to systemic interleukin-1. Signaling through these areas may also have longer-term effects as suggested by the report that amygdaloid lesions prevent the facilitated ACTH response to repeated hemorrhage (Lilly et al., 2000).
Although CLP induced Fos in many central structures, the use of Fos as a marker has limitations (Hoffman and Lyo, 2002; Hoffman et al., 1993). Neurons inhibited by CLP are unlikely to express Fos, and other cells may respond with firing patterns that occur independently this marker. Chronic stimuli are rarely associated with prolonged expression of Fos. For example long-term suckling fails to induce Fos in oxytocin-containing neurons (Fenelon et al., 1993). Furthermore, intravenous doses of endotoxin (Elmquist, et al., 1996; Zhang, et al., 2003) or interleukin-1 (Ericsson, et al., 1994) increase central Fos for about 6 h with a peak at 2 to 3 h. Improved detection of Fos through the use of optimized fixation and antibodies as in the present study may reveal responses of longer duration, but their intensity frequently declines from the initial peak. Sustained expression of Fos in the NTS and ventrolateral medulla does occur in some experimental models of chronic hypertension (Lohmeier et al., 2002; Lohmeier et al., 2003); and, in contrast to the present findings, CRH neurons in the PVH show a sustained increase in Fos mRNA during chronic insulin-induced hypoglycemia (Brown and Sawchenko, 1997). The areas showing sustained expression of Fos after CLP may reflect unique features in the course of sepsis such as the recruitment of new incoming pathways. Differences in the development of these features among different animals could account for the variability within the responsive areas. For example a difference in the degree of adipsia (Ogimoto et al., 2006) induced by CLP could account for the variable response of Fos in the supraoptic nucleus or the circumventricular organs, a possibility that was not assessed in the present study. Given that Fos is an immediate early gene product that modulates transcription, the role of this variability in the range of outcomes after CLP warrants further investigation.
Our focus on aminergic transmitters and CRH does not rule out important roles for other transmitters and neuromodulators, and the enhanced detection of neuronal CRH does not resolve increased synthesis from decreased transport and release. In addition, our findings are subject to the caveat that the measurement of optical density of CRH-staining in the PVH is not a direct linear measure the neuronal content of the peptide. Nonetheless the measure does indicate an increase in available antigen that is most simply explained by an increase in content. During the chronic stress of sleep deprivation, an increase in CRH immunoreactivity in the PVH parallels the upregulation of CRH mRNA (Koban et al., 2006). Furthermore, our finding that plasma ACTH and adrenal hypertrophy relate positively to the neuronal intensity of CRH-staining in the PVH is consistent with an upregulation of CRH as reported in other models of chronic stress (Brown and Sawchenko, 1997; Makino, et al., 1995).
In aggregate, our findings indicate that CLP leads to the sustained activation of several central pathways that converge in the PVH (Cunningham, et al., 1990; Cunningham and Sawchenko, 1988; Elmquist and Saper, 1996; Sawchenko and Swanson, 1983). Such activation is now referred to as allostatic overload (Schulkin, 2003) and is implicated in pathologies such as posttraumatic stress syndrome that blunt circadian rhythms (McEwen, 2003). Underlying mechanisms include a possible imbalance in central steroid receptors that leads to upregulation of central CRH pathways (De Kloet et al., 1998). We hypothesize that CLP causes intense allostatic overload and upregulation of central CRH to cause immunosuppression (Irwin et al., 1990) and adrenal hypertrophy. Curiously, the content of CRH in PVH neurons and of Fos in the NTS in the PM of D3 after CLP correlates with plasma ACTH but not with corticosterone. This finding is consistent with a suppression of the adrenocortical sensitivity to ACTH in the PM (Carlson, et al., 2006) that is greatest in those rats showing the most marked central responses, but the precise role in these responses in the modulation of the adrenal cortex by CLP remains to be determined.
Acknowledgments
This work was supported in part by National Institutes of Health Grant GM-063050.
Footnotes
Publisher's Disclaimer: This is a PDF file of an unedited manuscript that has been accepted for publication. As a service to our customers we are providing this early version of the manuscript. The manuscript will undergo copyediting, typesetting, and review of the resulting proof before it is published in its final citable form. Please note that during the production process errors may be discovered which could affect the content, and all legal disclaimers that apply to the journal pertain.
References
- Annane D, Bellissant E, Bollaert PE, Briegel J, Keh D, Kupfer Y. Corticosteroids for severe sepsis and septic shock: a systematic review and meta-analysis. Bmj. 2004;329:480–488. doi: 10.1136/bmj.38181.482222.55. [DOI] [PMC free article] [PubMed] [Google Scholar]
- Beishuizen A, Thijs LG. Endotoxin and the hypothalamo-pituitary-adrenal (HPA) axis. J Endotoxin Res. 2003;9:3–24. doi: 10.1179/096805103125001298. [DOI] [PubMed] [Google Scholar]
- Berghorn KA, Bonnett JH, Hoffman GE. cFos immunoreactivity is enhanced with biotin amplification. J Histochem Cytochem. 1994;42:1635–1642. doi: 10.1177/42.12.7983364. [DOI] [PubMed] [Google Scholar]
- Berridge CW, Waterhouse BD. The locus coeruleus-noradrenergic system: modulation of behavioral state and state-dependent cognitive processes. Brain Res Brain Res Rev. 2003;42:33–84. doi: 10.1016/s0165-0173(03)00143-7. [DOI] [PubMed] [Google Scholar]
- Bhatnagar S, Dallman MF. The paraventricular nucleus of the thalamus alters rhythms in core temperature and energy balance in a state-dependent manner. Brain Res. 1999;851:66–75. doi: 10.1016/s0006-8993(99)02108-3. [DOI] [PubMed] [Google Scholar]
- Bhatnagar S, Viau V, Chu A, Soriano L, Meijer OC, Dallman MF. A cholecystokinin-mediated pathway to the paraventricular thalamus is recruited in chronically stressed rats and regulates hypothalamic-pituitary-adrenal function. J Neurosci. 2000;20:5564–5573. doi: 10.1523/JNEUROSCI.20-14-05564.2000. [DOI] [PMC free article] [PubMed] [Google Scholar]
- Bornstein SR, Licinio J, Tauchnitz R, Engelmann L, Negrao AB, Gold P, Chrousos GP. Plasma leptin levels are increased in survivors of acute sepsis: associated loss of diurnal rhythm, in cortisol and leptin secretion. J Clin Endocrinol Metab. 1998;83:280–283. doi: 10.1210/jcem.83.1.4610. [DOI] [PubMed] [Google Scholar]
- Brown ER, Sawchenko PE. Hypophysiotropic CRF neurons display a sustained immediate-early gene response to chronic stress but not to adrenalectomy. J Neuroendocrinol. 1997;9:307–316. doi: 10.1046/j.1365-2826.1997.00586.x. [DOI] [PubMed] [Google Scholar]
- Campbell IT. Limitations of nutrient intake. The effect of stressors: trauma, sepsis and multiple organ failure. Eur J Clin Nutr. 1999;53 Suppl 1:S143–147. doi: 10.1038/sj.ejcn.1600755. [DOI] [PubMed] [Google Scholar]
- Carlson DE. Adrenocorticotropin correlates strongly with endotoxemia after intravenous but not after intraperitoneal inoculations of E. coli. Shock. 1997;7:65–69. [PubMed] [Google Scholar]
- Carlson DE, Babus JK, Nguyuza N, Melhem-Stancofski H, Eastridge BJ. Role of endotoxin in the response to experimentally induced bacteremia in chronically prepared rats. Am J Physiol. 1997;272:R1562–R1570. doi: 10.1152/ajpregu.1997.272.5.R1562. [DOI] [PubMed] [Google Scholar]
- Carlson DE, Chiu WC, Scalea TM. Cecal ligation and puncture in rats interrupts the circadian rhythms of corticosterone and adrenocortical responsiveness to adrenocorticotrophic hormone. Crit Care Med. 2006;34:1178–1184. doi: 10.1097/01.CCM.0000207340.24290.3C. [DOI] [PubMed] [Google Scholar]
- Carlson DE, Gann DS. Response of plasma adrenocorticotropin to injections of L-glutamate or norepinephrine in the dorsal rostral pons of cats. Endocrinology. 1991;128:3021–3031. doi: 10.1210/endo-128-6-3021. [DOI] [PubMed] [Google Scholar]
- Carlson DE, Nabavian AM, Gann DS. Corticotropin-releasing hormone but not glutamate elicits hormonal responses from the parabrachial region in cats. Am J Physiol. 1994;267:R337–R348. doi: 10.1152/ajpregu.1994.267.1.R337. [DOI] [PubMed] [Google Scholar]
- Cechetto DF, Standaert DG, Saper CB. Spinal and trigeminal dorsal horn projections to the parabrachial nucleus in the rat. J Comp Neurol. 1985;240:153–160. doi: 10.1002/cne.902400205. [DOI] [PubMed] [Google Scholar]
- Chan RKW, Brown ER, Ericsson A, Kovacs KJ, Sawchenko PE. A comparison of two immediate-early genes, c-fos and NGFI-B, as markers for functional activation in stress-related neuroendocrine circuitry. J Neurosci. 1993;13:5126–5138. doi: 10.1523/JNEUROSCI.13-12-05126.1993. [DOI] [PMC free article] [PubMed] [Google Scholar]
- Clemmer TP, Fisher CJ, Jr, Bone RC, Slotman GJ, Metz CA, Thomas FO. Hypothermia in the sepsis syndrome and clinical outcome. The Methylprednisolone Severe Sepsis Study Group. Crit Care Med. 1992;20:1395–1401. doi: 10.1097/00003246-199210000-00006. [DOI] [PubMed] [Google Scholar]
- Crane JW, Buller KM, Day TA. Evidence that the bed nucleus of the stria terminalis contributes to the modulation of hypophysiotropic corticotropin-releasing factor cell responses to systemic interleukin-1beta. J Comp Neurol. 2003;467:232–242. doi: 10.1002/cne.10918. [DOI] [PubMed] [Google Scholar]
- Cunningham ET, Jr, Bohn MC, Sawchenko PE. Organization of adrenergic inputs to the paraventricular and supraoptic nuclei of the hypothalamus in the rat. J Comp Neurol. 1990;292:651–667. doi: 10.1002/cne.902920413. [DOI] [PubMed] [Google Scholar]
- Cunningham ET, Jr, Miselis RR, Sawchenko PE. The relationship of efferent projections from the area postrema to vagal motor and brain stem catecholamine-containing cell groups: an axonal transport and immunohistochemical study in the rat. Neuroscience. 1994;58:635–648. doi: 10.1016/0306-4522(94)90087-6. [DOI] [PubMed] [Google Scholar]
- Cunningham ET, Jr, Sawchenko PE. Anatomical specificity of noradrenergic inputs to the paraventricular and supraoptic nuclei of the rat hypothalamus. J Comp Neurol. 1988;274:60–76. doi: 10.1002/cne.902740107. [DOI] [PubMed] [Google Scholar]
- De Kloet ER, Vreugdenhil E, Oitzl MS, Joels M. Brain corticosteroid receptor balance in health and disease. Endocr Rev. 1998;19:269–301. doi: 10.1210/edrv.19.3.0331. [DOI] [PubMed] [Google Scholar]
- Ebong S, Call D, Nemzek J, Bolgos G, Newcomb D, Remick D. Immunopathologic alterations in murine models of sepsis of increasing severity. Infect Immun. 1999;67:6603–6610. doi: 10.1128/iai.67.12.6603-6610.1999. [DOI] [PMC free article] [PubMed] [Google Scholar]
- Ebong SJ, Call DR, Bolgos G, Newcomb DE, Granger JI, O'Reilly M, Remick DG. Immunopathologic responses to non-lethal sepsis. Shock. 1999;12:118–126. doi: 10.1097/00024382-199908000-00005. [DOI] [PubMed] [Google Scholar]
- Elmquist JK, Saper CB. Activation of neurons projecting to the paraventricular hypothalamic nucleus by intravenous lipopolysaccharide. J Comp Neurol. 1996;374:315–331. doi: 10.1002/(SICI)1096-9861(19961021)374:3<315::AID-CNE1>3.0.CO;2-4. [DOI] [PubMed] [Google Scholar]
- Elmquist JK, Scammel TE, Jacobson CD, Saper CB. Distribution of Fos-like immunoreactivity in the rat brain following intravenous lipopolysaccharide administration. J Comp Neurol. 1996;371:85–103. doi: 10.1002/(SICI)1096-9861(19960715)371:1<85::AID-CNE5>3.0.CO;2-H. [DOI] [PubMed] [Google Scholar]
- Ericsson A, Kovacs KJ, Sawchenko PE. A functional anatomical analysis of central pathways subserving the effects of interleukin-1 on stress-related neuroendocrine neurons. J Neurosci. 1994;14:897–913. doi: 10.1523/JNEUROSCI.14-02-00897.1994. [DOI] [PMC free article] [PubMed] [Google Scholar]
- Fenelon VS, Poulain DA, Theodosis DT. Oxytocin neuron activation and Fos expression: a quantitative immunocytochemical analysis of the effect of lactation, parturition, osmotic and cardiovascular stimulation. Neuroscience. 1993;53:77–89. doi: 10.1016/0306-4522(93)90286-o. [DOI] [PubMed] [Google Scholar]
- Fleshner M, Goehler LE, Hermann J, Relton JK, Maier SF, Watkins LR. Interleukin-1β induced corticosterone elevation and hypothalamic NE depletion is vagally mediated. Brain Res Bull. 1995;37:605–610. doi: 10.1016/0361-9230(95)00051-f. [DOI] [PubMed] [Google Scholar]
- Gaykema RPA, Dijkstra I, Tilders FJH. Subdiaphragmatic vagotomy suppresses endotoxin-induced activation of hypothalamic corticotropin-releasing hormone neurons and ACTH secretion. Endocrinology. 1995;136:4717–4720. doi: 10.1210/endo.136.10.7664696. [DOI] [PubMed] [Google Scholar]
- Gourine AV, Rudolph K, Tesfaigzi J, Kluger MJ. Role of hypothalamic interleukin-1β in fever induced by cecal ligation and puncture in rats. Am J Physiol. 1998;275:R754–761. doi: 10.1152/ajpregu.1998.275.3.R754. [DOI] [PubMed] [Google Scholar]
- Herbert H, Moga MM, Saper CB. Connections of the parabrachial nucleus with the nucleus of the solitary tract and the medullary reticular formation in the rat. J Comp Neurol. 1990;293:540–580. doi: 10.1002/cne.902930404. [DOI] [PubMed] [Google Scholar]
- Herbert H, Saper CB. Cholecystokinin-, galanin-, and coticotropin-releasing factor-like immunoreactive projections from the nucleus of the solitary tract to the parabracheal nucleus in the rat. J Comp Neurol. 1990;293:581–598. doi: 10.1002/cne.902930405. [DOI] [PubMed] [Google Scholar]
- Hermann DM, Luppi PH, Peyron C, Hinckel P, Jouvet M. Afferent projections to the rat nuclei raphe magnus, raphe pallidus and reticularis gigantocellularis pars alpha demonstrated by iontophoretic application of choleratoxin (subunit b) J Chem Neuroanat. 1997;13:1–21. doi: 10.1016/s0891-0618(97)00019-7. [DOI] [PubMed] [Google Scholar]
- Hinshaw LB, Beller BK, Chang AC, Murray CK, Floumoy DJ, Passey RB, Archer LT. Corticosteroid/antibiotic treatment of adrenalectomized dogs challenged with lethal E. coli. Circ Shock. 1985;16:265–277. [PubMed] [Google Scholar]
- Hoffman GE, Lyo D. Anatomical markers of activity in neuroendocrine systems: are we all ‘fos-ed out’? J Neuroendocrinol. 2002;14:259–268. doi: 10.1046/j.1365-2826.2002.00775.x. [DOI] [PubMed] [Google Scholar]
- Hoffman GE, Smith MS, Verbalis JG. c-Fos and related immediate early gene products as markers of activity in neuroendocrine systems. Front Neuroendocrinol. 1993;14:173–213. doi: 10.1006/frne.1993.1006. [DOI] [PubMed] [Google Scholar]
- Hou-Yu A, Lamme AT, Zimmerman EA, Silverman AJ. Comparative distribution of vasopressin and oxytocin neurons in the rat brain using a double-label procedure. Neuroendocrinology. 1986;44:235–246. doi: 10.1159/000124651. [DOI] [PubMed] [Google Scholar]
- Irwin M, Vale W, Rivier C. Central corticotropin-releasing factor mediates the suppressive effect of stress on natural killer cytotoxicity. Endocrinology. 1990;126:2837–2844. doi: 10.1210/endo-126-6-2837. [DOI] [PubMed] [Google Scholar]
- Kapcala LP, He JR, Gao Y, Pieper JO, DeTolla LJ. Subdiaphragmatic vagotomy inhibits intra-abdominal interleukin-1β stimulation of adrenocorticotropin secretion. Brain Res. 1996;728:247–254. doi: 10.1016/0006-8993(96)00511-2. [DOI] [PubMed] [Google Scholar]
- Koban M, Le WW, Hoffman GE. Changes in hypothalamic corticotropin-releasing hormone, neuropeptide Y, and proopiomelanocortin gene expression during chronic rapid eye movement sleep deprivation of rats. Endocrinology. 2006;147:421–431. doi: 10.1210/en.2005-0695. [DOI] [PubMed] [Google Scholar]
- Lilly MP, Putney DJ, Carlson DE. Potentiated response of corticotropin (ACTH) to repeated moderate hemorrhage requires amygdalar neuronal processing. Neuroendocrinology. 2000;71:88–98. doi: 10.1159/000054525. [DOI] [PubMed] [Google Scholar]
- Lohmeier TE, Lohmeier JR, Warren S, May PJ, Cunningham JT. Sustained activation of the central baroreceptor pathway in angiotensin hypertension. Hypertension. 2002;39:550–556. doi: 10.1161/hy0202.103003. [DOI] [PubMed] [Google Scholar]
- Lohmeier TE, Warren S, Cunningham JT. Sustained activation of the central baroreceptor pathway in obesity hypertension. Hypertension. 2003;42:96–102. doi: 10.1161/01.HYP.0000076092.10923.FD. [DOI] [PubMed] [Google Scholar]
- Makino S, Hashimoto K, Gold PW. Multiple feedback mechanisms activating corticotropin-releasing hormone system in the brain during stress. Pharmacol Biochem Behav. 2002;73:147–158. doi: 10.1016/s0091-3057(02)00791-8. [DOI] [PubMed] [Google Scholar]
- Makino S, Smith MA, Gold PW. Increased expression of corticotropin-releasing hormone and vasopressin messenger ribonucleic acid (mRNA) in the hypothalamic paraventricular nucleus during repeated stress: association with reduction in glucocorticoid receptor mRNA levels. Endocrinology. 1995;136:3299–3309. doi: 10.1210/endo.136.8.7628364. [DOI] [PubMed] [Google Scholar]
- Mason P. Contributions of the medullary raphe and ventromedial reticular region to pain modulation and other homeostatic functions. Annu Rev Neurosci. 2001;24:737–777. doi: 10.1146/annurev.neuro.24.1.737. [DOI] [PubMed] [Google Scholar]
- Mathiak G, Szewczyk D, Abdullah F, Ovadia P, Feuerstein G, Rabinovici R. An improved clinically relevant sepsis model in the conscious rat. Crit Care Med. 2000;28:1947–1952. doi: 10.1097/00003246-200006000-00043. [DOI] [PubMed] [Google Scholar]
- McEwen BS. Mood disorders and allostatic load. Biol Psychiatry. 2003;54:200–207. doi: 10.1016/s0006-3223(03)00177-x. [DOI] [PubMed] [Google Scholar]
- Minneci PC, Deans KJ, Banks SM, Eichacker PQ, Natanson C. Meta-analysis: the effect of steroids on survival and shock during sepsis depends on the dose. Ann Intern Med. 2004;141:47–56. doi: 10.7326/0003-4819-141-1-200407060-00014. [DOI] [PubMed] [Google Scholar]
- Moga MM, Gray TS. Evidence for corticotropin-releasing factor, neurotensin, and somatostatin in the neural pathway from the central nucleus of the amygdala to the parabrachial nucleus. J Comp Neurol. 1985;241:275–284. doi: 10.1002/cne.902410304. [DOI] [PubMed] [Google Scholar]
- Moga MM, Saper CB, Gray TS. Bed nucleus of the stria terminalis: cytoarchitecture, immunohistochemistry, and projection to the parabrachial nucleus in the rat. J Comp Neurol. 1989;283:315–332. doi: 10.1002/cne.902830302. [DOI] [PubMed] [Google Scholar]
- Moga MM, Saper CB, Gray TS. Neuropeptide organization of the hypothalamic projection to the parabrachial nucleus in the rat. J Comp Neurol. 1990;295:662–682. doi: 10.1002/cne.902950409. [DOI] [PubMed] [Google Scholar]
- Moga MM, Weis RP, Moore RY. Efferent projections of the paraventricular thalamic nucleus in the rat. J Comp Neurol. 1995;359:221–238. doi: 10.1002/cne.903590204. [DOI] [PubMed] [Google Scholar]
- Mundigler G, Delle-Karth G, Koreny M, Zehetgruber M, Steindl-Munda P, Marktl W, Ferti L, Siostrzonek P. Impaired circadian rhythm of melatonin secretion in sedated critically ill patients with severe sepsis. Crit Care Med. 2002;30:536–540. doi: 10.1097/00003246-200203000-00007. [DOI] [PubMed] [Google Scholar]
- Murphy AZ, Rizvi TA, Ennis M, Shipley MT. The organization of preoptic-medullary circuits in the male rat: evidence for interconnectivity of neural structures involved in reproductive behavior, antinociception and cardiovascular regulation. Neuroscience. 1999;91:1103–1116. doi: 10.1016/s0306-4522(98)00677-0. [DOI] [PubMed] [Google Scholar]
- Nakamura K, Matsumura K, Hubschle T, Nakamura Y, Hioki H, Fujiyama F, Boldogkoi Z, Konig M, Thiel HJ, Gerstberger R, Kobayashi S, Kaneko T. Identification of sympathetic premotor neurons in medullary raphe regions mediating fever and other thermoregulatory functions. J Neurosci. 2004;24:5370–5380. doi: 10.1523/JNEUROSCI.1219-04.2004. [DOI] [PMC free article] [PubMed] [Google Scholar]
- Nason MW, Jr, Mason P. Medullary raphe neurons facilitate brown adipose tissue activation. J Neurosci. 2006;26:1190–1198. doi: 10.1523/JNEUROSCI.4707-05.2006. [DOI] [PMC free article] [PubMed] [Google Scholar]
- Nicholson WE, Davis DR, Sherrell BJ, Orth DN. Rapid radioimmunoassay for corticotropin in unextracted human plasma. Clin Chem. 1984;30:259–265. [PubMed] [Google Scholar]
- Ogimoto K, Harris MK, Jr, Wisse BE. MyD88 is a key mediator of anorexia, but not weight loss, induced by lipopolysaccharide and interleukin-1 beta. Endocrinology. 2006;147:4445–4453. doi: 10.1210/en.2006-0465. [DOI] [PubMed] [Google Scholar]
- Paxinos G, Watson C. The Rat Brain in Stereotaxic Coordinates. Academic Press; New York: 1982. [Google Scholar]
- Reis DJ, Ruggiero DA, Morrison SF. The C1 area of the rostral ventrolateral medulla oblongata. A critical brainstem region for control of resting and reflex integration of arterial pressure. Am J Hypertens. 1989;2:363S–374S. [PubMed] [Google Scholar]
- Sawchenko PE, Swanson LW. The organization of forebrain afferents to the paraventricular and supraoptic nuclei of the rat. J Comp Neurol. 1983;218:121–144. doi: 10.1002/cne.902180202. [DOI] [PubMed] [Google Scholar]
- Schulkin J. Rethinking Homeostasis Allostatic Regulation in Physiology and Pathophysiology. MIT Press; Camebridge: 2003. [Google Scholar]
- Smith JE, Jansen AS, Gilbey MP, Loewy AD. CNS cell groups projecting to sympathetic outflow of tail artery: neural circuits involved in heat loss in the rat. Brain Res. 1998;786:153–164. doi: 10.1016/s0006-8993(97)01437-6. [DOI] [PubMed] [Google Scholar]
- Snedecor GW, Cochran WG. Statistical Methods. Iowa St. Univ. Press; Ames: 1989. [Google Scholar]
- Turek VF, Ryabinin AE. Expression of c-Fos in the mouse Edinger-Westphal nucleus following ethanol administration is not secondary to hypothermia or stress. Brain Res. 2005;1063:132–139. doi: 10.1016/j.brainres.2005.09.056. [DOI] [PubMed] [Google Scholar]
- Wan W, Wetmore L, Sorensen CM, Greenberg AH, Nance DM. Neural and biochemical mediators of endotoxin and stress-induced c-fos expression in the rat brain. Brain Res Bull. 1994;34:7–14. doi: 10.1016/0361-9230(94)90179-1. [DOI] [PubMed] [Google Scholar]
- Watkins LR, Goehler LE, Relton JK, Tartaglia N, Silbert L, Martin D, Maier SF. Blockade of interleukin-1 induced hyperthermia by subdiaphragmatic vagotomy: evidence for vagal mediation of immune-brain communication. Neurosci Lett. 1995;183:27–31. doi: 10.1016/0304-3940(94)11105-r. [DOI] [PubMed] [Google Scholar]
- Watkins LR, Wiertelak EP, Goehler LE, Mooney-Heiberger K, Martinez J, Furness L, Smith KP, Maier SF. Neurocircuitry of illness-induced hyperalgesia. Brain Res. 1994;639:283–299. doi: 10.1016/0006-8993(94)91742-6. [DOI] [PubMed] [Google Scholar]
- Watson RE, Jr, Wiegand SJ, Clough RW, Hoffman GE. Use of cryoprotectant to maintain long-term peptide immunoreactivity and tissue morphology. Peptides. 1986;7:155–159. doi: 10.1016/0196-9781(86)90076-8. [DOI] [PubMed] [Google Scholar]
- Wichterman KA, Baue AE, Chaudry IH. Sepsis and septic shock--a review of laboratory models and a proposal. J Surg Res. 1980;29:189–201. doi: 10.1016/0022-4804(80)90037-2. [DOI] [PubMed] [Google Scholar]
- Winer BJ. Statistical Principles in Experimental Design. McGraw-Hill; New York: 1971. [Google Scholar]
- Xu Y, Day TA, Buller KM. The central amygdala modulates hypothalamic-pituitary-adrenal axis responses to systemic interleukin-1beta administration. Neuroscience. 1999;94:175–183. doi: 10.1016/s0306-4522(99)00311-5. [DOI] [PubMed] [Google Scholar]
- Zhang YH, Lu J, Elmquist JK, Saper CB. Lipopolysaccharide activates specific populations of hypothalamic and brainstem neurons that project to the spinal cord. J Neurosci. 2000;20:6578–6586. doi: 10.1523/JNEUROSCI.20-17-06578.2000. [DOI] [PMC free article] [PubMed] [Google Scholar]
- Zhang YH, Lu J, Elmquist JK, Saper CB. Specific roles of cyclooxygenase-1 and cyclooxygenase-2 in lipopolysaccharide-induced fever and Fos expression in rat brain. J Comp Neurol. 2003;463:3–12. doi: 10.1002/cne.10743. [DOI] [PubMed] [Google Scholar]