

Abstract
Currently, measuring ethanol behaviors in flies depends on expensive image analysis software or time intensive experimenter observation. We have designed an automated system for the collection and analysis of locomotor behavior data, using the IEEE 1394 acquisition program dvgrab, the image toolkit ImageMagick and the programming language Perl. In the proposed method, flies are placed in a clear container and a computer-controlled camera takes pictures at regular intervals. Digital subtraction removes the background and non-moving flies, leaving white pixels where movement has occurred. These pixels are tallied, giving a value that corresponds to the number of animals that have moved between images. Perl scripts automate these processes, allowing compatibility with high-throughput genetic screens. Four experiments demonstrate the utility of this method, the first showing heat-induced locomotor changes, the second showing tolerance to ethanol in a climbing assay, the third showing tolerance to ethanol by scoring the recovery of individual flies, and the fourth showing a mouse’s preference for a novel object. Our lab will use this method to conduct a genetic screen for ethanol induced hyperactivity and sedation, however, it could also be used to analyze locomotor behavior of any organism.
Keywords: ethanol, Drosophila melanogaster, tolerance, locomotor behavior, movement analysis, genetic screen, mammal
1 Introduction
Behavioral phenotypes are thought to be an emergent property of the nervous system. The measurement of animal behavior offers us a glimpse into the neural activity of the animal without the invasive drawbacks of inserting electrodes into the brain. We can observe movement to determine circadian rhythms, exploratory behavior (and the associated lack of anxiety), ability and/or motivation to learn a link between two cues, ability to navigate a maze, and changes in locomotor behavior resulting from pharmacological manipulations. Although human observation can quantify such behavior, it is time consuming, labor intensive and carries the risk of experimenter bias. To this end, using computers to automate the collection and analysis of data can be useful.
Our interest in movement analysis stems from our study of ethanol sedation in the fruitfly Drosophila melanogaster as a model for human intoxication. Initially upon exposure to ethanol vapor, flies exhibit a hyperactive phase, followed by in-coordination and sedation (Moore et al., 1998). Lower doses of ethanol can elicit the hyperactive response without consequent sedation.
Withdrawing the source of ethanol vapor allows the flies to gradually recover. This biphasic response (hyperactivity then sedation) seems to parallel humans, who show a loss of inhibition at low doses of ethanol that is overshadowed later by depressive effects. Flies can also develop rapid tolerance to ethanol sedation; with prior exposure 24 hours earlier, a group of flies will recover from a sedating dose of ethanol faster than their naïve counterparts (Cowmeadow et al., 2005).
Multiple techniques have been employed to measure ethanol intoxication in flies. Perhaps the most widespread is the inebriometer (Weber, 1988). It consists of a long vertical tube with a series of slanted mesh baffles; the flies cling to the baffles to avoid falling. As they become intoxicated, they lose postural control and fall down until they elute out the bottom of the apparatus. The mean elution time represents the ethanol sensitivity for a population of flies. Another method that has been used is the inebri-actometer (Parr et al., 2001). This apparatus consists of a set of 128 narrow tubes, equipped with photodiode emitter/detectors and connected in a grid to a computer. Ethanol vapor is pumped through the system and when a fly crosses the midpoint of its tube, the computer records the movement. A third method is to expose groups of flies to ethanol vapor while in vertical tubes and visually count the number of intoxicated flies at regular intervals (Wen et al., 2005; Cowmeadow et al., 2005). A fourth method, developed by the Heberlein lab, involves a sophisticated program called Dynamic Image Analysis System (DIAS). Flies are placed in a clear, shallow box and ethanol is pumped into the box while a camera above videotapes the flies. DIAS calculates the position of the flies and computes aspects of their movement such as bouts of activity, velocity and turning behavior (Wolf et al., 2002). These methods have identified a number of candidate genes that affect the actions of ethanol on flies, including amn, barfly, tipsy, cex, ccb, vap, fasII, TβH, iav, and slo (Moore et al., 1998; Singh and Heberlein, 2000; Scholz et al., 2000; Cheng et al., 2001; Scholz, 2005; Cowmeadow et al., 2005). In addition, these methods have identified the npf circuit and the cAMP pathway in insulin producing cells as being involved in ethanol behavior (Wen et al., 2005; Corl et al., 2005).
Though past work has yielded many tolerance and sensitivity mutants, the methods used have limitations. The inebriometer has been used most commonly in the past and is the best suited to screening large numbers of mutations. However, it can only measure the knockdown phase of intoxication (Leibovitch et al., 1995; Moore et al., 1998; Singh and Heberlein, 2000; Berger et al., 2004). As has been demonstrated with other assays, flies become hyperactive when exposed to ethanol before becoming sedated (Moore et al., 1998). The inebriometer is unable to separate the two effects; a fly may fall through the apparatus because it has lost consciousness or it may fall because its hyperactivity leaves it unable to grip the baffles. Hyperactivity and sedation phases likely represent an important distinction in the human ethanol response. The inebri-actometer (Parr et al., 2001) solves this problem but introduces another. Because there are multiple tubes feeding into the apparatus, extreme care must be exercised to ensure that each tube is conducting the same flow rate of ethanol vapor. In its first published study, one of the trial runs showed a significant row effect (Parr et al., 2001). Direct visual observation of the negative geotactic response and postural control has been used by multiple labs, including ours (Berger et al., 2004; Ghezzi et al., 2004; Wen et al., 2005; Cowmeadow et al., 2005). While this is certainly a thorough way to quantify sedation, it is also labor-intensive and therefore not well suited to the large volume of measurements inherent in a genetic screen. Thus, the greatest strength of Drosophila as a model system, the ability to perform high-throughput genetic screens, can be difficult to utilize in the study of ethanol responses because the assays are time-consuming and require individual attention. A natural solution to this problem is computer monitoring of behavior. To be effective, the approach should be inexpensive and scalable.
We have created a system that could be adapted to large screens and that has the longevity to be used by other labs in the future. For most responses to alcohol (sedation, tolerance, hyperactivity), a computer need only to detect whether movement has occurred or the relative amount of movement among a population in order to be useful. Other activity monitoring programs have been described in the literature. The image analysis program DIAS has been used to document complex responses to alcohol but unfortunately, it is not readily scalable (Wolf et al., 2002). Although developed independently, the proposed method is similar to these older methods in that all use the digital subtraction of images to determine when the animal moves (Hasegawa et al., 1988; Hoy et al., 1996; Cole and Cheshire, 1996). Some of these previous methods might have been able to meet our needs. Unfortunately, these previous programs are no longer available and all use proprietary software and/or hardware that no longer exists. The methods that we describe use only open source software tools and run interchangeably on different hardware platforms (we have used Mac OSX, Windows XP and Linux, although the data in this paper was all analyzed with a computer running Linux). Open source tools tend to have greater permanence than closed source since they are maintained by communities and they can be modified by the end user. It also is not limited to a single camera system or computer platform. It is readily available to the public, and can be modified by future users, provided that they have a general understanding of the programming language Perl.
In the proposed method, a camera records images of a group of flies at a regular interval and the images are analyzed to provide an estimate of the population movement at any given moment. The collection and analysis of data can proceed in an automated fashion. Unlike visual observation, a much larger quantity of flies can be tested with a relatively small investment of time and effort. The technique offers the ability to measure various aspects of ethanol intoxication, such as the hyperactivity phase, the knockdown to sedation, and the recovery from sedation. It can be implemented in a lab with relatively low start up costs; the software is free and the only required equipment is a standard computer and any camera capable of interfacing with that computer. The number of groups of flies that can be observed concurrently is limited only by the visual field of the camera. We plan to apply it towards a genetic screen, but with minor modifications it could be adapted to many situations where analysis of locomotor activity is needed, including studies with mammals.
2 Methods
2.1 Fly Maintenance
Flies were raised on cornmeal/agar medium and newly eclosed flies were collected over a two day period and tested five days later unless otherwise noted. No anesthesia was used prior to behavioral experiments; transfer of flies was done using mouth-applied suction through a flypette (a trimmed yellow pipet tip shoved into a section of plastic tubing, with a small piece of nylon mesh acting as a barrier to prevent flies from being sucked through).
2.2 Image Acquisition
Flies were placed in shallow, transparent containers. The containers were either placed horizontally and a video camcorder (Canon ZR80) was positioned above looking down, or placed vertically and a video camera was placed in front viewing the container from the side. A black plastic sheet was used as a drape to reduce glare from the overhead lights and two compact fluorescent lights (Sylvania CF23EL/MINITWIST, 23W, 120V, 60Hz, 0.39A) were angled towards the flies. Alternately, the light source was placed behind or below the dishes, with a piece of translucent white plastic placed between the dishes and the lights.
The camcorder was connected via an IEEE 1394 link to a computer running linux on an x86 processor. The video camera provided 30 frames per second, and the open source acquisition program dvgrab (GNU General Public License) collected still images at regular intervals. The basic form of the command is
dvgrab –format jpeg –every N filename
where N specifies that the program records every ”Nth” frame. Since the baseline frame rate is 30 frames per second, N=1 would mean 30 frames per second, N=30 would mean one frame per second and N=1800 would mean 1 frame per 60 seconds. The output of this command is a sequence of consecutively numbered jpeg images of the form: filename001-00000001.jpg.
In addition to the Canon ZR80 camcorder, a Canon Powershot G3 was used to acquire images in the Tolerance First Movement Assay. In this instance, the camera was connected to a laptop running Windows XP via USB and the program Zoombrowser EX 5.6 (which is packaged with Canon digital cameras that have the ability to do remote shooting) was used to collect the images at regular intervals.
2.3 Image Analysis Methods
We wrote three Perl programs to handle our different image analysis needs: sliding window.pl, compare2first.pl and compare2first staggered.pl. They can be obtained at http://file.biosci.utexas.edu/faculty/neuroweb/lab/software.html. These programs invoked commands from an image software toolkit called ImageMagick. One of the images to be analyzed was opened with a third party image editing program (we used GIMP) and the dimensions of an arena (the region of the image that corresponds to a group of flies being analyzed) and the coordinates of each arena’s top left corner were determined. All arenas needed to be the same shape and size within an analysis run. These coordinates and dimensions were entered into the Perl program, along with the total number of arenas, by manually inserting the values into the program with a text editor. Once a particular set up has been established and fixed in place, the process of selecting and entering dimensions and coordinates does not need to be repeated for each experiment. This makes the analysis as simple as putting the images to be processed in the same directory as the Perl program and starting it. Each program used the following ImageMagick commands (more detailed descriptions of the use of these commands follow):
mogrify -depth 8
mogrify -colorspace gray
convert -crop
composite -compose difference
mogrify -modulate 300
2.3.1 Sliding Window Method
Sliding window.pl is used to measure locomotor activity per unit time. To run the program, the following command is typed into the console:
perl sliding window.pl X *.jpg
where X is the total number of frames (the window) to be combined into each final composite image (this number needs to be a power of 2) and *.jpg denotes the sequence of raw images to be analyzed.
Sliding window.pl automates the following process. For each arena to be analyzed, the region is extracted by cropping. These images are converted from 16-bit color to 8-bit grayscale, then digitally subtracted in consecutive and non-overlapping pairs, producing a sequence of difference images in which the background and non-moving flies have disappeared. Each composite image represents the subtraction of two raw images. After all of the raw images have been subtracted, the entire process of subtraction repeats, now using the the previously generated composite images to create new composite images (with each now being produced from four of the original images). This pairwise subtraction process repeats until there is one composite image for every window of X original images, satisfying the X parameter above. For instance, using X=4 (four raw images per window) causes the program to undergo two rounds of pairwise subtraction, X=8 (eight images per window) causes three rounds, etc. Increasing the X parameter reduces the time resolution of any changes in movement, but it allows a larger volume of data to be condensed into a more manageable number of data points. The final images are renamed and the contrast is increased.
2.3.2 Compare to First Method
Compare2first.pl is used to measure the time it takes a non-moving group of animals to begin moving again.
To run the program, the following command is typed into the console:
perl compare2first.pl *.jpg
Where *.jpg denotes the collection of images to be analyzed. The program crops each image to a single arena, converts it to 8-bit grayscale, then subtracts the first image from each subsequent image. The composite images (the difference between each image in the sequence and the first image) are renamed, converted to grayscale and the contrast is increased.
The application of this method is to detect when a non-moving animal begins to move. In the first image, all animals are at a baseline, non-moving position. As long as no movement occurs in subsequent images, the composite images (subtractions) will contain little to no white pixels. As soon an animal moves from its baseline location, the composite images will show white pixels.
Whether that animal moves once then stays put, or continues to move around, the amount of white signal generated will remain fairly constant. When all the animals in the field of view have moved from their baseline location, the amount of white pixels in the composite images will plateau at a maximum value.
An alternate application of this method is to detect ”where” an animal is within a given region. To do this, the first image should be identical to the rest of the images except that there is no animal present. It is simply a picture of the background. Instead of having each arena correspond to the entire field of movement for a given animal, the field is divided into several arenas. Each arena is analyzed to measure the number of white pixels it contains, and at each timepoint, the arena with the most white pixels corresponds to the location of the animal at that moment.
2.3.3 Compare to First Staggered Method
Compare2first staggered.pl is used in the same cases as compare2first.pl, except that the initial image (the one being subtracted from the others) is different for each group of flies being analyzed.
In some cases, the sedative must be given to each group of flies by hand (by transferring them from a clean vial to a drug coated vial), and so the different groups begin their dose (and their recovery from that dose) at different times. The program compare2first staggered.pl takes this into account.
The use and utility of this program is identical to compare2first.pl. For the first arena (the region of the image representing the first group of flies to be analyzed), the baseline image is the first in the sequence. However, for the second arena, the comparison image is the second in the sequence (the first in the sequence is ignored because at that point in time those flies have not yet begun their recovery).
2.4 Quantification of White Pixels
The subtracted images that the Perl programs create are 8-bit grayscale images that appear to consist of a black background with white flies where motion has occurred.
The following command is used to analyze the white content of the pictures
perl quantify.pl X *.jpg > filename.txt
Where X is the threshold for white (default is 72; inputting 0 will default to this), *.jpg represents the images to be quantified (if the original images are still in the folder, then the string must be modified to exclude the originals), and filename.txt is the tab-delimited output file.
The default of 72 was chosen by doing empirical tests and choosing a value that maximized the white pixels produced my movement of the fly while minimizing noise. After quantify is run, the resulting pixel counts can be reviewed alongside a few examples of the images that were analyzed. If noise levels are too high, meaning that there are pixels being counted in frames where no movement is taking place, the quantify.pl program can be run again with a higher (more strict) threshold value.
This program calls up a histogram of each image using the ImageMagick command ”identify -verbose” and tallies up all the pixels at the white threshold and higher (i.e. - the ones ”whiter” than the cutoff). The output is a two column list of the image files analyzed and the number of pixels above threshold for each image.
2.5 Canton S/parats1 temperature experiment
Age matched (3–5 days old), mixed male and female flies were used in this experiment under the presumption that courting behavior would increase movement. Two genotypes were used: Canton S flies (CS, a common wild type strain) and parats1, a temperature sensitive paralytic in which the restrictive temperature causes paralysis via inactivation of a sodium channel.
A PCR thermocycler was used as a programmable heat source. A piece of foil covered the metal block, and a kimwipe was laid over the foil to provide a white background for the pictures. Flies were tapped down onto the kimwipe then quickly covered with the lid of a small Petri dish (40mm in diameter and 5mm high). There were approximately the same number of flies in each group (22 CS flies and 24 parats1 flies).
The thermocycler was set to 20°C for five minutes. It then cycled between five minutes at 40°C and ten minutes at 20°C, for five cycles. The video camera was positioned above the flies with a tripod and, controlled by the computer, collected data at 10 frames per minute. Sliding window.pl was used for analysis with four frames per window.
2.6 Tolerance Climbing Assay
Flies were divided into two groups, experimental and control. The experimental group was treated with ethanol as described previously (Cowmeadow et al., 2005). Briefly, flies were placed into glass vials (with diameters of 23mm and lengths of 95mm) with small holes in the bottom, and air was pumped into the top of the vials at a flow rate of 15 ml/min. For the experimental group, the air was bubbled through water, then twice through heated (65°C) ethanol to produce an ethanol saturated air stream; for the control group the air was only pumped through water. Treatment continued until all flies in the experimental group lost their negative geotactic response (i.e. - they were no longer climbing and had fallen to the bottom of the vial). Flies were then removed to their food vials, with the vials on their sides until the sedated flies recovered.
Four hours after the end of the first treatment, flies were returned to the treatment apparatus and all flies received ethanol. A fluorescent light box lit the vials from behind and a Canon ZR80 digital video camera captured images at one frame per second. When all flies had become sedated, the air source was switched back to humidified air and the flies were allowed to recover. The compare2first.pl program was used to analyze the recovery data.
2.7 Tolerance First Movement Assay
In this experiment, treatment proceeded identically to the Tolerance Climbing Assay, except that 24 hours elapsed between the first and second treatment. Also, after all flies were sedated on the second day, they were removed from the treatment apparatus and placed individually into the wells of a plastic 96 well plate using a flypette. Seven minutes and eighteen seconds elapsed between the end of their ethanol treatment and the start of the image acquisition. In this experiment, the 96 well plate was horizontal, resting on a piece of glass covered with white paper, and the two compact fluorescent lights were positioned one foot below the glass. The camera (Canon G3) was positioned above, and it captured an image once every ten seconds.
Analysis was performed with sliding window.pl, with the window size set to 2. The composite images were visually examined to identify instances in which the fly had completely displaced its position between two raw images. The pixel count for the subtraction of these examples was determined to be around 450 pixels, and this was used to represent the quantify of white signal produced when a fly moved completely to a new position. In the tolerance assay, once a fly moved enough to produce 450 white pixels in the composite image, it was considered to have recovered from sedation. While this simplifying assumption is rather arbitrary, the use of it produces an outcome that matches well the manual scoring of flies for ethanol tolerance. The recovery times for the experimental group following their second dose of ethanol were compared to the recovery times for the control group following their first dose of ethanol on the test day. Prior ethanol sedation has been shown to induce behavioral tolerance and to cause flies to recover more rapidly from sedation (Cowmeadow et al., 2005).
2.8 Mouse Novelty Assay
The FVB mouse was housed in the University of Texas Vivarium, which is AAALAC accredited, and was treated within the guidelines of the National Institutes of Health (Council, 1996). The naive mouse, prior to and after use, had 24 hr ad libitim access to standard rodent chow, water and 12 hr : 12 hr lighting. The mouse was videotaped in a test cage consisting of a standard plastic rat cage (19″ w × 10.5″ l × 8″h) with black plastic attached to the bottom. A digital camcorder recorded the animal moving around the test cage for fifteen minutes, then it was returned to its home cage with food and water for five minutes. A mouse toy consisting of interlocking plastic walls was placed on the left side of the cage and attached with tape. The mouse was returned to the test cage and recorded in the presence of the toy for 15 minutes, then returned to its home cage for five minutes. The toy was removed and the animal spent another 15 minutes in the test cage. Analysis was done by using compare2first.pl with an empty cage (with or without the toy in place) as the first comparison image. The area of the cage was divided into 40 different zones, and the location of the mouse was scored as being the zone with the most white signal. Visual scoring was done by looking at each image and recording whether the majority of the mouse was on the right or the left side of the cage.
3 Results
The basic form of the image analysis can be seen in Figure 1. A camera delivers a sequence of images captured at regular intervals (Fig. 1a–d), and each pair of images in the sequence are subtracted from one another to produce two composite images (Fig. 1e–f). In the composite images, the background and any non-moving flies have disappeared. Since in both cases (between Fig. 1a and Fig. 1b, and between Fig. 1c and Fig. 1d) the fly moved, each subtraction produced an image of two flies – one from its location in the first image and one from its location in the second image. These two composite images can be pair-subtracted again to yield another composite image (Fig. 1g). The four white flies seen in Figure 1g correspond to the fact that two movements occurred during the time interval.
Figure 1.
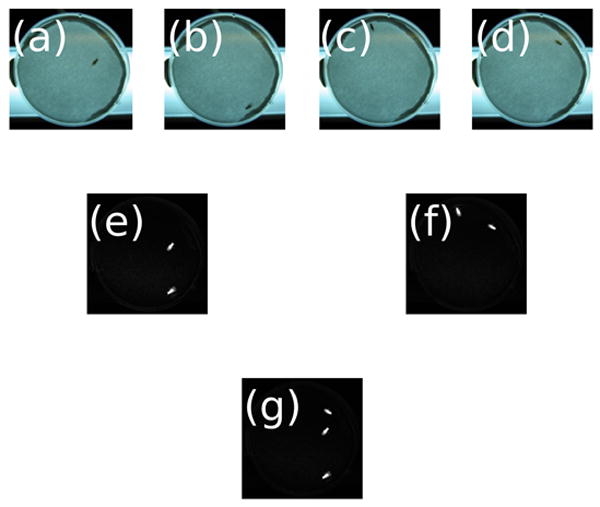
The sliding window method shows movement of a single fly. The four images on the top row (a–d) represent a single fly in a shallow dish at four consecutive time points. Digitally subtracting (a) from (b) yields (e) and digitally subtracting (c) from (d) yields (f). The background disappears and white files on a black background show that movement took place. Digitally subtracting (e) from (f) gives (g), an image where the four white flies represent the fact that two movements occurred during the interval measured (the maximum possible).
In order to test the ability of sliding window.pl to measure locomotor activity, we recorded the activity of wild type flies and the temperature sensitive paralytic mutant, parats1, at the permissive and restrictive temperatures. A thermocycler was used to cycle between the two temperatures and sliding window.pl was used to analyze the data. At the restrictive temperature, parats1 becomes paralyzed (Suzuki et al., 1971). As seen in Figures 2 and 3, Canton S and parats1 flies responded in opposite ways to high and low temperature. At 20°C, the Canton S flies moved very little and the parats1 moved much more. During the intervals when the heat block beneath the flies was heated to 40°C, the Canton S flies increased their activity while the parats1 flies showed a spike of activity, then stopped moving as the temperature inside the dish reached the restrictive temperature and the paralysis occurred. In the figures, white pixels indicate movement. The arrows in Figure 3 denote the data samples shown in Figure 2.
Figure 2.
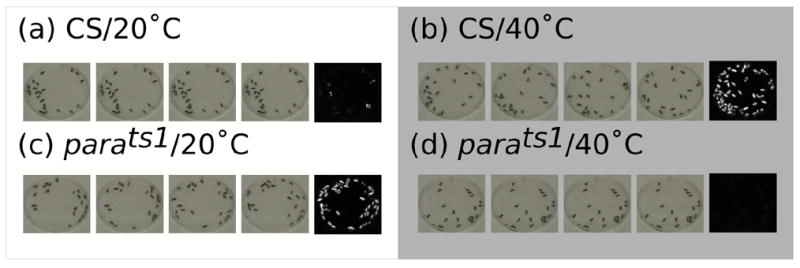
Changes in temperature affect the locomotor behavior of flies. Two groups of flies, one Canton S (wild type) and one parats1 (temperature sensitive paralytic mutant) are corralled under small petri dish lids resting on top of the metal block of a thermocycler. For each condition, a sequence of four images from the same dish is followed by a composite image created by sliding_window.pl. Canton S flies showed very little movement at 20°C (a) and greatly increased their movement when the heat block heated up to 40°C (b). Parats1, on the other hand, moved around at 20°C (c) and, after the paralysis began, showed zero movement at 40°C (d).
Figure 3.
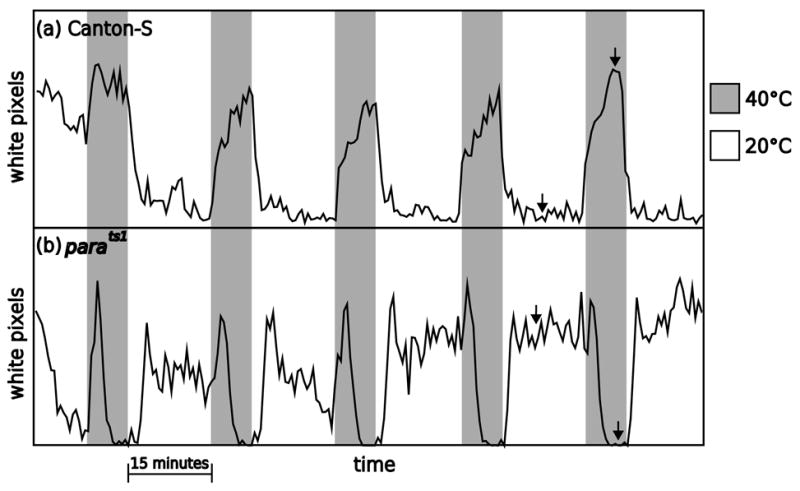
Heat pulses elicit repeatable effects on the movement of flies. This is a summary plot of the sampled data shown in Figure 2; arrows show the locations of the image sequences. The original images were collected at 10 frames per minute. The y axis is the number of white pixels above threshold (72 on a 256 greyscale) and each data point comes from the analysis of four raw images (meaning that it corresponds to 24 seconds). Shaded regions represent times when the heat block heated up to 40°C. During these intervals, Canton S increased their activity and parats1 briefly increased their activity, then as the chamber reached the restrictive temperature, the paralysis began and they ceased moving. The non-shaded regions represent intervals when the heat block cooled down to 20°C. During these times, Canton S decreased their activity and parats1 increased their activity.
While it was expected that the behavior of CS and parats1 flies would differ greatly at the restrictive temperature (activity vs. paralysis), it was not expected that these genotypes would show such different activity levels at the permissive temperature. We were surprised that there appeared to be a ”rebound effect” of paralysis in that fly activity increased following temperature induced paralysis.
In a second experiment, wild type flies were either given a sedating dose of ethanol vapor or mock treatment (as a control). Four hours later, both groups were sedated with ethanol and their recovery was quantified using the program compare2first.pl. The bottom of the vials was not included in the cropped regions in order to exclude movement other than climbing (e.g., twitching). This was done by examining the first image taken (where the flies were sedated and lying at the bottoms of the vials) and selecting arena locations that did not include the sedated flies. Figure 4 shows composite images of the recovery of the flies, sampled every five minutes. Figure 5 shows a plot of the entire recovery. The data being plotted were normalized by dividing the raw pixel count by the maximum white pixel count seen in the duration of the trial. There were different numbers of flies in each vial and therefore the raw number of white pixels plateaued at different levels. Dividing by the maximum number of pixels eliminated this problem.
Figure 4.
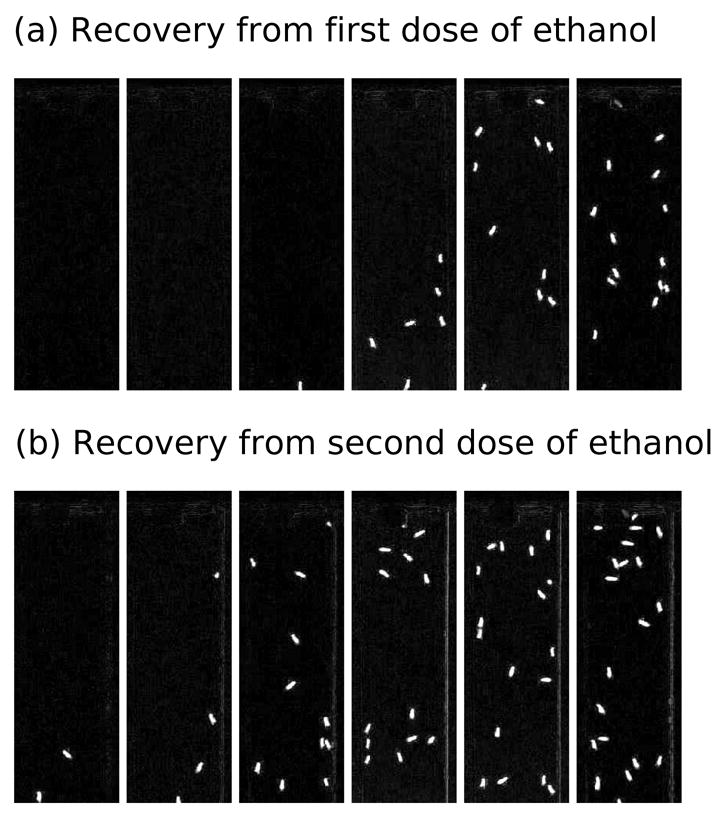
Flies recover from a second dose of ethanol more quickly than from a first dose. These composite images come from subtracting the first image of the sequence from all the subsequent images (using compare2first.pl). Images are shown at five minute intervals. The flies in (a) are recovering from their first ethanol sedation, and the flies in (B) were sedated four hours earlier, making this their second recovery.
Figure 5.
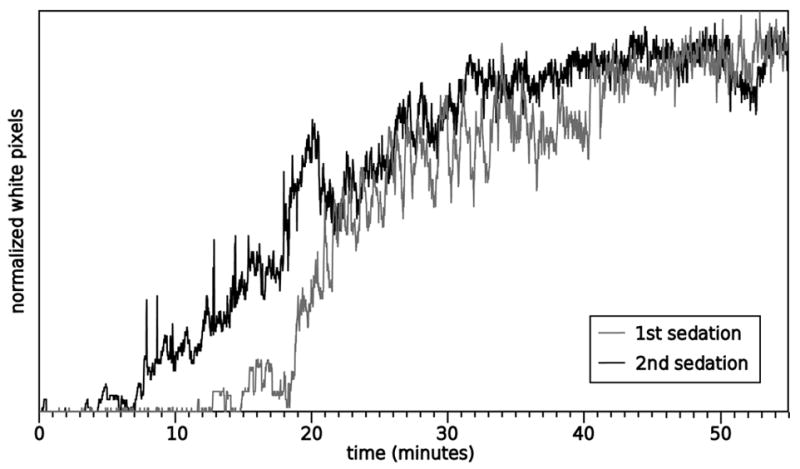
Wild type flies show rapid tolerance to ethanol in a climbing assay. This is the summary plot of the data shown in Figure 4. Images were taken at one frame per second and the y axis represents the white pixels above threshold divided by the maximum number of white pixels (this was necessary because the number of flies in each vial was not equal).
Tolerance to ethanol was also measured another way. After the final sedation, flies were individually transferred to the wells of a 96 well microtiter dish. Sliding window.pl was used to analyze the images, and when the images produced 450 white pixels, that fly was scored as having recovered from sedation. Prior to the scoring of recovery, we examined several of the images and determined that the complete displacement of the fly from one position to another produced approximately 450 white pixels. Figure 6 shows that prior sedation led to a significantly faster recovery time (p¡0.01, n=22). The control group took 34.9 ± 5.7 minutes to recover, and the experimental group (with a sedation 24 hours prior) took 15.4 ± 1.8 minutes to recover. Significance was determined by Student’s t test and error bars were determined by standard error of the mean (SEM).
Figure 6.
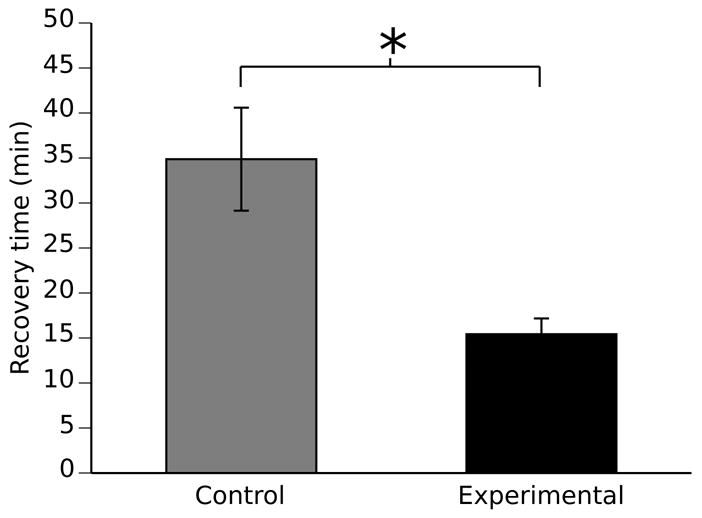
Sliding_window.pl can be used to detect tolerance to ethanol sedation in individual flies within a 96 well microtiter dish. In this assay, functional behavioral tolerance is defined as an increase in the recovery rate from ethanol sedation that is caused by prior ethanol sedation. Flies were ethanol sedated and placed individually into the wells of a 96 well microtiter dish. Movement was quantified with the program sliding_window.pl and recovery was defined as the first time point at which the fly completely displaces its position. The appropriate “white count” for this event was empirically determined as the the minimal “white count” produced by flies in obviously different positions. Animals required 34.9 +/− 5.7 (SEM, n=23) minutes to recover from their first ethanol sedation (control), and 15.4 +/− 1.8 (SEM, n=22)to recover from their second sedation (experimental). Significance was determined by Student’s t test (p<0.01). Error bars are standard error of the mean.
In order to demonstrate the utility of this method for mammalian systems, a mouse was monitored alone and in the presence of a novel object. The program compare2first.pl was used to analyze the data and determine the position of the mouse at a given moment. Table 1 shows that, with no object in the cage, the mouse spent roughly 40% of its time on the left side of the cage. When the object was introduced on the left side, for the first few minutes it avoided that side, spending 11% of its time there. Then, for the remainder of the trial, it spent more than 90% of the time on the left side. After the object was removed, the mouse returned to its baseline level, with 44% on the left side. Visual scoring of the data yielded similar results. This fits in with past studies which describe rodents responding to novelty with both avoidance and exploration (Kim et al., 2005).
Table 1.
Compare2first.pl accurately scores the position of a single mouse. The movements of a caged mouse were recorded using a camcorder before, during, and after the presentation of a novel object (plastic toy). The video was then sampled once per second and converted into images. The images were scored by compare2first.pl and by a visual observer to determine the position of the mouse in one second time intervals. The table shows the percentage of time that the mouse spent on the left and the right halves of its cage during consecutive 6 minute periods as scored by compare2first.pl and by the visual observer. The two scoring methods are essentially in agreement. In the absence of the novel object, the mouse spent about 40% of the time on the left side of the cage. When the novel object was introduced into the left side of the cage, the mouse first avoided the left side and then spent the majority of the time in the side with the toy (>90%). After the toy was removed, the occupancy pattern returned to what it was before the appearance of the novel object.
| computer scoring | visual scoring | ||||
|---|---|---|---|---|---|
| left | right | left | right | agreement | |
| no object (1st 6 min) | 33% | 67% | 34% | 66% | 99% |
| no object (2nd 6 min) | 46% | 54% | 44% | 56% | 98% |
| object on left (1st 6 min) | 11% | 89% | 17% | 83% | 94% |
| object on left (2nd 6 min) | 93% | 7% | 94% | 6% | 100% |
| no object (1st 6 min) | 42% | 58% | 43% | 57% | 99% |
| no object (2nd 6 min) | 47% | 53% | 48% | 52% | 99% |
4 Discussion
Fruit flies exhibit many of the same behaviors as humans. They sleep, learn, court, fight and respond similarly to ethanol (Quinn et al., 1974; Hall, 1994; Moore et al., 1998; Hendricks et al., 2000; Chen et al., 2002). These behaviors have led to a growing interest in Drosophila as a model for complex behavioral phenomena such as ethanol responses. The primary advantage of the Drosophila model system is the capacity for gene identification through genetic screening. However, scoring behavioral phenotypes is time consuming. Since it is common for genetic screens to involve testing upwards of 2,000 lines, there is a significant benefit in automating the process.
In this paper we report a straightforward method for detecting movement of an organism by comparing still images taken at regular intervals. We have used fruitflies and a mouse, but the method could be adapted to any animal. This technique has applications with a wide range of movement based behavior. The process of collecting and analyzing data is largely automated, and can be easily scaled from observing a single animal to observing hundreds of animals.
We have focused on two main techniques to detect movement. In the first, the sequence of images is parceled out into windows of 2n frames per window. These are digitally subtracted in a pyramid fashion to create one composite image per window. The background and any non-moving flies disappear. A sequence of composite images gives a ”sliding window” measurement of the activity level of the animal.
We will be using this method to look at locomotor changes resulting from overactivity of the nervous system. To illustrate the utility of this method, we applied heat pulses to two groups of flies – a temperature sensitive paralytic mutant and a wild type strain. Each heat pulse caused the mutant flies to stop moving and the wild type flies to increase their activity, and the image analysis reflected these effects. In another experiment, we analyzed flies placed individually into small containers recovering from a dose of ethanol. When a fly produced a signal that corresponded to it displacing its position, it was scored as having recovered.
A second technique comes from taking the first image in the sequence and subtracting it from each of the rest of the images. While the animal remains in its original location, the composite images show only a black field. As soon as the animal moves, white pixels appear. This technique is useful in cases where the animals start out fixed in place and eventually begin to move. The experiment we used to demonstrate the method (and the application for which we intend to use it) was to measure ethanol tolerance in flies via their recovery of the ability to climb. But in more general terms, this technique has applicability in cases where the experimenter wishes to measure ”time to an event.” Besides recovery from a sedative, examples of this include measuring time for an egg to hatch or puparation to occur.
With a slight modification, this technique was used to look at the locomotor behavior of a mouse alone and in the presence of a novel object. This can be extended to other tests used with mammals that are interested in ”where” an animal is within a field (such as conditioned place preference). Compare2first.pl was employed with an empty maze/box as the first image, yielding composite images that are black with the animal appearing in white. Basically, the background was subtracted from each image. The field of movement can be divided into appropriate zones for such tests as conditioned place preference assays and the probe test of a Morris water maze. In cases where the path of the animal is needed, the field might be divided up into a grid of relatively small ”sectors” and the sector with the most white pixels can serve as the coordinates of the animal at that moment.
Unfortunately, this method is less applicable in cases where the movement of an animal is expressed by stereotyped behaviors rather than exploratory behaviors. The analysis of an animal that is grooming excessively vs. the analysis of an animal that is grooming normally would most likely be too similar to detect a difference. Another limitation is that it only detects whether movement has occurred between two photographic frames, rather than the magnitude of the movement. In other words, the analysis cannot distinguish between fast and slow movement as long as the animal displaces itself between frames in both cases.
In all of these cases, the main draw of this system is the ease and low cost of set up. Certainly there already exist powerful and elegant software programs to analyze movement data, but in many cases the cost is prohibitive. The described method only requires a digital camera or camcorder, a computer and appropriate lighting. All of the analysis tools come from open source software, meaning that they are free for public use. In particular, high schools and labs wishing to start up movement analysis (but who are unwilling or unable to spend the money on traditional movement analysis software) will be able to collect and analyze this type of data.
Acknowledgments
This work was supported by a grant from DHHS-NATL INST OF HEALTH, Project NBR: 1 R21 AA015503-01 to NSA, and the National Institute of Health training grant T32 AA07471-19 to RBR.
Footnotes
Publisher's Disclaimer: This is a PDF file of an unedited manuscript that has been accepted for publication. As a service to our customers we are providing this early version of the manuscript. The manuscript will undergo copyediting, typesetting, and review of the resulting proof before it is published in its final citable form. Please note that during the production process errors may be discovered which could affect the content, and all legal disclaimers that apply to the journal pertain.
References
- Berger KH, Heberlein U, Moore MS. Rapid and chronic: two distinct forms of ethanol tolerance in Drosophila. Alcohol Clin Exp Res. 2004;28:1469–80. doi: 10.1097/01.alc.0000141817.15993.98. [DOI] [PubMed] [Google Scholar]
- Chen S, Lee AY, Bowens NM, Huber R, Kravitz EA. Fighting fruit flies: a model system for the study of aggression. Proc Natl Acad Sci U S A. 2002;99:5664–5668. doi: 10.1073/pnas.082102599. [DOI] [PMC free article] [PubMed] [Google Scholar]
- Cheng Y, Endo K, Wu K, Rodan A, Heberlein U, Davis R. Drosophila fasciclinII is required for the formation of odor memories and for normal sensitivity to alcohol. Cell. 2001;105:757–768. doi: 10.1016/s0092-8674(01)00386-5. [DOI] [PubMed] [Google Scholar]
- Cole BJ. Short-Term Activity Cycles in Ants: Generation of Periodicity by Worker Interaction. The American Naturalist. 1991;137:244–259. [Google Scholar]
- Cole BJ, Cheshire D. Mobile Cellular Automata Models of Ant Behavior: Movement Activity of Leptothorax allardycei. The American Naturalist. 1996;148:1–15. [Google Scholar]
- Corl AB, Rodan AR, Heberlein U. Insulin signaling in the nervous system regulates ethanol intoxication in Drosophila melanogaster. Nat Neurosci. 2005;8:18–9. doi: 10.1038/nn1363. [DOI] [PubMed] [Google Scholar]
- Cowmeadow R, Krishnan H, Atkinson N. The slowpoke gene is necessary for rapid ethanol tolerance in Drosophila. Alcohol Clin Exp Res. 2005;29:1777–1786. doi: 10.1097/01.alc.0000183232.56788.62. [DOI] [PubMed] [Google Scholar]
- Ghezzi A, Al-Hasan YM, Larios LE, Bohm RA, Atkinson NS. slo K+ channel gene regulation mediates rapid drug tolerance. Proc Natl Acad Sci USA. 2004;101:17276–81. doi: 10.1073/pnas.0405584101. [DOI] [PMC free article] [PubMed] [Google Scholar]
- Hall JC. The mating of a fly. Science. 1994;264:1702–1714. doi: 10.1126/science.8209251. [DOI] [PubMed] [Google Scholar]
- Hasegawa K, Tanakadate A, Ishikawa H. A method for tracking the locomotion of an isolated microorganism in real time. Physiol Behav. 1988;42:397–400. doi: 10.1016/0031-9384(88)90282-x. [DOI] [PubMed] [Google Scholar]
- Hendricks JC, Finn SM, Panckeri KA, Chavkin J, Williams JA, Sehgal A, Pack AI. Rest in Drosophila is a sleep-like state. Neuron. 2000;25:129–38. doi: 10.1016/s0896-6273(00)80877-6. [DOI] [PubMed] [Google Scholar]
- Hoy J, Koehler P, Patterson R. A microcomputer-based system for real-time analysis of animal movement. J Neurosci Methods. 1996;64:157–161. doi: 10.1016/0165-0270(95)00121-2. [DOI] [PubMed] [Google Scholar]
- Kim D, Chae S, Lee J, Yang H, Shin HS. Variations in the behaviors to novel objects among five inbred strains of mice. Genes Brain Behav. 2005;4:302–306. doi: 10.1111/j.1601-183X.2005.00133.x. [DOI] [PubMed] [Google Scholar]
- Leibovitch B, Campbell D, Krishnan K, Nash H. Mutations that affect ion channels change the sensitivity of Drosophila melanogaster to volatile anesthetics. J Neurogenet. 1995;10:1–13. doi: 10.3109/01677069509083455. [DOI] [PubMed] [Google Scholar]
- Martin JR. A portrait of locomotor behaviour in Drosophila determined by a video-tracking paradigm. Behav Processes. 2004;67:207–19. doi: 10.1016/j.beproc.2004.04.003. [DOI] [PubMed] [Google Scholar]
- Moore M, DeZazzo J, Luk A, Tully T, Singh C, Heberlein U. Ethanol intoxication in Drosophila: Genetic and pharmacological evidence for regulation by the cAMP signaling pathway. Cell. 1998;93:997–1007. doi: 10.1016/s0092-8674(00)81205-2. [DOI] [PubMed] [Google Scholar]
- National Research Council. Guide for the Care and Use of Laboratory Animals. National Research Council; Washington, DC: 1996. [Google Scholar]
- Parr J, Large A, Wang X, Fowler S, Ratzlaff K, Ruden D. The inebri-actometer: a device for measuring the locomotor activity of Drosophila exposed to ethanol vapor. J Neurosci Methods. 2001;107:93–9. doi: 10.1016/s0165-0270(01)00357-0. [DOI] [PubMed] [Google Scholar]
- Quinn W, Harris W, Benzer S. Conditioned behavior in Drosophila melanogaster. Proc Natl Acad Sci U S A. 1974;71:708–712. doi: 10.1073/pnas.71.3.708. [DOI] [PMC free article] [PubMed] [Google Scholar]
- Scholz H. Influence of the biogenic amine tyramine on ethanol-induced behaviors in Drosophila. J Neurobiol. 2005;63:199–214. doi: 10.1002/neu.20127. [DOI] [PubMed] [Google Scholar]
- Scholz H, Ramond J, Singh C, Heberlein U. Functional ethanol tolerance in Drosophila. Neuron. 2000;28:261–71. doi: 10.1016/s0896-6273(00)00101-x. [DOI] [PubMed] [Google Scholar]
- Singh C, Heberlein U. Genetic control of acute ethanol-induced behaviors in Drosophila. Alcohol Clin Exp Res. 2000;24:1127–1136. [PubMed] [Google Scholar]
- Suzuki DT, Grigliatti T, Williamson R. Temperature-sensitive mutations in Drosophila melanogaster. VII. A mutation (para-ts) causing reversible adult paralysis. Proc Natl Acad Sci U S A. 1971;68:890–893. doi: 10.1073/pnas.68.5.890. [DOI] [PMC free article] [PubMed] [Google Scholar]
- Weber K. An apparatus for measurement of resistance to gas-phase agents. Dros Info Serv. 1988;67:91–93. [Google Scholar]
- Wen T, Parrish CA, Xu D, Wu Q, Shen P. Drosophila neuropeptide F and its receptor, NPFR1, define a signaling pathway that acutely modulates alcohol sensitivity. Proc Natl Acad Sci U S A. 2005;102:2141–6. doi: 10.1073/pnas.0406814102. [DOI] [PMC free article] [PubMed] [Google Scholar]
- Wolf FW, Rodan AR, Tsai LTY, Heberlein U. High-resolution analysis of ethanol-induced locomotor stimulation in Drosophila. J Neurosci. 2002;22:11035–44. doi: 10.1523/JNEUROSCI.22-24-11035.2002. [DOI] [PMC free article] [PubMed] [Google Scholar]