

Abstract
The yeast pheromone receptor, Ste2p, is a G protein coupled receptor that initiates cellular responses to α-mating pheromone, a 13 residue peptide that carries a net positive charge at physiological pH. We have examined the role of extracellular charged groups on the receptor in response to the pheromone. Substitutions of Asn or Ala for one extracellular residue, Asp275, affected both pheromone binding and signaling, suggesting that this position interacts directly with ligand. The other seven extracellular acidic residues could be individually replaced by polar residues with no detectable effects on receptor function. However, substitution of Ala for each of these seven residues resulted in impairment of signaling without affecting pheromone binding, implying that the polar nature of these residues promotes receptor activation. In contrast, substitution of Ala for each of the six positively charged residues at the extracellular surface of Ste2p did not affect signaling.
Keywords: G protein coupled receptor, Saccharomyces cerevisiae, STE2, pheromone, electrostatic, pheromone receptor, yeast, ligand binding, α-factor
Introduction
G protein coupled receptors (GPCRs) comprise a large superfamily of cellular receptors that mediate responses to a wide variety of stimuli [1-3]. GPCRs are activated by binding of a diverse set of ligands, including proteins, peptides, ions, biogenic amines, lipids, large glycoprotein hormones, and odorant molecules. Binding of ligands at the extracellular surfaces of GPCRs results in transmission of a signal to the cytoplasmic surface that induces exchange of GTP for GDP bound to cytoplasmic heterotrimeric G proteins [4].
Ligands bind to receptors in diverse ways, eliciting a variety of signaling responses [5, 6]. The molecular mechanisms underlying receptor activation by certain ligands and antagonistic effects of other ligands, remain poorly understood. Detailed characterization of the ligand-binding sites on GPCRs and understanding ligand-receptor interactions that mediate activation can provide critical constraints for the design of specific receptor agonists and antagonists [7]. However, for many classes of GPCRs, such as receptors for peptide hormones, the identities of groups that mediate the interactions with ligands have not yet been established.
To date, the only high-resolution crystal structure of a complete GPCR is that of the unactivated state of bovine rhodopsin [8], a receptor that is activated by light absorption, rather than ligand binding. Structures of the large extracellular ligand-binding domains of human follicle stimulating hormone receptor in complex with ligand [9] and of the metabotropic glutamate receptor [10] are also available. However, the mechanisms by which signaling initiated by these extracellular domains is transmitted to the transmembrane and intracellular regions of this receptor remain obscure.
In the absence of detailed structural information, site-directed mutagenesis in combination with biochemical analysis has been useful in identifying specific interactions between chemical groups on GPCRs and chemical groups on ligands. Binding of ligands to many mammalian GPCRs involves ionic interactions between charged groups on the receptor and the ligands. One of the best-understood examples of GPCR ligand-binding, the interaction of biogenic amines with their cognate receptors, entails critical interactions between a conserved aspartic acid residue in predicted TM3 of the receptor and positive charges on ligand amines [11-13]. Similar counter-ion pairs are involved in ligand binding to somatostatin, melanin concentrating hormone, angiotensin, and lutropin/choriogonadotropin receptors [14-17].
The α-factor receptor encoded by the STE2 gene of baker’s yeast, Saccharomyces cerevisiae, is activated by binding to a 13-residue peptide pheromone (WHWLQLKPGQPMY), resulting in induction of a pheromone response pathway that prepares haploid cells for mating. α-factor receptors exhibit no significant sequence similarity to mammalian GPCRs. However, the heterotrimeric G protein involved in the mating pathway is very similar to mammalian G proteins and multiple demonstrations of the functional interchangeability of mammalian and yeast receptors confirm that the α-factor receptor and mammalian receptors share a common signaling mechanism [18, 19].
The interactions between α-factor and its receptor that are responsible for binding and receptor activation are not well characterized. The α-factor peptide contains three potential positively charged groups, the terminal amino group, His2, and Lys7, but only one potential negatively charged group, the terminal carboxyl group. The receptor contains eight potentially negatively charged groups on its predicted extracellular surface and one negative group in the predicted transmembrane region. Several previous studies have implicated the positive charges on α-factor in receptor binding and activation: 1) Removal of one of the positive charges on α-factor by introduction of glutamic acid or acetylated derivatives into the N-terminus of the peptide resulted in a reduction of 20-100-fold in binding affinity for receptor [20]. 2) Increasing the pH of binding reactions from 6.0 to 8.0 decreased receptor affinity approximately ten-fold [21], suggesting that titratable positive charges on the amino terminal or His2 might be involved in binding. 3) Replacement of Lys7with alanine in the tridecapeptide α-factor or acetylation of this residue in the dodecapeptide analog led to a twenty-fold lower affinity in the resulting ligands [22, 23]. However, specific electrostatic interactions between α-factor and Ste2p remain to be identified, and the functional effects of electrostatic interactions may be complicated by redundancy; when Lys7 of α-factor is modified with fluorescent groups or by biotinylation, the resulting analogs exhibit nearly wild type affinities for receptor [24, 25]. Also, some α-factor analogs containing substitutions at His2 are capable of high binding affinity and efficient signaling [26].
Replacement of alanine for the only negative charge in transmembrane domain of the α-factor receptor, Glu143, yields a fully functional receptor with a normal EC50 (ligand concentration for half-maximal response) [27]. Thus, any negatively charged groups important in ligand binding would be expected to be located at the extracellular surface of Ste2p. To examine the role of electrostatic interactions between α-factor and its receptor, we assayed the signaling and binding properties of mutant receptors containing substitutions at the sites of predicted extracellular negatively and positively charged groups. This led to the identification of one residue that appears to interact specifically with ligand, and to the uncovering of a role for the polar nature of extracellular negatively charged groups in receptor activation.
Materials and Methods
Plasmids
Site-directed mutagenesis was used to make the desired mutations in the triple HA-tagged allele of the STE2 gene encoded on the multicopy URA3 plasmid pMD240 [28]. The oligonucleotides used and the resulting plasmids expressing the respective mutant receptor are listed in Table 1. Plasmids expressing double alanine mutants pMD1397, pMD1398, and pMD1399 were constructed by inserting a NheI-SacI-cut fragment from pMD970 into NheI-SacI-cut pMD963, pMD964, and pMD965 respectively. All plasmids containing single alanine substitutions were sequenced over the entire STE2 coding region to ensure that the observed phenotypes were due to the site-directed changes.
Table 1.
Plasmids and yeast strains
| STE2 allele | Mutagenic oligonucleotide | Plasmid | Yeast strain |
|---|---|---|---|
| (Host strain A232) | |||
| STE2+ | - | pMD240 | A448 |
| ste2-Δ | - | pMD228 | A454 |
| D3A | ON 460 | pMD963 | A2360 |
| D14A | ON 461 | pMD964 | A2361 |
| D39A | ON 462 | pMD965 | A2362 |
| E40A | ON 463 | pMD966 | A2363 |
| D124A | ON 464 | pMD967 | A2364 |
| D195A | ON 465 | pMD968 | A2365 |
| D201A | ON 466 | pMD969 | A2366 |
| D275A | ON 467 | pMD970 | A2367 |
| D3N | ON 682 | pMD1175 | A2798 |
| D14N | ON 683 | pMD1176 | A2799 |
| D39N | ON 684 | pMD1177 | A2800 |
| E40Q | ON 685 | pMD1178 | A2801 |
| D124N | ON 686 | pMD1179 | A2802 |
| D195N | ON 687 | pMD1180 | A2803 |
| D201N | ON 688 | pMD1181 | A2804 |
| D275N | ON 689 | pMD1182 | A2805 |
| D3A/D275A | - | pMD1397 | A3311 |
| D14A/D275A | - | pMD1398 | A3312 |
| D39A/D275A | - | pMD1399 | A3313 |
| K100S | ON 690 | pMD1183 | A2806 |
| R122S | ON 691 | pMD1184 | A2807 |
| H126S | ON 692 | pMD1185 | A2808 |
| K187S | ON 693 | pMD1186 | A2809 |
| K202S | ON 694 | pMD1187 | A2810 |
| K269S | ON 695 | pMD1188 | A2811 |
| K100A | ON 841 | pMD1294 | A3081 |
| R122A | ON 842 | pMD1295 | A3082 |
| H126A | ON 843 | pMD1296 | A3083 |
| K187A | ON 844 | pMD1297 | A3084 |
| K202A | ON 845 | pMD1298 | A3085 |
| K269A | ON 846 | pMD1299 | A3086 |
|
| |||
| (STE2+ Host strain A230) | |||
| STE2+ | - | pMD240 | A338 |
| ste2-Δ | - | pMD228 | A433 |
| D3A | ON 460 | pMD963 | A3303 |
| D14A | ON 461 | pMD964 | A3304 |
| D39A | ON 462 | pMD965 | A3305 |
| E40A | ON 463 | pMD966 | A3306 |
| D124A | ON 464 | pMD967 | A3307 |
| D195A | ON 465 | pMD968 | A3308 |
| D201A | ON 466 | pMD969 | A3309 |
| D275A | ON 467 | pMD970 | A3310 |
Yeast Strains and Media
The yeast strains used in this paper are summarized in Table 1. The original ste2-Δ host strain used was A232 (MATa ste2-Δ bar1- cry1R ade2-1 his4-580 lys2oc tyr1oc SUP4-3ts leu2 ura3 FUS1::p[FUS1-lacZ TRP1]) [28]. Yeast transformations were performed by the method of Chen et al [29]. Yeast were cultured on dropout media or YPD as described [30]. To test the dominantnegative effects of alanine mutants the respective plasmids were transformed into strain A230 carrying a chromosomal copy of the STE2+ gene [28]. The resulting strains are listed in Table 1. pMD1397-pMD1399 were transformed into A232 to obtain strains A3311-A3313, expressing double alanine mutant receptors.
Assays of the Yeast Pheromone Response
Liquid assays of FUS1-lacZ were performed as described by Martin et al. [31] with some modifications. Yeast cultures expressing the mutant receptors were grown to stationary phase and then diluted and cultured overnight to an OD600 of approximately 0.4-0.6 in minimal media. 150 μl of cell culture was then dispensed into a 96-well plate containing 10 μl samples of various α-factor dilutions. When α-factor was used as a ligand, the peptide was initially dissolved in water and diluted in 5 μg/ml solution of cytochrome c. When fluorescent ligands were used, the peptides were initially dissolved and diluted to 10 μl in 50% methanol. The cells were incubated with the pheromone for 105 minutes at 30°C and the OD600 was measured using an absorbance plate reader (SpectraMax Plus, Molecular Devices Corp.). 32 μl of a freshly made stock solution of the β-galactosidase substrate fluorescein di-(β-D-galactopyranoside) (FDG) stock solution were then added, so that the samples contained 0.8% Triton X-100, 23mM PIPES (pH 7.2) and 83 nM FDG. The reactions were allowed to proceed for 30 minutes at 37°C and then stopped by the addition of 32 μl of 1 M Na2CO3. Activity was determined by measuring the emission at 530 nm with excitation at 485 nm using a fluorescence plate reader (SpectraMax Plus, Molecular Devices Corp.). For each plate, control wells were loaded with various concentrations of purified β-galactosidase. The fluorescent activity of purified β-galactosidase was plotted against the respective concentrations to obtain a standard graph. The signaling capacity of each strain was defined as equivalent ng of purified β-galactosidase activity divided by the OD600 value of the cells in each well to normalize for the number of cells assayed. Assays were conducted in triplicate using three independent yeast transformants of each strain. The EC50 values were calculated by non-linear least-squares fitting of the fluorescence values to the logarithm of the ligand concentrations using the sigmoidal dose response equation from the ligand binding module of Sigmaplot (SPSS inc). Because of day-to-day variability in determinations of EC50, this parameter is reported as a ratio of the EC50 value determined for a strain expressing a mutant receptor to the EC50 value for a strain expressing normal receptors, tested in a parallel assay with the same batch of ligand.
Halo assays of growth arrest were performed as described previously [28, 32] with the following modifications. Briefly, yeast cultures expressing the mutant receptors were grown to stationary phase. These cultures were diluted and grown overnight to an OD600 of approximately 1.0. A volume of yeast culture corresponding to 3 × 10⁶ cells was taken and the total volume was made up to 1.5 ml by water. The cell suspension was added to 2 ml of selective media containing 1% bacto-agar and vortexed briefly. This mixture was then poured on top of agar plates pre-warmed to 37ºC. This top agar was allowed to solidify and then the indicated amounts of α-factor in a final volume of 3 μl were spotted on each plate. All α-factor dilutions were made in water. The plates were incubated for 48 hours at 30ºC. The sizes of the halos were plotted against the doses of α-factor spotted on the plates and the amount of α-factor required to produce a 15 mm halo was calculated from a linear regression analysis of the semi-logarithmic plot.
Immunoblotting
Immunoblotting was performed as described in [28] with some modifications. The yeast extracts were loaded on a 12 % SDS-polyacrylamide gel (with 4 % stacking gel). Mouse anti-HA antibodies (1:3000 dilution) along with horseradish peroxidase-conjugated goat anti-mouse antibodies (1:5000 dilution) were used for immunodetection.
Binding Assays
[K7(NBD), Nle12] α-factor, [Orn7(NBD), Nle12] α-factor and [Orn7(NBD), E10, Nle12] α-factor were synthesized as described previously [24]. Stock solutions were prepared and stored, and binding assays were conducted as described by Bajaj et al. [33]. Briefly, yeast cultures to be used for binding assays were grown to stationary phase, then diluted and cultured overnight. When they reached an OD600 of 0.75-1.2, a volume of yeast culture corresponding to 1.5 × 10⁶ cells was transferred to polystyrene tubes on ice. Ice-cold 20 mM MES pH 5.8 was added to bring the final volume to 500 μl. These samples were incubated with the ligand solutions for 40-80 mins on ice, then vortexed briefly before analysis on a Becton and Dickinson FACSCalibur flow cytometer using excitation at 488 nm. Samples were maintained on ice and protected from light during pre-incubations and flow cytometry analysis.
Mean fluorescence values for a particular batch of yeast cells incubated at ligand concentrations of 1, 3, 12, 50, 250, and 600 nM were corrected for autofluorescence by subtracting the mean fluorescence value obtained for the same culture in the absence of any ligand [33]. Binding data was analyzed using the ligand binding module of Sigmaplot (SPSS Inc). Bmax and Kd values were obtained by fitting to a binding equation that allowed for single-site specific binding as well as a non-specific component; Y = ((Bmax × L)/(Kd + L)) + (N × L) (1) where Y is the mean fluorescence of cells, N is the proportionality constant for non-specific binding to cells and L is the ligand concentration in nM. The Bmax and Kd values obtained were an average of at least three independent experiments using independent yeast transformants. Except as noted, binding assays were conducted using [Orn7(NBD), Nle12] as a ligand in order to allow direct comparison with the available closely related [Orn7(NBD), Glu10, Nle12] α-factor which differs only in the introduction of a negatively charged side chain at position 10. Dissociation constants for fluorescent ligand binding to wild type and mutant receptors at different pHs are presented in Tables 4 and 5 as ratios of the Kds for mutant, compared with normal receptors assayed in parallel using the same stock ligand solution. This was done because of variations in day-to-day determinations of Kd, perhaps resulting from variations in stock solutions of fluorescent ligands. Relative Bmax values represent the relative number of binding sites per cell for binding of fluorescent ligand as described in legends to the tables.
Table 4.
[Orn7(NBD), Nle12] α-factor binding to STE2 alleles containing substitutions at extracellular negatively charged groups
| Yeast strain | STE2 allele | Relative Bmax* | Relative Kd* | FL1/FL2† |
|---|---|---|---|---|
| A448 | STE2+ | 1 | 1 | 0.68 ± 0.006 |
| A2360 | D3A | 1.2 ± 0.1 | 1.7 ± 0.4 | 0.68 ± 0.007 |
| A2361 | D14A | 0.7 ± 0.1 | 0.5 ± 0.1 | 0.70 ± 0.008 |
| A2362 | D39A | 1.0 ± 0.1 | 0.7 ± 0.2 | 0.68 ± 0.003 |
| A2363 | E40A | 1.0 ± 0.1 | 0.8 ± 0.2 | 0.66 ± 0.007 |
| A2364 | D124A | 0.8 ± 0.1 | 0.9 ± 0.2 | 0.69 ± 0.003 |
| A2365 | D195A | 0.8 ± 0.1 | 1.3 ± 0.3 | 0.69 ± 0.009 |
| A2366 | D201A | 0.8 ± 0.1 | 1.0 ± 0.3 | 0.71 ± 0.015 |
| A2367 | D275A | ND‡ | ND‡ | ND‡ |
| A2805 | D275N | 0.5 ± 0.1 | 3.4 ± 1.0 | 0.86 ± 0.029 |
Relative Bmax values are calculated as the ratio of the number of binding sites on the mutant strain to the number of binding sites on the STE2+ strain, assayed in parallel. Relative Kd values are calculated as the ratio of the Kd for the mutant allele to the Kd for the STE2+ strain. Bmax and Kd values for each strain were derived from fitting of fluorescence emission as described in Materials and Methods. Relative Bmax and Kd values are expressed as mean ± SEM of at least three independent experiments.
Ratio of relative fluorescence emissions in the FL1 (515-545 nm) and FL2 (565-605 nm) channels of the flow cytometer, presented as mean ± SEM of at least three independent experiments.
The number of cell surface binding sites for this mutant was too low to permit reliable fitting to the binding equation.
Table 5.
[K7(NBD), Nle12] α-factor binding to normal and D275N receptors
| Allele, pH* | Relative Bmax† | Relative Kd† | FL1/FL2‡ |
|---|---|---|---|
| STE2+ pH 4.5 | 1 | 1 | 1.31 ± 0.05 |
| STE2+ pH 5.8 | 1.1 ± 0.1 | 11.8 ± 1.6 | 1.11 ± 0.08 |
| STE2+ pH 7.2 | 0.9 ± 0.1 | 10.0 ± 1.6 | 1.39 ± 0.09 |
| D275N pH 4.5 | 0.3 ± 0.1 | 17.4 ± 9.7 | 0.47 ± 0.02 |
| D275N pH 5.8 | ND§ | ND§ | ND§ |
| D275N pH 7.2 | ND§ | ND§ | ND§ |
Binding was assayed in strains A448 (STE2+) and A2805 (D275N).
Relative Bmax values are calculated as the ratio of the number of binding sites on the relevant strain at the indicated pH to the number of binding sites on the STE2+ strain at pH 4.5, assayed in parallel. Relative Kd values are calculated as the ratio of the Kd for the relevant strain at the indicated pH to the Kd for the STE2+ strain at pH 4.5. Bmax and Kd values for each strain were derived from fitting of fluorescence emission as described in Materials and Methods. Relative Bmax and Kd values are expressed as mean ± SEM of at least three independent experiments.
Ratio of relative fluorescence emissions in the FL1 (515-545 nm) and FL2 (565-605 nm) channels of the flow cytometer.
Ratios of fluorescence emission in two channels FL1 (515-545 nm) and FL2 (565-605 nm) of the FACSCalibur were calculated as follows: To evaluate changes in emissions spectrum of receptor-bound ligand, the mean fluorescence values obtained at different ligand concentrations in each channel were individually fit to a saturation binding equation to obtain relative values of Bmax as described above. The Bmax value in the green channel (FL1) was then divided by the Bmax value in the red channel (FL2) to obtain a fluorescence ratio.
Binding of pheromone as a function of pH was conducted using the ligand [K7(NBD), Nle12] α-factor, which provides an increased fluorescent signal strength compared with the ornithine-containing pheromone analogs. The ligand was tested at concentrations of 0, 3, 12, 50, 600 and 1000nM. Binding was conducted in 20 mM sodium acetate at pH 4.5, in 20 mM MES at pH 5.8, and in 20 mM PIPES at pH 7.2.
Results
As a test of the role of electrostatic interactions in activation of the α-factor receptor by ligand, we constructed a set of mutant receptor alleles in which each of the aspartic and glutamic acid residues predicted to reside at the extracellular surface of the receptor was replaced one-at-a-time by alanine or an isosteric uncharged polar residue (glutamine for the glutamic acid residue; asparagine for the aspartic acid residues) (Fig. 1). The mutant receptor alleles were expressed from multicopy plasmids in yeast strains that contain a deletion of the normal chromosomal STE2 gene.
Figure 1.
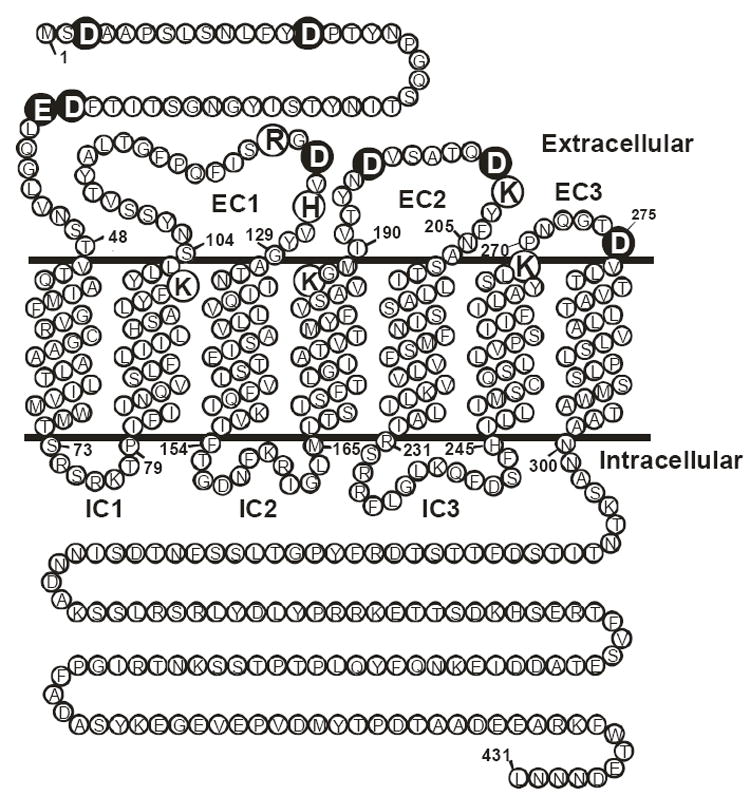
Location of Ste2p extracellular negative (large filled circles) and positive charges (large unfilled circles).
Effects of substitutions at D275
We initially examined the ability of the substituted receptor alleles to induce expression of a lacZ reporter gene fused to the promoter of FUS1, a gene that is transcriptionally induced in response to activation of the pheromone response pathway. Defects in induction of FUS1-lacZ expression were detected for all of the receptor alleles containing alanine substituted for negatively charged residues, ranging from about 20-50% of the response of normal receptors at the saturating concentration of 2 μM α-factor. However, substitution of alanine for aspartic acid at position 275 had a stronger detrimental effect on receptor function than any of the other substitutions. This was particularly evident at the sub-saturating concentration of 10 nM α-factor where the D275A allele exhibited approximately 5% of the normal response. Fitting of dose-response curves yielded an EC50 value for this allele that is approximately five times higher than that for normal receptors (p < 0.05; Table 2).
Table 2.
Fold change in EC50 values for STE2 alleles containing single or double substitutions at extracellular negatively charged groups in a reporter gene assay
| Yeast strain | STE2 allele | EC50 fold change* |
|---|---|---|
| A448 | STE2+ | 1 |
| A2360 | D3A | 1.9 ± 0.5** |
| A2361 | D14A | 1.7 ± 0.3** |
| A2362 | D39A | 1.9 ± 0.3** |
| A2363 | E40A | 2.0 ± 0.5** |
| A2364 | D124A | 2.3 ± 0.8 |
| A2365 | D195A | 1.2 ± 0.5 |
| A2366 | D201A | 1.1 ± 0.4 |
| A2367 | D275A | 4.9 ± 0.6** |
| A3311 | D3A/D275A | 2.2 ± 0.3** |
| A3312 | D14A/D275A | 3.6 ± 0.7** |
| A3313 | D39A/D275A | 3.1 ± 0.5** |
| A2798 | D3N | 0.6 ± 0.1 |
| A2799 | D14N | 1.0 ± 0.2 |
| A2800 | D39N | 0.8 ± 0.3 |
| A2801 | E40Q | 1.0 ± 0.3 |
| A2802 | D124N | 0.9 ± 0.2 |
| A2803 | D195N | 1.5 ±0.5 |
| A2804 | D201N | 1.0 ± 0.3 |
| A2805 | D275N | 0.7 ± 0.1** |
The fold change in EC50 was calculated as EC50 of mutant alleles/EC50 of wild type Ste2p. The values are expressed as mean ± SEM of at least three independent experiments.
The change in EC50 for these alleles (compared with STE2+) was statistically significant at the level of p<0.05.
Cells expressing receptors containing the D275A substitution also exhibited a substantial defect in pheromone-induced growth arrest. In long-term assays of growth inhibition based on detection of halos of arrested cells surrounding various amounts of pheromone applied to culture plates, cells expressing the D275A allele exhibited small, indistinct, halos, for which it was not possible to measure reliable diameters (Table 3).
Table 3.
Relative activity in a growth arrest assay of STE2 alleles containing substitutions at extracellular charged groups
| Yeast strain | STE2 allele | Relative activity* |
|---|---|---|
| A448 | STE2+ | 100 |
| A2360 | D3A | 56 ± 10 |
| A2361 | D14A | 49 ± 6** |
| A2362 | D39A | 51 ± 7** |
| A2363 | E40A | 55 ± 7** |
| A2364 | D124A | 50 ± 6** |
| A2365 | D195A | 48 ± 6** |
| A2366 | D201A | 46 ± 5** |
| A2367 | D275A | N.D. † |
| A2798 | D3N | 79 ± 12 |
| A2799 | D14N | 70 ± 10 |
| A2800 | D39N | 77 ± 11 |
| A2801 | E40Q | 76 ± 11 |
| A2802 | D124N | 87 ± 13 |
| A2803 | D195N | 82 ± 11** |
| A2804 | D201N | 73 ± 13 |
| A2805 | D275N | N.D. ‡ |
| A3081 | K100A | 89 ± 15 |
| A3082 | R122A | 106 ± 18 |
| A3083 | H126A | 144 ± 8 |
| A3084 | K187A | 136 ± 24 |
| A3085 | K202A | 95 ± 16 |
| A3086 | K269A | 101 ± 26 |
Relative activity is calculated as: (α-factor required to produce a 15 mm halo in the wild type Ste2p/α-factor required to produce a 15 mm halo in the mutant alleles) × 100.The values are expressed as mean ± SEM of at least three independent experiments.
The change activity for these alleles (compared with STE2+) was statistically significant at the level of p<0.05.
N.D., Not Determined; Halos for this strain had indistinct edges and had smaller diameters than halos for strains expressing wild-type receptors.
N.D., Not Determined; Halos for this strain had indistinct edges but were approximately the same size as the halos of strains expressing wild-type receptors.
It is unlikely that the defects in signaling by D275A mutant receptors result from changes in expression level because the pheromone response is remarkably independent of changes in expression levels of pheromone receptors [28, 34]. Furthermore, normal and mutant alleles were expressed from multicopy plasmids to minimize any possible effects of reduced expression of mutant alleles. Immunoblotting of whole-cell extracts using an antibody to the HA epitope fused to the C-terminal of normal and mutant receptors indicated that the D275A mutant receptor was present at normal levels in cells (Fig. 4). (The lower molecular weight bands seen on immunoblots are receptor degradation products resulting from proteolytic removal of N-terminal sequences from mutant and wild-type receptors.) However, the number of cell-surface binding sites for pheromone was drastically reduced in cells expressing the D275A allele, based on a flow cytometry-based assay for binding of fluorescently-labeled ligand [Orn7(NBD), Nle12] α-factor [24, 33] (Table 4).
Figure 4.
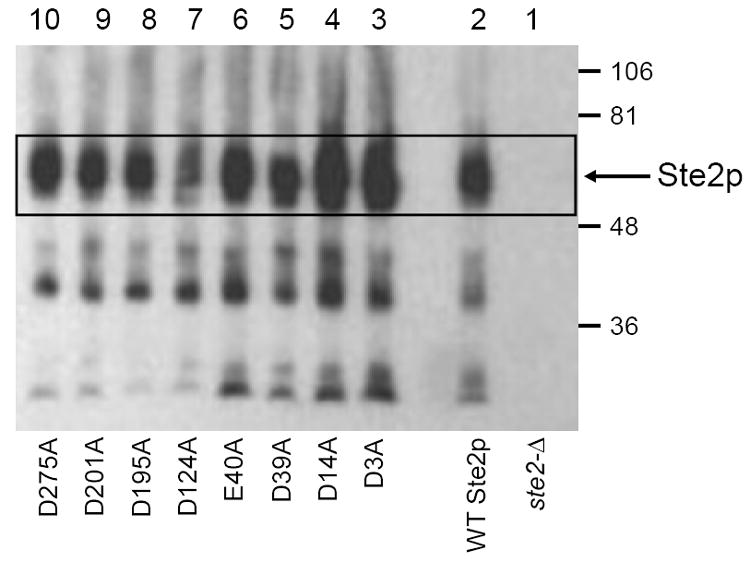
Immunoblot analysis of levels of Ste2p in whole-cell lysates for wild type and mutant alleles. The blots were developed using anti-HA antibodies. The molecular weights are shown on the right. The strains expressing the wild type receptor and the alanine mutants are same as used in Figure 2.
Substitution of asparagine for aspartic acid at position 275 resulted in more moderate defects in receptor function than were seen for alanine at this position. Receptors containing the D275N substitution responded normally to α-factor in assays of FUS1-lacZ induction with little change in EC50 (Fig. 5 and Table 2). However, in the longer term assays of growth arrest, cells expressing receptors with asparagine at this position exhibited only partial growth arrest in response to α-factor, resulting in halos with turbid edges that prevented reliable determination of halo diameters (Table 3). In contrast to the case for D275A, cells expressing the D275N allele exhibited detectable binding of [Orn7(NBD), Nle12] α-factor at the cell surface, however, both numbers of binding sites and the affinity for ligand of the D275N mutant are lower than for normal receptors (Table 4). The fluorescence emission of the [Orn7(NBD), Nle12] α-factor bound to the D275N receptor is also blue-shifted, compared with the same analog bound to normal receptors, as indicated by a higher ratio of fluorescence emission in the FL1 channel (515-545 nm) relative to FL2 channel (565-605 nm)(Table 4). This small, but significant shift (p < 0.05) suggests that the NBD fluorophore resides in a more hydrophobic site on the D275N mutant than the comparable site on normal receptors (see [24, 33]).
Figure 5.
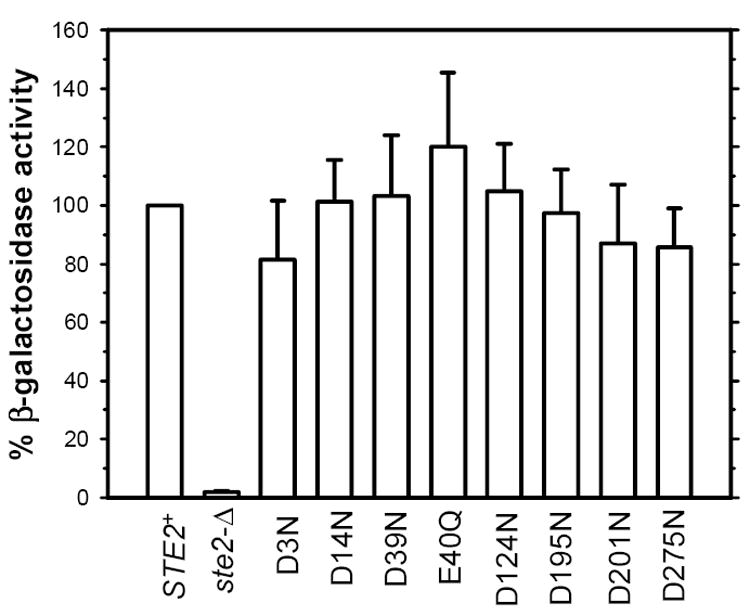
Percentage FUS1-lacZ induction of receptors containing asparagine and glutamine substituted for aspartic and glutamic acid residues in response to 2 μM α-factor. The results are shown as mean ± SEM of at least three independent experiments. The strains expressing the empty vector and the wild type receptor are same as used in Figure 2. The strains expressing D3N, D14N, D39N, E40Q, D124N, D195N, D201N, and D275N mutant receptors are A2798, A2799, A2800, A2801, A2802, A2803, A2804, and A2805 respectively.
If the aspartic acid residue at position 275 is involved in electrostatic interactions with ligand, substitutions at this residue might be expected to alter the pH dependence of ligand binding. Thus, we compared the binding of [Orn7(NBD), Nle12] α-factor to cells expressing normal or D275N receptors at pH 4.5, 5.8, and 7.2. Consistent with previous reports [21], as pH increases, we detect a decrease in affinity of binding of this ligand to normal receptors (data not shown). While we were able to detect specific binding of this ligand to D275N receptors at all three pHs, the pH-dependence of binding to the mutant receptor was not significantly different from that for normal receptors. This could either be because no such difference exists, or because of the difficulty of fitting accurate dissociation constants to binding data for this relatively weakly-fluorescing ligand [24] to mutant receptors that are present at reduced abundance.
We also tested the pH dependence of ligand binding to normal and mutant receptors using an alternative ligand, [K7(NBD), Nle12] α-factor, that provides an enhanced signal to noise ratio compared to [Orn7(NBD), Nle12] [24]. Binding of [K7(NBD), Nle12] α-factor to D275N mutant receptors exhibits a stronger pH-dependence than binding to normal receptors. Binding to mutant receptors was readily detected at pH 4.5, albeit with more than 10-fold lower affinity and a four-fold lower Bmax than its binding to normal receptors at this pH (Fig. 6 and Table 5). However, at pH 5.8 or pH 7.2, no specific binding of [K7(NBD), Nle12] α-factor to cells expressing D275N mutant receptors could be detected (Fig. 6). In contrast, binding of [K7(NBD), Nle12] α-factor to normal receptors was readily detected at pHs 4.5, 5.8, and 7.2, exhibiting an approximately 10-fold decrease in affinity as pH increased from 4.5 to 5.8, but little additional change as the pH increased further to 7.2 (Table 5). The changes that we observe in binding as a function of pH apparently reflect alterations in ligand affinity, rather than the changes in the numbers of sites per cell, since cells were treated identically prior to the incubations with ligand, and since fitting of the binding of [Orn7(NBD), Nle12] α-factor, which binds to the same sites, but exhibits a weaker pH-dependence of binding affinity, yielded a constant Bmax value over measurements at different pHs.
Figure 6.
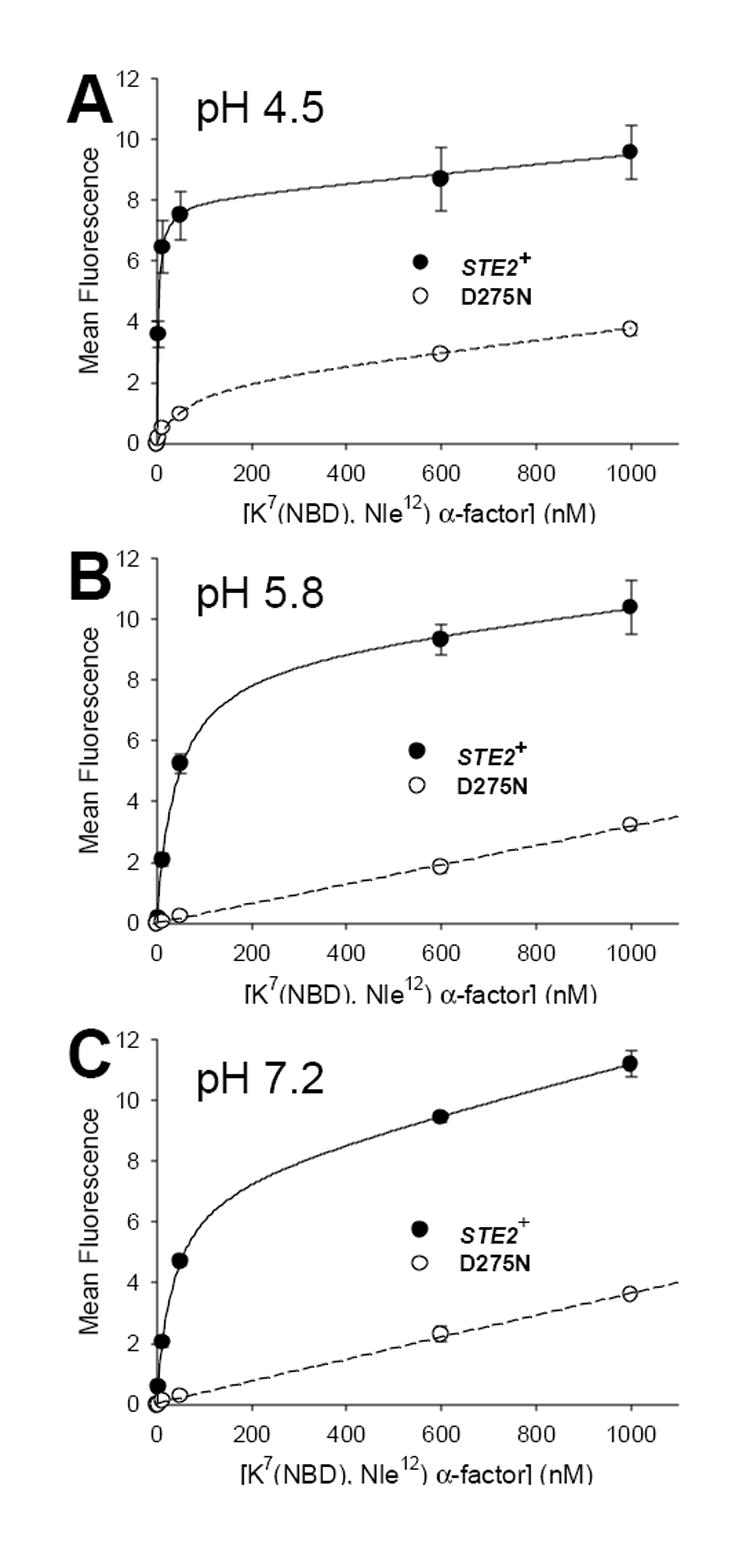
pH-dependence of binding of [K7(NBD), Nle12] α-factor to normal and D275N mutant receptors. Data points represent the mean ± SEM for three independent isolates of each strain. Binding of [K7(NBD), Nle12] α-factor to strains A448 (STE2+) and A2805 (D275N) was assayed at pH 4.5 (panel A), pH 5.8 (panel B), and pH 7.2 (panel C). Solid lines indicate the results of least squares fitting to the data for strain A448 as described in Materials and Methods. Dashed lines represent the fit to data for strain A2805. The data for strain A448 at all pHs and for strain A2805 at pH 4.5 was fit as single site binding with a nonspecific component as described in Materials and Methods. The data for strain A2805 at pH 5.8 and pH 7.2 was fit to a linear regression passing through the origin.
Despite the nearly normal response of D275N mutant receptors to normal α-factor in assays of FUS1-lacZ induction (Table 2), these mutant receptors are much less sensitive than normal receptors to the alternate ligand [K7(NBD), Nle12] α-factor. The EC50 for activation of D275N by [K7(NBD), Nle12] α-factor is approximately ten-fold higher than the EC50 for activation of wild-type receptors by this ligand (Fig. 7). Thus, for [K7(NBD), Nle12] α-factor concentrations in the range of 12-50 nM, significantly lower levels of FUS1-lacZ expression are induced by mutant receptors than by normal receptors (p < 0.01) (Fig. 7). In contrast, no significant differences are detected in the responses of normal and D275N mutant receptors to the ligand [Orn7(NBD), Nle12] α-factor (p < 0.2).
Figure 7.
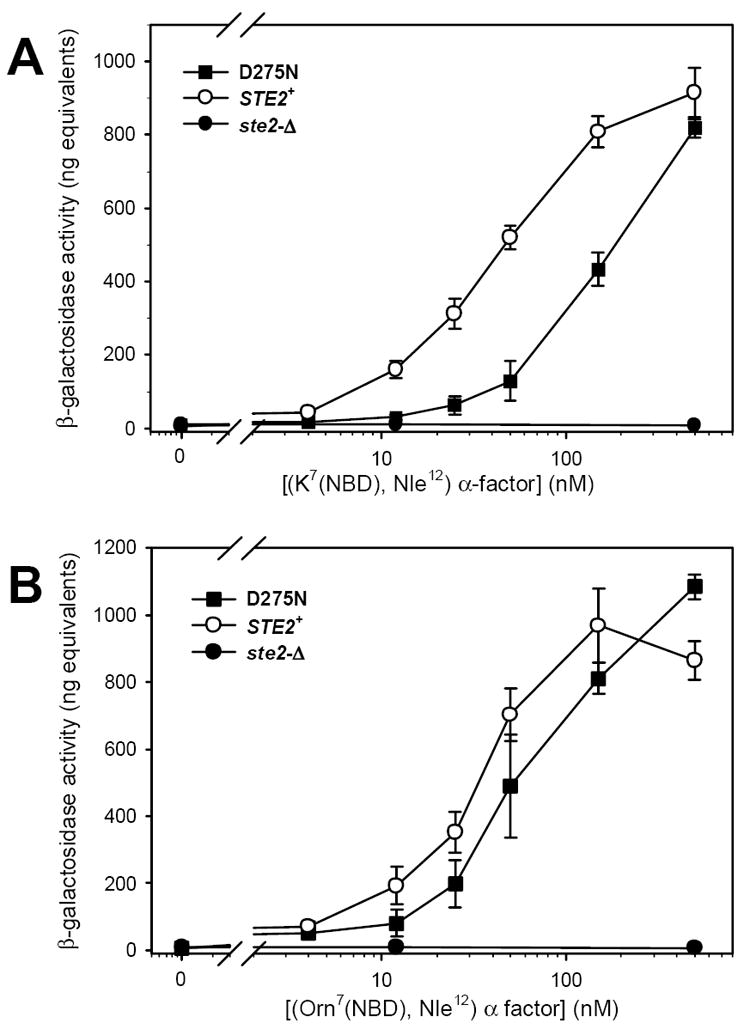
Ligand-specific defects in FUS1-lacZ induction by cells expressing D275N mutant receptors. Activation of FUS1-lacZ expression in response to fluorescent ligands was assayed as described in Materials and Methods. The strains used were A448, expressing normal receptors, A2805, expressing D275N mutant receptors, and strain A454, expressing no α-factor receptors.
Taking advantage of the previously-reported strong shift in emission wavelength of [K7(NBD), Nle12] α-factor on binding to normal receptors [24, 33], we examined emission spectra of this ligand bound to normal and D275N receptors. There is a nearly 3-fold decrease (p < 10-4) in the FL1/FL2 channel ratio for the emission of [K7(NBD), Nle12] α-factor bound to the mutant receptor, compared to the same ligand bound to normal receptors (Table 5). This strong red-shift, indicates that the NBD fluorophore binds in a more polar environment on the mutant, compared with the normal receptor. No significant changes in channel ratio were detected for binding of [K7(NBD), Nle12] α-factor to normal receptors at different pHs (Table 5).
Effects of substitutions at other charged residues
If particular negatively charged residues on the receptor are involved in direct interactions with oppositely charged groups on the ligand, substitution of uncharged residues at these positions on the receptor would be expected to lead to loss of ligand affinity or signaling function, whereas substitution of alanine for negatively charged groups that are not involved in such interactions would have minimal effects. While the phenotypes we have detected for substitutions at position 275 in Ste2p are more drastic than those resulting from similar substitutions at other acidic residues, we were surprised to find that substitution of alanine for any of the seven additional negatively charged groups on the extracellular surface of the receptor resulted in an approximately 2-fold reduction in maximal FUS1-lacZ induction in response to a saturating concentration of pheromone (Figs. 2 and 3). This reduction in maximal response was accompanied by only modest (2-fold or less) increases in EC50 (Table 2). All the alanine-substituted mutants also exhibited signaling defects in a long-term growth arrest assay compared to normal receptor (Table 3). Aside from the D275N allele (see above), no significant defect in function was detected for receptors containing isosteric polar amino acids substituted for negatively charged residues (Fig. 5 and Tables 2 and 3).
Figure 2.
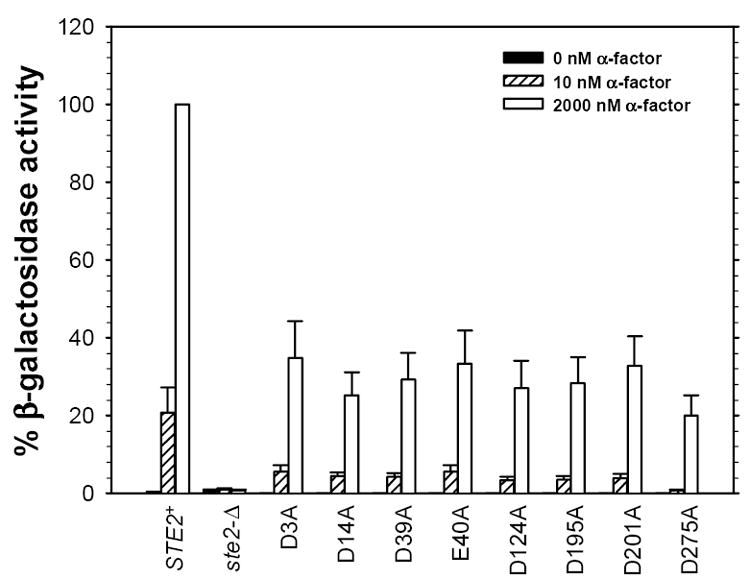
Percentage of FUS1-lacZ induction in response to 0 nM, 10 nM, and 2 μM α-factor for eight mutant receptor alleles containing alanine substituted for acidic residues. The results are shown as mean ± SEM of at least three independent experiments. The strains expressing the D3A, D14A, D39A, E40A, D124A, D195A, D201A, and D275A mutants are A2360, A2361, A2362, A2363, A2364, A2365, A2366, and A2367 respectively. The strain expressing normal Ste2p is A448. All receptors contain an HA epitope attached at the carboxyl terminal and all are expressed from multicopy plasmids
Figure 3.
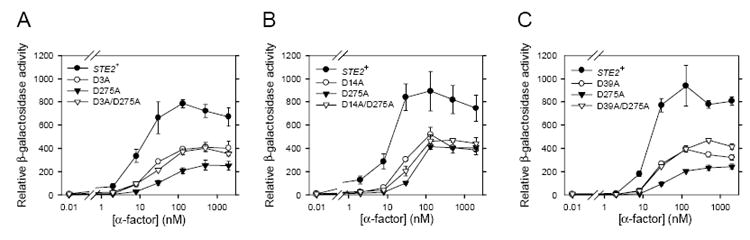
Signaling of double alanine mutants in liquid assays of FUS1-lacZ induction. Strains shown in each panel of the figure were assayed simultaneously. The results are an average of at least three independent experiments. The error bars represent standard error. The strains expressing the wild type receptor and single alanine mutants were same as used in Figure 2. The strains expressing double alanine mutants D3A/D275A, D14A/D275A, and D39A/D275A are A3311, A3312, and A3313 respectively.
Immunoblotting of whole-cell extracts from cells expressing the seven alanine-substituted receptors (Fig. 4) confirmed that six of them were present at normal levels. Expression of the D124A mutant was slightly lower than normal. However, this is unlikely to be the cause of the observed signaling defect of the D124A allele, since it is one of the least defective among the tested alleles, and since its level of expression is significantly higher than that of wild-type chromosomally-encoded Ste2p that provides normal signaling responses. Cells expressing the remaining seven alanine-substituted alleles display normal numbers of receptors on the cell surface that bind [Orn7(NBD), Nle12] α-factor with normal affinity (see [24, 33], Table 4). Thus, for these seven alleles, the observed defect in signaling is not due to improper folding of the receptor, poor cell surface expression levels, or reduced binding affinity. Furthermore, there was no significant difference between the fluorescence emission spectra of the environmentally-sensitive NBD fluorophore of [Orn7(NBD), Nle12] α-factor bound to these mutant receptors, compared with wild-type receptors (see [24, 33], Table 4).
We also assayed binding to normal and mutant receptors by an additional α-factor analog, [Orn7(NBD),E10 ,Nle12] α-factor, that differs from [Orn7(NBD), Nle12] α-factor only in the substitution of a negatively charged glutamic acid for the normal glutamine residue at position 10. This was done to examine the possibility that loss of negatively charged groups on mutated receptors might allow enhanced binding of ligand containing an extra negative charge, compared with binding of Glu10-containing ligand to normal receptors.. However, for each of the charge-substituted receptors for which binding could be measured, the binding affinity of the Glu10 analog was the same as or lower than that for binding to normal receptors (results not shown).
The signaling defects produced by the D275A substitution were not generally additive when combined with other alanine substitutions (Fig. 3). In fact, a modest suppression of the defect in pheromone-responsive FUS1-lacZ induction was seen when D275A was combined with certain other substitutions (Fig. 3).
None of the alanine-substituted mutations that we created exhibited significant dominant negative behavior (results not shown). This was tested by examining FUS1-lacZ induction in response to α-factor in cells containing multicopy plasmids encoding the mutant receptors as well as a normal chromosomal copy of the STE2 gene.
To determine whether the effects of charge substitutions in the receptor were specific to substitutions of negatively charged residues, we substituted serine and alanine, one at a time, for each of the six positive charges that are predicted to reside at the extracellular surface of the receptor: Lys100, Arg122, His126, Lys187, Lys202, and Lys269. Receptors containing each of these substitutions responded to α-factor with approximately the same or even better sensitivity compared with the normal allele in the growth arrest assay. Results of the alanine substitutions are presented in Table 3. This is consistent with previous reports in which individual replacements of positive charges at position 100, 122, 126, 202 and 269 with cysteine residues and replacement of the Lys269 with alanine results in receptors with normal pheromone responses [35-37].
Discussion
Electrostatic interactions play important roles in signaling and ligand binding of many mammalian GPCRs [11, 14, 15]. To examine the role of these interactions in ligand binding and recognition by the yeast α-factor receptor, we generated a series of mutant receptors containing individual substitutions of either alanine or an uncharged polar residue in place of one of the eight negative charges and six positive charges predicted to reside at the receptor’s extracellular surface. Substitutions at one negatively charged amino acid, Asp275, resulted in more severe defects than similar changes at other extracellular charged amino acids in the receptor. Cells expressing α-factor receptors containing alanine in place of Asp275 exhibited severely diminished pheromone-dependent induction of a FUS1-lacZ reporter gene and only weak growth arrest in the presence of pheromone. Furthermore, no detectable binding of ligand to the D275A mutant receptors could be detected at the cell surface, even though these mutant receptors are present at normal levels in whole-cell extracts. The more conservative substitution D275N also resulted in a defect in response to α-factor in the growth arrest assay, reduced abundance of cell-surface binding sites, decreased affinity for ligand, changes in the fluorescence emission spectra of bound fluorescent ligands, and a ligand-specific reduction in induction of FUS1-lacZ expression in response to the fluorescent agonist [K7(NBD), Nle12] α-factor.
Since receptors containing substitutions of either Asn or Ala for Asp275 retain significant abilities to induce FUS1-lacZ expression in response to pheromone, there must be at least a small population of each of these mutant receptors that reaches the cell surface and is capable of binding ligand. In the case of D275A, this population is too small to be detected in assays of fluorescent α-factor binding. In the case of D275N, cell surface binding can be detected, though both the affinity and number of sites are less than for normal receptors. Thus, mutations at D275 appear to affect both trafficking to the cell surface and binding of ligand by receptors that reach the surface. A lack of correlation between ligand binding affinities and dose-response relations of mutated α-factor receptors has been documented previously [38, 39].
The more severe defects observed for the D275A and D275N mutants in the long term growth arrest assay, compared with the short-term FUS1-lacZ reporter assay, are consistent with the 17 previously-described insensitivity of the reporter gene assay to changes in levels of receptor expression [28, 40]. Other previously-isolated ste2 mutations exhibit stronger phenotypes in the growth arrest assay than in the induction assay [40, 41].
The fact that the D275N mutation in Ste2p induces shifts in the emission spectra of receptor-bound fluorescent ligands, while maintaining a native-like fold as indicated by high ligand-binding affinities, provides strong evidence for physical proximity between Asp275 and the fluorophore of the bound ligand. If the interactions between Ste2p and ligand include an electrostatic component that involves Asp275, mutational removal of the ionizeable group at this position would be expected to lead to alteration of the pH-dependence of ligand binding. In fact, the complete loss of detectable binding of [K7(NBD), Nle12] α-factor to D275N receptors at pHs above 4.5, compared with the more modest decrease in affinity of normal receptors for this ligand at the higher pHs, provides evidence for such an electrostatic interaction. Thus, the negative charge of the ionized aspartic acid at high pHs appears to provide a favorable interactions with ligand, whereas replacement of this residue by neutral asparagine results in lower affinity. However, the overall enhanced affinity of normal receptors for ligand that is observed at low pH must be due to electrostatic effects of groups other than Asp275, since ionic interactions involving Asp275 would be expected to be weakest under acid conditions where the aspartic acid is protonated. Some of the pH dependence of binding of fluorescent ligands could be due to protonation of the derivatized Lys7, which, as an aniline derivative, is expected to be a weaker base than the unmodified lysine. However, an overall decrease in ligand affinity similar to that with increasing pH is seen with unmodified α-factor as well as the fluorescent analogs [21].
Subtle differences between the ligands used in this study resulted in remarkable differences in their interactions with normal and mutant receptors: 1) Although normal and D275N mutant receptors responded similarly to normal α-factor and to [Orn7(NBD), Nle12] α-factor, there are significant differences between the responses of normal and D275N mutant receptors to a third ligand, [K7(NBD), Nle12] α-factor. 2) The fluorescence emission of [Orn7(NBD), Nle12] α-factor bound to D275N mutant receptors is slightly blue-shifted compared with the same ligand bound to normal receptors, whereas the emission of [K7(NBD), Nle12] α-factor bound to mutant receptors is strongly red-shifted compared with the binding of this ligand to normal receptors. 3) We have detected difference in the pH dependence of binding of different fluorescent ligands to D275N mutant receptors.
One explanation of the differential effects of the D275N mutation on the binding and activity of different ligands would be that the NBD group on the side-chain of the lysine-containing ligand extends into a hydrophobic pocket near Asp275 of the normal receptor. Local structural changes resulting from substitution of asparagine for aspartic acid at this position could either render this hydrophobic pocket inaccessible to the NBD group or open the pocket up to solvent, reducing binding affinity and preventing the blue-shift of the lysine-containing ligand. In contrast, the fluorophore attached via the shorter side chain of [Orn7(NBD), Nle12] α-factor may not be able to reach into the pocket of normal receptors, explaining the lack of blue-shift upon binding to normal receptors and the weaker effects of the D275N substitution on binding affinity, potency, and fluorescence emission of the ornithine-containing ligand. Different behaviors of [Orn7(NBD), Nle12] α-factor and [K7(NBD), Nle12] α-factor are not likely to be caused by differences between the extents of ionization of the NBD-derivatized ornithine and lysine side chains, since their pKs should not differ greatly.
Replacement of Asp275 by valine in Ste2p has previously been reported to result in a defective, dominant-negative, receptor [42], consistent with our observation that substitution of non-polar alanine at this position causes partial loss of function. However, we have not been able to detect dominant effects of the D275A allele, perhaps because of reduced expression of the D275A allele at the cell surface. On the other hand, replacement of Asp275 by cysteine was reported to result in a normal receptor, as assayed by growth arrest [37]. In contrast, our finding that the more conservative replacement of asparagine for Asp275 leads to filled-in halos, may reflect different steric and electrostatic properties of the side chains of asparagine and cysteine, different plasmid and host backgrounds, or differences in details of assay protocols. Our observation that receptors bearing the D201A substitution exhibit a slight defect in signaling is also somewhat at variance with an earlier report stating that a receptor bearing this same substitution exhibits normal responses to α-factor in a growth arrest assay [43]. However, this might also be a function of the different plasmid copy numbers, receptor tags, and host strains, or sensitivity of assay conditions used in these two studies.
Substitution of polar uncharged residues at the positions of the thirteen positively and negatively charged extracellular amino acids (other than Asp275) resulted in receptors that retain nearly normal signaling function in short-term assays of FUS1-lacZ reporter gene induction, as well as longer-term assays of growth arrest. Since substitution of an uncharged residue for Glu143, the only potentially negatively charged residues in the predicted transmembrane segments of the receptor, did not diminish signaling function [27], we conclude that no single electrostatic interaction, either between the receptor and the ligand or between oppositely charged groups in the receptor, is strictly required for ligand binding or activation of this receptor. Three possible explanations for this lack of electrostatic effects are: 1) The ionizeable groups on the ligand are uncharged upon formation of the receptor-ligand complex. (This would be particularly relevant for the histidine residue and the amino terminal with pKas near neutral); 2) The charged moieties of the ligand are exposed to solvent in orientations facing away from the receptor; or 3) Electrostatic interactions that are important for receptor activation are redundant, such that removal of any particular interaction does not significantly affect receptor function. Thus, a generalized charge distribution or overall electrostatic potential at the extracellular surface, as opposed to individual charged groups, may be involved in receptor activation, as was shown for positively charged groups on the third intracellular loop of Ste2p [44].
The partial loss of responsiveness to ligand that we observe upon substitution of alanine at seven of the eight negatively charged amino acids on the extracellular surface of Ste2p does not result from reduced expression, inefficient targeting to the plasma membrane, or inability to bind ligand, based on immunoblotting and assays of cell surface binding of α-factor. The lack of effect of these substitutions on ligand binding affinity and on the fluorescence emission spectra of the bound fluorescent ligand implies that the affected residues are not likely to be involved in direct interactions with ligand. Thus, these mutations must either impair the ability of the receptor to become activated in response to ligand binding or promote enhanced receptor desensitization, although the latter possibility seems unlikely given the extracellular locations of the changes. These seven alanine mutants are examples of rare extracellular receptor mutations that affect intracellular signaling without affecting binding [35].
We uncovered a dichotomy between the effects of alanine substitutions at negatively charged, compared with positively charged, residues. Introduction of alanine as a replacement for any of the eight extracellular negatively charged residue resulted in partial loss of function, whereas no similar replacement of any extracellular positively charged residues had any significant effect on signaling. Since it is unlikely that all eight extracellular negative charges of the receptor are directly involved in the receptor activation, the partial loss of function observed on replacing them with alanine suggests that they all contribute to the formation of one or more polar surfaces that must be maintained for maximal receptor activation. Although it might be expected that such polar surfaces would contain co-mingled positively and negatively charged residues, this does not appear to be the case, since introduction of alanine in place of positively charged residues leaves receptor function unchanged. The fact that combination of D275A with other alanine substitutions at negatively charged residues is not additive, and in some cases leads to partial reversal of the signaling defect of D275A, suggests that the role of Asp275 in interacting with ligand is not entirely distinct from the roles of the other negatively charged extracellular residues in maintaining active receptor function.
In rhodopsin, the only GPCR for which a complete structure is available [8], negatively charged amino acid residues are distributed relatively evenly throughout the three-dimensional structure of extracellular regions of the receptor, which contain few positively charged amino acids. While the yeast α-factor receptor is functionally interchangeable with many mammalian receptors, the very low level of sequence similarity between Ste2p and rhodopsin and the unusual covalent attachment of ligand to rhodopsin make it difficult to draw inferences about α-factor binding based on comparison to the rhodopsin structure.
Acknowledgments
This work was supported by National Institutes of Health grants GM59357 (to M.E.D.) and GM22086 (to F.N). Flow cytometry was performed using facilities of the Cancer Center of the University of Rochester, supported by technical assistance and excellent advice from Dr. Peter Keng and the staff of the Center. We thank Dr. Elizabeth Mathew for her comments on this manuscript.
Abbreviations
- GPCR
G protein coupled receptor
- [Orn7(NBD), Nle12] α-factor
(Ornithine7 (7-nitrobenz-2-oxa-1,3-diazol-4-yl), Gln10, norleucine12 α-factor)
- [Orn7(NBD), E10, Nle12] α-factor
(Ornithine7 (7-nitrobenz-2-oxa-1,3-diazol-4-yl), Glu10, norleucine12 α-factor)
- [K7(NBD), Nle12] α-factor
(Lys7 (7-nitrobenz-2-oxa-1,3-diazol-4-yl), Gln10, norleucine12 α-factor)
- HA epitope
hemagglutinin 12CA5 epitope
Footnotes
Publisher's Disclaimer: This is a PDF file of an unedited manuscript that has been accepted for publication. As a service to our customers we are providing this early version of the manuscript. The manuscript will undergo copyediting, typesetting, and review of the resulting proof before it is published in its final citable form. Please note that during the production process errors may be discovered which could affect the content, and all legal disclaimers that apply to the journal pertain.
References
- 1.Spiegel AM. Mutations in G proteins and G protein-coupled receptors in endocrine disease. J Clin Endocrinol Metab. 1996;81:2434–42. doi: 10.1210/jcem.81.7.8675557. [DOI] [PubMed] [Google Scholar]
- 2.Spiegel AM, Weinstein LS. Inherited diseases involving g proteins and g protein-coupled receptors. Annu Rev Med. 2004;55:27–39. doi: 10.1146/annurev.med.55.091902.103843. [DOI] [PubMed] [Google Scholar]
- 3.Schoneberg T, Schulz A, Biebermann H, Hermsdorf T, Rompler H, Sangkuhl K. Mutant G-protein-coupled receptors as a cause of human diseases. Pharmacol Ther. 2004;104:173–206. doi: 10.1016/j.pharmthera.2004.08.008. [DOI] [PubMed] [Google Scholar]
- 4.Strader CD, Fong TM, Tota MR, Underwood D, Dixon RA. Structure and function of G protein-coupled receptors. Annu Rev Biochem. 1994;63:101–32. doi: 10.1146/annurev.bi.63.070194.000533. [DOI] [PubMed] [Google Scholar]
- 5.Ji TH, Grossmann M, Ji I. G protein-coupled receptors. I. Diversity of receptor-ligand interactions. J Biol Chem. 1998;273:17299–302. doi: 10.1074/jbc.273.28.17299. [DOI] [PubMed] [Google Scholar]
- 6.Strader CD, Fong TM, Graziano MP, Tota MR. The family of G-protein-coupled receptors. Faseb J. 1995;9:745–54. [PubMed] [Google Scholar]
- 7.Flower DR. Modelling G-protein-coupled receptors for drug design. Biochim Biophys Acta. 1999;1422:207–34. doi: 10.1016/s0304-4157(99)00006-4. [DOI] [PubMed] [Google Scholar]
- 8.Palczewski K, Kumasaka T, Hori T, Behnke CA, Motoshima H, Fox BA, Le Trong I, Teller DC, Okada T, Stenkamp RE, Yamamoto M, Miyano M. Crystal structure of rhodopsin: A G protein-coupled receptor. Science. 2000;289:739–45. doi: 10.1126/science.289.5480.739. [DOI] [PubMed] [Google Scholar]
- 9.Fan QR, Hendrickson WA. Structure of human follicle-stimulating hormone in complex with its receptor. Nature. 2005;433:269–77. doi: 10.1038/nature03206. [DOI] [PMC free article] [PubMed] [Google Scholar]
- 10.Kunishima N, Shimada Y, Tsuji Y, Sato T, Yamamoto M, Kumasaka T, Nakanishi S, Jingami H, Morikawa K. Structural basis of glutamate recognition by a dimeric metabotropic glutamate receptor. Nature. 2000;407:971–7. doi: 10.1038/35039564. [DOI] [PubMed] [Google Scholar]
- 11.Gantz I, DelValle J, Wang LD, Tashiro T, Munzert G, Guo YJ, Konda Y, Yamada T. Molecular basis for the interaction of histamine with the histamine H2 receptor. J Biol Chem. 1992;267:20840–3. [PubMed] [Google Scholar]
- 12.Fraser CM, Wang CD, Robinson DA, Gocayne JD, Venter JC. Site-directed mutagenesis of m1 muscarinic acetylcholine receptors: conserved aspartic acids play important roles in receptor function. Mol Pharmacol. 1989;36:840–7. [PubMed] [Google Scholar]
- 13.Wang CD, Buck MA, Fraser CM. Site-directed mutagenesis of alpha 2A-adrenergic receptors: identification of amino acids involved in ligand binding and receptor activation by agonists. Mol Pharmacol. 1991;40:168–79. [PubMed] [Google Scholar]
- 14.Strnad J, Hadcock JR. Identification of a critical aspartate residue in transmembrane domain three necessary for the binding of somatostatin to the somatostatin receptor SSTR2. Biochem Biophys Res Commun. 1995;216:913–21. doi: 10.1006/bbrc.1995.2708. [DOI] [PubMed] [Google Scholar]
- 15.Macdonald D, Murgolo N, Zhang R, Durkin JP, Yao X, Strader CD, Graziano MP. Molecular characterization of the melanin-concentrating hormone/receptor complex: identification of critical residues involved in binding and activation. Mol Pharmacol. 2000;58:217–25. doi: 10.1124/mol.58.1.217. [DOI] [PubMed] [Google Scholar]
- 16.Feng YH, Noda K, Saad Y, Liu XP, Husain A, Karnik SS. The docking of Arg2 of angiotensin II with Asp281 of AT1 receptor is essential for full agonism. J Biol Chem. 1995;270:12846–50. doi: 10.1074/jbc.270.21.12846. [DOI] [PubMed] [Google Scholar]
- 17.Ji I, Zeng H, Ji TH. Receptor activation of and signal generation by the lutropin/choriogonadotropin receptor. Cooperation of Asp397 of the receptor and alpha Lys91 of the hormone. J Biol Chem. 1993;268:22971–4. [PubMed] [Google Scholar]
- 18.Erickson JR, Wu JJ, Goddard JG, Tigyi G, Kawanishi K, Tomei LD, Kiefer MC. Edg-2/Vzg-1 couples to the yeast pheromone response pathway selectively in response to lysophosphatidic acid. J Biol Chem. 1998;273:1506–10. doi: 10.1074/jbc.273.3.1506. [DOI] [PubMed] [Google Scholar]
- 19.Price LA, Kajkowski EM, Hadcock JR, Ozenberger BA, Pausch MH. Functional coupling of a mammalian somatostatin receptor to the yeast pheromone response pathway. Mol Cell Biol. 1995;15:6188–95. doi: 10.1128/mcb.15.11.6188. [DOI] [PMC free article] [PubMed] [Google Scholar]
- 20.Zhang YL, Lu HF, Becker JM, Naider F. Position one analogs of the Saccharomyces cerevisiae tridecapeptide pheromone. J Pept Res. 1997;50:319–28. doi: 10.1111/j.1399-3011.1997.tb01190.x. [DOI] [PubMed] [Google Scholar]
- 21.Blumer KJ, Thorner J. Beta and gamma subunits of a yeast guanine nucleotide-binding protein are not essential for membrane association of the alpha subunit but are required for receptor coupling. Proc Natl Acad Sci U S A. 1990;87:4363–7. doi: 10.1073/pnas.87.11.4363. [DOI] [PMC free article] [PubMed] [Google Scholar]
- 22.Abel MG, Zhang YL, Lu HF, Naider F, Becker JM. Structure-function analysis of the Saccharomyces cerevisiae tridecapeptide pheromone using alanine-scanned analogs. J Pept Res. 1998;52:95–106. doi: 10.1111/j.1399-3011.1998.tb01363.x. [DOI] [PubMed] [Google Scholar]
- 23.Raths SK, Naider F, Becker JM. Peptide analogues compete with the binding of alpha-factor to its receptor in Saccharomyces cerevisiae. J Biol Chem. 1988;263:17333–41. [PubMed] [Google Scholar]
- 24.Ding FX, Lee BK, Hauser M, Davenport L, Becker JM, Naider F. Probing the binding domain of the Saccharomyces cerevisiae alpha-mating factor receptor with rluorescent ligands. Biochemistry. 2001;40:1102–8. doi: 10.1021/bi0021535. [DOI] [PubMed] [Google Scholar]
- 25.Henry LK, Khare S, Son C, Babu VV, Naider F, Becker JM. Identification of a contact region between the tridecapeptide alpha- factor mating pheromone of Saccharomyces cerevisiae and its G protein- coupled receptor by photoaffinity labeling. Biochemistry. 2002;41:6128–39. doi: 10.1021/bi015863z. [DOI] [PubMed] [Google Scholar]
- 26.Levin Y, Khare RK, Abel G, Hill D, Eriotou-Bargiota E, Becker JM, Naider F. Histidine2 of the alpha-factor of Saccharomyces cerevisiae is not essential for binding to its receptor or for biological activity. Biochemistry. 1993;32:8199–206. doi: 10.1021/bi00083a021. [DOI] [PubMed] [Google Scholar]
- 27.Sommers CM, Dumont ME. Genetic interactions among the transmembrane segments of the G protein coupled receptor encoded by the yeast STE2 gene. J Mol Biol. 1997;266:559–75. doi: 10.1006/jmbi.1996.0816. [DOI] [PubMed] [Google Scholar]
- 28.Leavitt LM, Macaluso CR, Kim KS, Martin NP, Dumont ME. Dominant negative mutations in the alpha-factor receptor, a G protein-coupled receptor encoded by the STE2 gene of the yeast Saccharomyces cerevisiae. Mol Gen Genet. 1999;261:917–32. doi: 10.1007/s004380051039. [DOI] [PubMed] [Google Scholar]
- 29.Chen DC, Yang BC, Kuo TT. One-step transformation of yeast in stationary phase. Curr Genet. 1992;21:83–4. doi: 10.1007/BF00318659. [DOI] [PubMed] [Google Scholar]
- 30.Rose MD, Winston F, Hieter P. Methods in Yeast Genetics. Cold Spring Harbor Laboratory; Cold Spring Harbor, NY: 1990. [Google Scholar]
- 31.Martin NP, Celic A, Dumont ME. Mutagenic mapping of helical structures in the transmembrane segments of the yeast alpha-factor receptor. J Mol Biol. 2002;317:765–88. doi: 10.1006/jmbi.2002.5444. [DOI] [PubMed] [Google Scholar]
- 32.Sprague GF., Jr Assay of yeast mating reaction. Methods Enzymol. 1991;194:77–93. doi: 10.1016/0076-6879(91)94008-z. [DOI] [PubMed] [Google Scholar]
- 33.Bajaj A, Celic A, Ding FX, Naider F, Becker JM, Dumont ME. A fluorescent alpha-factor analogue exhibits multiple steps on binding to its G protein coupled receptor in yeast. Biochemistry. 2004;43:13564–78. doi: 10.1021/bi0494018. [DOI] [PubMed] [Google Scholar]
- 34.Shah A, Marsh L. Role of Sst2 in modulating G protein-coupled receptor signaling. Biochem Biophys Res Commun. 1996;226:242–6. doi: 10.1006/bbrc.1996.1340. [DOI] [PubMed] [Google Scholar]
- 35.Akal-Strader A, Khare S, Xu D, Naider F, Becker JM. Residues in the first extracellular loop of a G protein-coupled receptor play a role in signal transduction. J Biol Chem. 2002;277:30581–90. doi: 10.1074/jbc.M204089200. [DOI] [PubMed] [Google Scholar]
- 36.Lee BK, Lee YH, Hauser M, Son CD, Khare S, Naider F, Becker JM. Tyr266 in the sixth transmembrane domain of the yeast alpha-factor receptor plays key roles in receptor activation and ligand specificity. Biochemistry. 2002;41:13681–9. doi: 10.1021/bi026100u. [DOI] [PubMed] [Google Scholar]
- 37.Lin JC, Parrish W, Eilers M, Smith SO, Konopka JB. Aromatic residues at the extracellular ends of transmembrane domains 5 and 6 promote ligand activation of the G protein-coupled alpha-factor receptor. Biochemistry. 2003;42:293–301. doi: 10.1021/bi026766o. [DOI] [PubMed] [Google Scholar]
- 38.Naider F, Becker JM. The alpha-factor mating pheromone of Saccharomyces cerevisiae: a model for studying the interaction of peptide hormones and G protein-coupled receptors. Peptides. 2004;25:1441–63. doi: 10.1016/j.peptides.2003.11.028. [DOI] [PubMed] [Google Scholar]
- 39.Yi TM, Kitano H, Simon MI. A quantitative characterization of the yeast heterotrimeric G protein cycle. Proc Natl Acad Sci U S A. 2003;100:10764–9. doi: 10.1073/pnas.1834247100. [DOI] [PMC free article] [PubMed] [Google Scholar]
- 40.Lin JC, Duell K, Konopka JB. A microdomain formed by the extracellular ends of the transmembrane domains promotes activation of the G protein-coupled alpha-factor receptor. Mol Cell Biol. 2004;24:2041–51. doi: 10.1128/MCB.24.5.2041-2051.2004. [DOI] [PMC free article] [PubMed] [Google Scholar]
- 41.Marsh L. Substitutions in the hydrophobic core of the alpha-factor receptor of Saccharomyces cerevisiae permit response to Saccharomyces kluyveri alpha-factor and to antagonist. Mol Cell Biol. 1992;12:3959–66. doi: 10.1128/mcb.12.9.3959. [DOI] [PMC free article] [PubMed] [Google Scholar]
- 42.Dosil M, Giot L, Davis C, Konopka JB. Dominant-negative mutations in the G-protein-coupled alpha-factor receptor map to the extracellular ends of the transmembrane segments. Mol Cell Biol. 1998;18:5981–91. doi: 10.1128/mcb.18.10.5981. [DOI] [PMC free article] [PubMed] [Google Scholar]
- 43.Lee YH, Naider F, Becker JM. Interacting residues in an activated state of a G protein-coupled receptor. J Biol Chem. 2006;281:2263–72. doi: 10.1074/jbc.M509987200. [DOI] [PubMed] [Google Scholar]
- 44.Celic A, Martin NP, Son CD, Becker JM, Naider F, Dumont ME. Sequences in the intracellular loops of the yeast pheromone receptor Ste2p required for G protein activation. Biochemistry. 2003;42:3004–17. doi: 10.1021/bi0269308. [DOI] [PubMed] [Google Scholar]