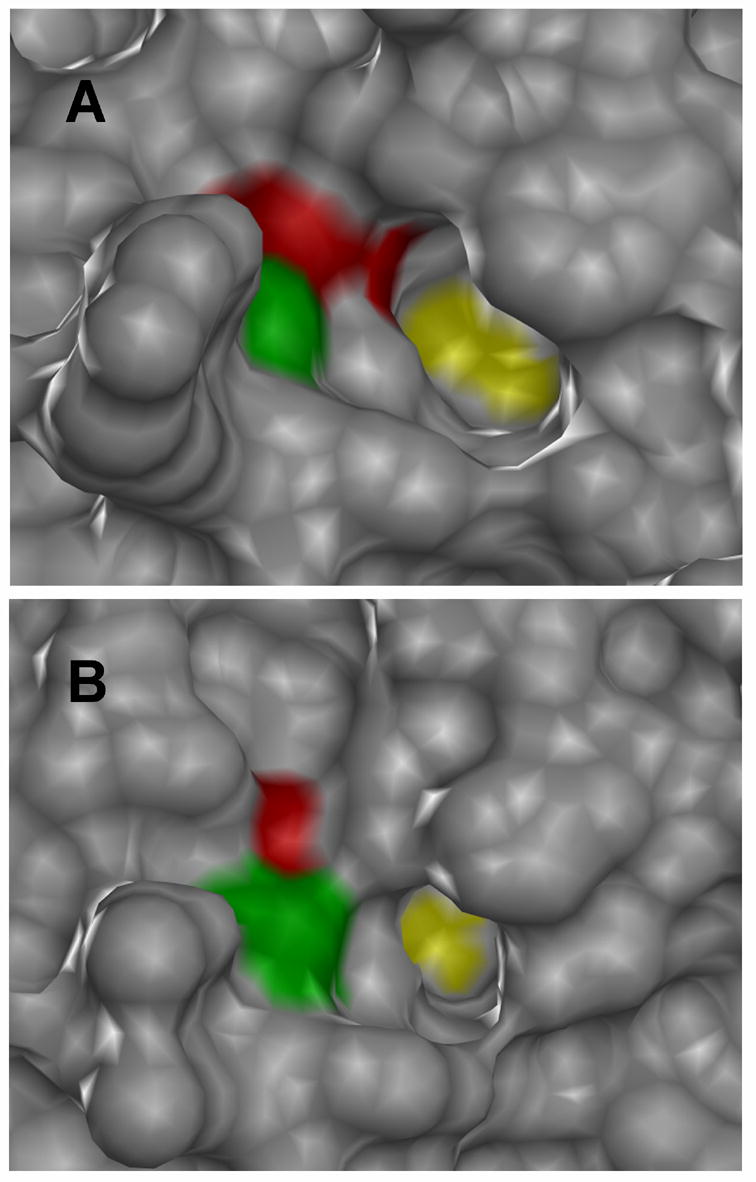
Fig. 6.

Active-site structural comparison of PTP1B and HePTP. The protein surfaces of PTP1B (A, PDB: 1C83 [38]) and HePTP (B, PDB: 1ZC0 [49]) are shown in gray, with the portions of the surface comprising V49/I107 shown in green and the portions comprising I219/I274 shown in red. For perspective, the active-site catalytic cysteine residues of PTP1B and HePTP are shown in yellow. Both enzymes are crystallized in the closed conformation: an inhibitor (compound 1) bound to the PTP1B active site and a phosphate ion bound to the HePTP active site have been removed for clarity. Images were generated using the Chimera software package (http://www.cgl.ucsf.edu/chimera).
