

Abstract
Local direct application of the neuromodulator serotonin strongly influences auditory response properties of neurons in the inferior colliculus (IC), but endogenous stores of serotonin may be released in a distinct spatial or temporal pattern. To explore this issue, the serotonin releaser fenfluramine was iontophoretically applied to extracellularly recorded neurons in the IC of the Mexican free-tailed bat (Tadarida brasiliensis). Fenfluramine mimicked the effects of serotonin on spike count and first spike latency in most neurons, and its effects could be blocked by co-application of serotonin receptor antagonists, consistent with fenfluramine-evoked serotonin release. Responses to fenfluramine did not vary during single applications or across multiple applications, suggesting that fenfluramine did not deplete serotonin stores. A predicted gradient in the effects of fenfluramine with serotonin fiber density was not observed, but neurons with fenfluramine-evoked increases in latency occurred at relatively greater recording depths compared to other neurons with similar characteristic frequencies. These findings support the conclusion that there may be spatial differences in the effects of exogenous and endogenous sources of serotonin, but that other factors such as the identities and locations of serotonin receptors are also likely to play a role in determining the dynamics of serotonergic effects.
Keywords: fenfluramine, serotonin, serotonin receptor, inferior colliculus, neuromodulation
INTRODUCTION
The neuromodulator serotonin is widely dispersed throughout the brain, and alters sensory responses of every modality examined (for example, somatosensory: Waterhouse et al. 1986 and Foehring et al. 2002; visual: Waterhouse et al. 1990 and Mooney et al. 1996; olfactory: Yuan et al. 2003; auditory: Ebert and Ostwald 1992; reviewed in Hurley et al. 2004). In the inferior colliculus (IC), a midbrain nucleus that integrates ascending auditory information from multiple brainstem nuclei (reviewed in Irvine 1992; Oliver and Huerta 1992; Pollak et al. 2003), serotonin has strong effects on the responses of neurons to auditory stimuli, and can alter such fundamental properties as spike count, frequency tuning, and response latency (Hurley and Pollak 2001, 2005b). In all previous studies, these changes have been evoked by the application of exogenous serotonin. Knowing more about the dynamics of endogenously released serotonin would contribute to a better understanding of the function of serotonergic modulation in the IC.
Just as for neurotransmitters like GABA and glutamate, serotonin availability in the brain is regulated by the balance between exocytotic release and reuptake by transporters (Blakely and Baumann 2000). For serotonin, these processes are less confined to synapses than they are for many classical neurotransmitters, and serotonin may travel relatively far from the site of release before encountering a transporter (Bunin and Wightman 1998). This being the case, the local application of exogenous serotonin could be a reasonable model for the endogenous release of serotonin. On the other hand, levels of endogenously released serotonin could differ regionally or temporally from those of exogenously applied serotonin. One reason for this is that serotonergic fibers are denser in some regions of the IC than others, such as the dorsal and external cortices, and also in the dorsomedial region of the central nucleus of the IC in some species including the free-tailed bat (Klepper and Herbert 1991; Kaiser and Covey 1997; Hurley and Thompson 2001). This distribution of fibers may also mean that serotonin clearance is more rapid in regions of high release, since serotonin transporters are located on serotonergic fibers (Nielsen et al. 2006).
Most of the serotonergic fibers found in the IC originate in the dorsal and median raphe nuclei (Klepper and Herbert 1991). Therefore, the release of endogenous serotonin in the IC could be investigated by activating these nuclei electrically or chemically (for example, Sakai and Crochet 2001; Pobbe and Zangrossi 2005; Sheibani and Farazifard 2006). A disadvantage of this type of manipulation is that it would likely have relatively global effects, since these dorsal raphe neurons innervate extensive regions of the brain, including regions that are known to project to the IC (for example, cochlear nucleus: Zook and Casseday 1985, Oliver 1987, Vater and Feng 1990; Klepper and Herbert 1991; amygdala: Marsh et al. 2002, Jacobs et al. 1978). Indeed, even single serotonergic neurons may send collaterals to different nuclei along ascending sensory pathways (Kirifides et al. 2001). Thus, stimulating the dorsal raphe nucleus would likely alter the response properties of inputs to the IC as well as those of neurons within the IC itself.
Here, we take another approach to exploring endogenous serotonin release in the IC by locally applying fenfluramine, a serotonin releaser and reuptake inhibitor. Fenfluramine is an amphetamine derivative with selectivity for the serotonergic system that in the short term increases serotonin levels in the brain but over the course of days or weeks may deplete serotonin (Rowland and Carlton 1986; Schwartz et al. 1989; Baumann et al. 2000; Tao et al. 2002; Rothman et al. 2003; Itzhak and Ali 2006). This study focuses on the effects of iontophoretically applied fenfluramine on the auditory responses of single IC neurons in a time frame of minutes. Although fenfluramine has often been infused locally into different brain regions (for example, Schwartz et al. 1989; Consolo et al. 1996; Baumann et al. 2000, 2001; Cobb and Abercrombie 2003; van der Stelt et al. 2005), this study represents the first iontophoretic application of this drug, to our knowledge. In this study we measure the effects of fenfluramine on the auditory responses of single neurons, assess whether fenfluramine acts by releasing serotonin, and examine the distribution of different effects of fenfluramine relative to recording depth and characteristic frequency.
MATERIALS AND METHODS
Subjects
Experiments were performed on 7 male Mexican free-tailed bats (Tadarida brasiliensis) collected under permit from Texas Parks and Wildlife. Prior to surgery, bats were anesthetized by brief exposure to isoflurane fumes followed by intraperitoneal injection of 120 mg/kg ketamine and 5 mg/kg xylazine. When deep anesthesia was achieved as judged by the lack of response to tail and foot pinch, the skin and muscle overlying the skull were incised and deflected. A small hole was drilled above the IC, plainly visible in the contours of the skull. The dura was then incised and the hole covered with a thin layer of surgical-grade silicon gel to prevent drying. Lidocaine gel (2%) was applied topically to surgical surfaces, and the bat was placed in a soft foam holder shaped to its body contours and transported to a sound-attenuated chamber. The head of the bat was immobilized in a custom-made stereotaxic device (Schuller et al. 1986) with a post affixed to the skull by dental cement rostral to the IC. In some cases, a second post was attached caudal to the IC with cyanocrylate gel for additional mechanical stability. The bat was then allowed to waken. Bats usually lie quietly within the recording apparatus. Periodically, topical lidocaine anesthesia was refreshed and the bat was offered water from a dropper. If a bat showed discomfort, as judged by movement that was observed directly or through the recording electrode, a subanesthetic dose of 20 mg/kg ketamine and 1 mg/kg xylazine (1/5 of the surgical dose) was administered. If movement persisted, the experiment was terminated and the bat returned to its home cage. Neurons were recorded during two sessions, with a resting period in the home cage of no less than 10 hours between sessions. Before this resting period, bats were reanesthetized with isoflurane, their incisions were sutured, and they were treated with a topical mixture of antibiotic and Lidocaine gels as well as a systemic analgesic (Torbugesic, 1–2 mg/kg). All procedures used in this study were approved by the Bloomington Institutional Animal Care and Use Committee.
Extracellular recording of single neurons
A total of 95 inferior colliculus (IC) neurons were recorded through single-barreled extracellular pipettes attached in a ‘piggy-back’ configuration (Havey and Caspary 1980) to a tribarreled micropipette used for the iontophoresis of drugs. Iontophoresis pipettes were broken to a tip diameter of 10–20 μm, with the single-barreled recording pipette protruding 10–15 μm in front of the multibarreled pipette. The tips of the single-barreled pipettes were filled with 1M NaCl and had resistances of 8–20 MΩ. Pipettes were connected by a silver-silver chloride wire to a Dagan 2400 amplifier (Minneapolis, MN). Spikes were fed through a spike signal enhancer (FHC model, Bowdoinham, ME) before being digitized through a data acquisition processor board (Microstar, Bellevue, WA). Multibarreled electrodes were positioned above the IC under visual control through a dissecting microscope and lowered with a piezoelectric microdrive (Burleigh/EXFO inchworm, Mississauga, Ontario) until action potentials were observed. The top of the IC was defined as the point of initial contact of the recording electrode to ground.
Auditory stimuli
Auditory stimuli were created and data were collected with the custom software package Batlab (Dr. Donald Gans, Kent State University). Auditory stimuli were played through a midline freefield speaker (Infinity Emit B, Harman International Industries, Woodbury, NY). Calibration of the speaker was accomplished by placing a measuring microphone (ACO Pacific PS9200 kit, Belmont, CA) in the position occupied by the bat’s head during experiments. The response of the speaker was flat within ± 6 dB from 15–30 kHz, a range that encompassed the characteristic frequencies (CFs) of 88% of recorded neurons. Of the remaining 12% (11 neurons), all but one (with a CF of 14 kHz) had CFs above 30 kHz, ranging from 31 kHz; 3 at 31 kHz, 3 at 33 kHz, and one each at 37, 38, 39, and 40 kHz (Fig. 7B). Harmonic distortions were 30–40 dB below the fundamental frequency across this range.
Figure 7.
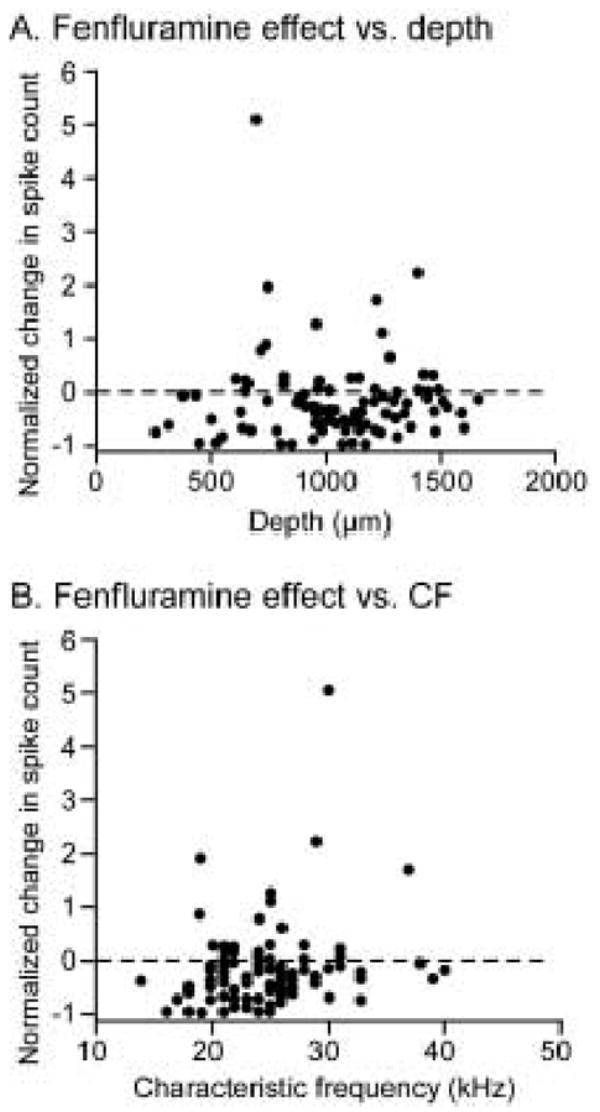
Normalized effects of fenfluramine versus recording depth or CF. A. Normalized fenfluramine-evoked changes in spike count versus recording depth. Dashed line indicates zero change in spike count; negative values are spike count decreases and positive values are spike count increases. The relationship between spike count and recording depth is not statistically significant (linear regression, p = .943; r2 = 0). B. In the same neuron population, the relationship between spike count change and CF is also not significant (p = .476 r2 = .005).
Auditory stimuli consisted of tone bursts or frequency modulated (FM) sweeps ranging from 5–10 ms, with 0.5 ms risetimes. FM sweeps were centered at the CF for each neuron and swept across a range of 5–10 kHz. Rate-level functions were generated by playing FM sweeps or CF tones, whichever elicited the strongest response from a given neuron, at intensities ranging from 10 dB below to 40–50 dB above threshold, in 10 dB steps. Frequency tuning plots were generated by playing tones spanning the excitatory tuning range of the neuron in steps of 0.5 to 4 kHz, depending on the bandwidth of the neural response. Frequency tuning was measured from 10 dB below to 30–50 dB above threshold, in steps of 10–20 dB. Individual stimuli were repeated 32 times to generate measurements of spike count and first spike latency. Spike data was exported from Batlab in ASCII format for statistical analysis.
Drugs and iontophoresis
The multibarreled pipette of the piggy-back electrode was used for iontophoresis of drugs. Two of the pipette barrels were filled with the drugs to be tested and one was filled with 1M NaCl to serve as a sum channel, balancing the iontophoretic currents ejected through the other barrels. The barrels were connected by silver-silver chloride wire to iontophoresis pump modules (Dagan ION-100, Minneapolis, MN). Four different drugs were iontophoretically applied to IC neurons: 1) the serotonin releaser and reuptake inhibitor fenfluramine (Sigma-Aldrich, St. Louis, MO; 12–25 mM, n = 95); 2) serotonin creatinine sulfate (Sigma-Aldrich, St. Louis, MO; 20–30 mM, n = 20); 3) the 5-HT1A antagonist WAY-100635 (N-[2-[4-(2-Methoxyphenyl)-1-piperazinyl]ethyl]-N-2-pyridinylcyclohexanecarboxamide maleate salt, Sigma-Aldrich; 4–10 mM, n = 13); and 4) the 5-HT2 antagonist mianserin (Tocris, Ellisville, MO; 10 mM, n = 13). Drugs were dissolved in 165 mM NaCl, pH 4–4.5. In previous studies, no effects of the same iontophoresed vehicle alone have been observed (Hurley and Pollak 1999, 2001, 2005a, b). In the current study, the same vehicle was iontophoresed onto 5 neurons, but had no effect on either spike count or first spike latency in any.
During a typical experiment, the responses of neurons to tone bursts and FM sweeps were initially monitored over a time period equivalent to the time needed for the drugs to affect neural responses. This was done to ensure the stability of baseline activity. After this initial time control, drug iontophoresis commenced and spike counts were monitored until they stabilized, which generally occurred within about 5 minutes. While maintaining drug iontophoresis, another data set was collected. Iontophoresis was then halted and if contact with the neuron was maintained, spike counts were monitored until the neuron recovered or for 15–30 minutes. Antagonists were applied after recovery from the first application of fenfluramine beginning in advance of a second fenfluramine application or at the same time.
Analysis
The effects of fenfluramine on both spike counts and first spike latencies were measured and analyzed for statistical significance by using 2-tailed t-tests in Excel (Microsoft, Redmond, WA). The t-tests assessed whether the average spike count or latency for 32 repetitions of a single stimulus were different in the control and during fenfluramine iontophoresis. Statistical tests of median responses have been performed previously and given similar results (Hurley and Pollak 2005b). To exclude neurons that showed spontaneous variability in their response properties, only neurons with drug effects that were statistically distinguishable from both of two separate pre-drug measurements were accepted for analysis. Alternatively, for a few neurons in which multiple control measurements were not performed, only neurons with responses that recovered significantly after the cessation of agonist iontophoresis were analyzed. To compare the absolute values of changes in spike count at different time points after fenfluramine iontophoresis across the population of neurons, paired t-tests were used. Simple and multiple regression analyses to assess drug-evoked changes versus depth or CF or both were performed using MiniTab 14 software (MiniTab Inc., State College, PA). Average values are reported ± the standard error of the mean. One-way ANOVAs performed in MiniTab were used to determine whether neural response properties varied between bats. Neither recording depths (p = .918), neural CFs (p = .228), nor the effects of fenfluramine (p = .381) differed significantly among bats. In addition, there were no significantly different effects of fenfluramine on the first versus second day of recording (p = .849).
RESULTS
Electrophysiological recordings were obtained from the inferior colliculus (IC) of seven Mexican free-tailed bats. A total of 95 neurons were recorded at depths from 377 to 1680 μm, with a mean depth of 1036.8 ± 33.2 μm. Characteristic frequencies ranged from 14–40 kHz (Fig. 7B), with a mean of 25.8 ± .5 kHz, and increased with recording depth, as reported previously for Mexican free-tailed bats and other mammalian species (for example, Casseday and Covey 1992; Jen and Xu 2006; Zweirs et al. 2004). Average first spike latencies ranged from 7.6 ms to 41.1 ms after stimulus onset, with a mean of 19.8 ± .57ms.
Fenfluramine effects on spike count and latency are similar to those of serotonin
Fenfluramine was applied locally to the 95 neurons using iontophoretic currents ranging from 10 nA to 85 nA. The effects of fenfluramine on spike count and first spike latency in response to 32 presentations of tone bursts presented at CF (n=11) or to FM sweeps centered at CF (n=84) were measured. Figure 1 plots peristimulus time histograms (PSTHs) of two neurons that responded in opposite ways to the iontophoresis of fenfluramine. Neuron (a) decreased its spike count by 77% in the presence of fenfluramine, and also increased its average first spike latency, from 18.0 ± .07 ms to 20.9 ± .44 ms (2-tailed unpaired t-tests, p<0.05). In contrast, neuron (b) increased its spike count by 30% and decreased its latency from 21.7 ± .11 ms to 17.0 ± .05 ms during the iontophoresis of fenfluramine (2-tailed unpaired t-tests, p<0.05). The spike count and latency of neuron (a) recovered to baseline values similar to control during the recovery period when iontophoresis was halted, but neuron (b) was not held for long enough to obtain recovery measurements.
Figure 1.
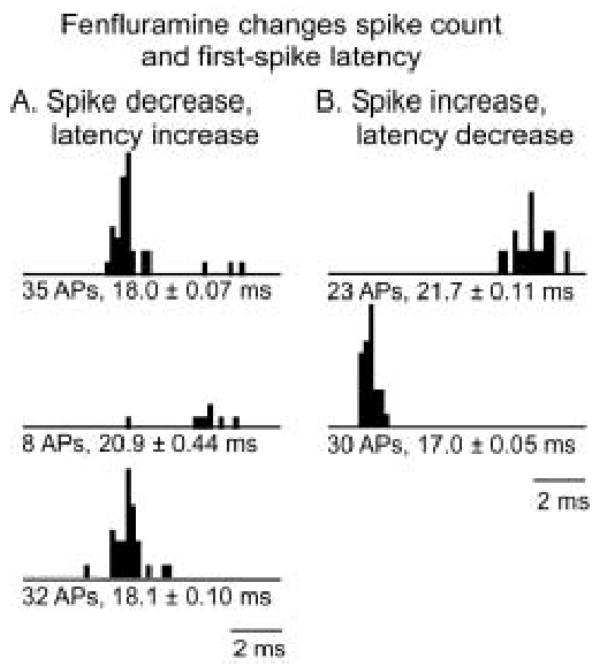
PSTHs of different effects of fenfluramine. A. Fenfluramine decreases spike count and increases first spike latency, with full recovery after the cessation of iontophoresis. The stimulus for this neuron was a 10 kHz FM sweep centered at 33 kHz, at 50 dB SPL. B. In another neuron, fenfluramine increased the spike count and decreased first spike latency. The stimulus presented to this neuron was a 10 kHz FM sweep centered at 25 kHz, at 10 dB SPL. Text below the PSTHs refer to spike counts and average first spike latencies ± S.E.M.; AP = action potential.
Across the population of 95 neurons, 43.1% (41 neurons) responded to fenfluramine with significant changes in spike count. The iontophoresis of fenfluramine most commonly resulted in the depression of neural responses (35/41, or 85.4%) as for the neuron in figure 1A, but response facilitations also occurred in a subset of neurons (6/41, or 14.6%), as figure 1B attests. These results were similar to previous reports of the effects of serotonin (Hurley and Pollak 1999, 2005a,b). Although the effects of fenfluramine on spike count could be classified as statistically significant versus non-significant, the sizes of spike count changes varied continuously across the population. This is illustrated by figure 2, a plot of the z-scores of changes in spike rate for all 95 neurons recorded ((d− davg)/stdevd), where d = the difference between spike rate in the presence of fenfluramine and in the control). Open bars represent neurons with no significant change in spike count. These cluster around the dashed line indicating no change in spike rate (d = 0), but were biased towards spike rate decreases. Filled bars represent neurons with significant changes in spike rate. Although more of these neurons occur at either end of the distribution, they are most numerous in the direction of spike rate decreases.
Figure 2.
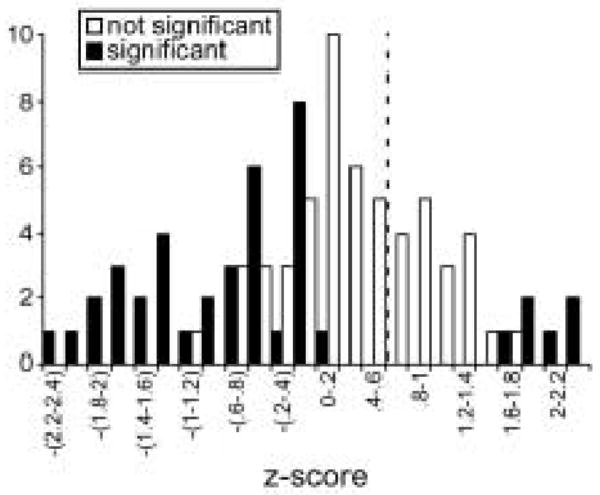
Fenfluramine effects across the IC population (n = 95) expressed as Z-scores ((d−davg)/stdevd), where d = the difference in spike rate between the drug and control conditions, expressed as the numbers of neurons showing z-scores of different size. The dashed line marks zero change in spike rate. Filled bars indicate neurons with statistically significant changes in spike rate, and open bars indicate neurons with nonsignificant changes in spike rate (2-tailed unpaired t-tests). Most neurons responded to fenfluramine with decreases in spike rate.
Changes in latency were less common than changes in spike count. Latency changes in response to fenfluramine were observed in 27 of 72 (37.5%) neurons, with the most prevalent response being a latency increase (21 neurons). The number of neurons analyzed for latency changes evoked by fenfluramine is lower than for neurons with spike count changes, 72 instead of 95. The reason for this is evident in the population plot of figure 2; fenfluramine reduced the spike counts of many neurons too strongly to allow measurements of average latency. A comparison of the changes in spike count versus first spike latency for all neurons that responded to fenfluramine with a significant change in spike count or latency (n = 39) is shown in the scatterplot of figure 3. Most of the neurons in the population fall into the upper left or lower right quadrants, indicating that the effects of fenfluramine on spike count and latency were inversely related; decreases in spike count were accompanied by increases in latency and vice versa. This is not an unexpected finding, since spike count decreases and latency increases may both occur in response to a suppression of neural responsiveness. A subset of IC neurons, however, change their latencies and spike counts independently of each other in response to the application of serotonin, consistent with the temporally defined inputs that establish latency in some IC neurons (Hurley and Pollak 2005b). In fact, in the plot of figure 3, some neurons have values that do not fall within the upper left quadrant, demonstrating that fenfluramine-evoked changes in spike count and latency were not always coupled for IC neurons, similar to serotonin-evoked changes.
Figure 3.
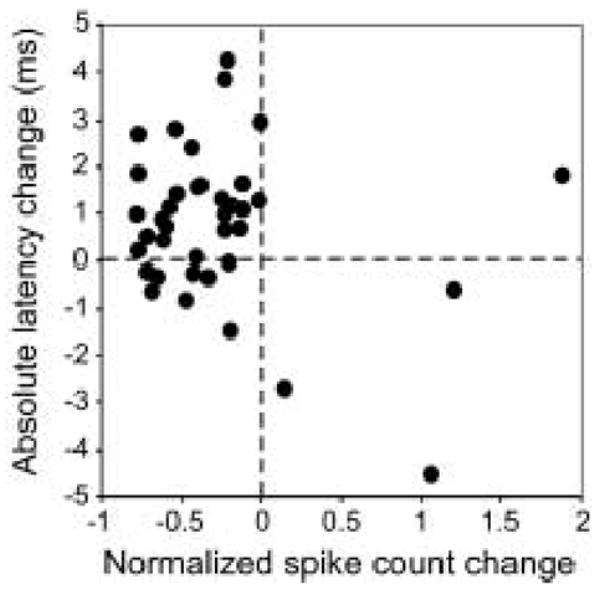
Comparison of fenfluramine-evoked changes in spike count versus latency for neurons showing significant changes in spike count or latency, and for which both of these response properties could be measured (n = 39). Changes in spike count are normalized to control values, but changes in latency are reported as absolute values. Most neurons show coordinated decreases in spike count and increases in latency (upper left quadrant).
The effects of fenfluramine did not decline substantially during neural recordings that lasted up to an hour or more. Fenfluramine-evoked changes in spike count developed fully over the course of minutes. This is illustrated by the plot of proportional change in spike count versus time in figure 4A. The solid and dashed lines represent the spike counts of two different neurons over time. Spike counts are normalized to the first control value (proportional change in spike count = 0). The dashed gray line represents the time of onset of fenfluramine application, and the two gray arrows mark the time of the halt of iontophoresis for each individual neuron. The two different neurons exhibited slightly different time courses of response to fenfluramine; the neuron represented by the solid line responded quickly (within 3 minutes) and recovered more slowly over about 10 minutes. The neuron represented by the dashed line responded to fenfluramine relatively slowly, with a full response not developing until about 9 minutes after the onset of iontophoresis, but showed a more rapid partial recovery about 5 minutes after the halt of iontophoresis. Across a group of 14 neurons that were recorded at multiple time points, relatively rapid responses to fenfluramine application were typical, and the initial measurement of fenfluramine-evoked changes in spike count by 2 minutes after the onset of fenfluramine application (47.4 ± 6.6% change from baseline) did not vary significantly from measurements taken after 5 minutes of fenfluramine application (41.6 ± 8.9% change from baseline, p = .34, 2-tailed paired t-test; Fig. 4A, inset).
Figure 4.
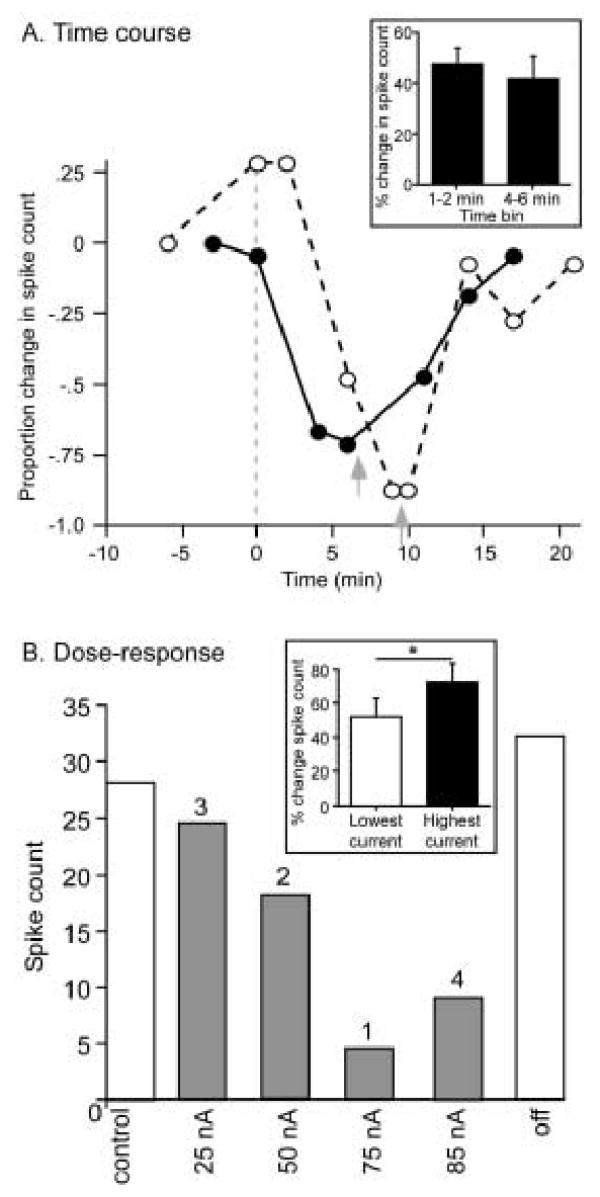
Time course and dose dependence of fenfluramine effects. A. Plot of the proportional changes in spike count over time, normalized to the initial control values as (drug-control/control spike counts), so that no change = 0. Solid and dashed lines represent the spike counts of two different neurons over time. The dashed gray line represents the time of onset of fenfluramine application, and the two gray arrows mark the time of the halt of iontophoresis for each individual neuron. Stimuli consisted of a 30 kHz tone at 40 dB SPL for the neuron represented by the solid line, and a 10 kHz FM sweep centered at 25 kHz at 20 dB SPL for the neuron represented by the dashed line. Iontophoretic currents were 60 nA for the neuron represented by the solid line and 75 nA for the neuron represented by the dashed line. Inset: population averages for 14 neurons recorded 2 minutes or less after the start of fenfluramine application and 4–6 minutes after the start of fenfluramine application. These two values are not significantly different (p = .34, 2-tailed paired t-test). B. Spike counts of a single neuron at 4 different levels of iontophoretic current. Numbers above the bars indicate the sequence of the different levels over time, so that the current of 75 nA was applied first, and the current of 85 nA was applied last. The stimulus was a 10 kHz FM sweep centered at 26 kHz at 20 dB SPL. Inset: population averages for neurons at the lowest versus highest doses of iontophoretic current applied to each neuron (n = 34). These two values are significantly different (p = .003, 2-tailed paired t-test).
Additionally, sequential applications of serotonin at different levels of iontophoretic current produced dose-dependent effects. Figure 4B shows the spike counts of a single neuron at 4 different levels of iontophoretic current. Numbers above the bars indicate the sequence of the different levels over time, so that the current of 75 nA was applied first, and the current of 85 nA was applied last. The 50 nA current reduced the spike count partially, with the maximal effect of fenfluramine occurring at 75 nA. Because of slight variations in diameter of the iontophoresis pipettes and the potentially varying distance from the pipette to serotonin receptors for any given neuron, the absolute levels of iontophoretic current cannot be equated among neurons. Multiple levels of iontophoretic current, however, were used on 34 neurons. A comparison of the normalized effects of fenfluramine between the highest and lowest levels of iontophoretic current to single neurons does show dose-dependence, with the lowest current levels causing a 52.1 ± 10.5% change in spike count and the highest current levels causing a 72.5 ± 11.2% change in spike count (p = .003, 2-tailed paired t-test; Fig. 4B, inset). Both the time course and the dose dependence of the effects of fenfluramine suggest that this drug did not deplete serotonin stores during our experiments.
Are the effects of fenfluramine mediated by serotonin release?
Fenfluramine and serotonin
Although the effects of fenfluramine are quite similar to those previously reported for iontophoresed serotonin (Hurley and Pollak 2001), fenfluramine also releases norepinephrine at a lower affinity than serotonin (Rowland and Carlton 1986; Rothman et al. 2003). In order to determine whether the effects of fenfluramine are mediated by serotonin, we directly compared the effects of fenfluramine and serotonin in 20 neurons. In the majority of neurons, fenfluramine and serotonin had similar effects. An example is shown in figure 5A. For the neuron in this figure, fenfluramine and subsequently serotonin decreased the spike count relative to the control value (2-tailed unpaired t-tests, p<0.05), but the neuron at least partially recovered its initial spike count after the iontophoresis of each drug was halted. The effects of serotonin versus fenfluramine on spike count are compared for all 20 neurons in figure 5B. For most neurons, there is good agreement in both the directions and sizes of effects of the two drugs, with a predominance of spike count decreases evoked by both drugs. However, a few neurons do not fit this pattern; for 3–4 neurons, one of the drugs had a large effect but the other did not. Because of the two most extreme outliers marked by asterisks, linear regression of the effects of serotonin and fenfluramine is not significant (p = 0.7, r2 = .009); excluding these two values, the relationship is significant (p = 0.007; r2 = .37).
Figure 5.
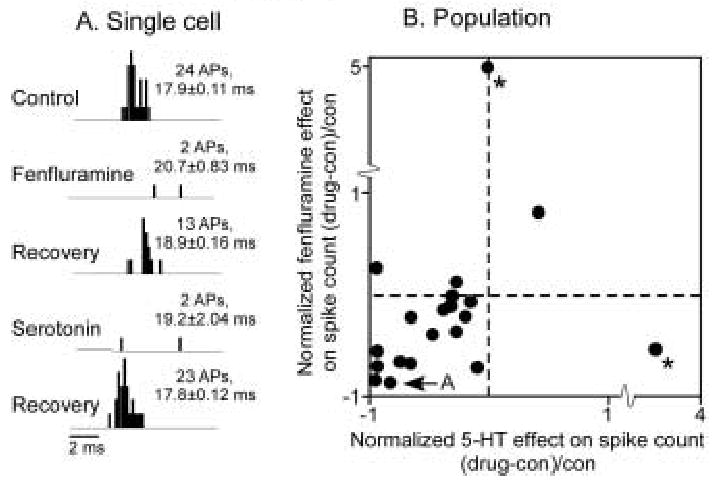
Comparison of the effects of fenfluramine and serotonin in the same neurons. A. PSTH of a neuron for which serotonin and fenfluramine both decreased spike counts. Spike counts partially recovered after the application of each drug. The stimulus for this neuron was a 10 kHz FM sweep centered at 23 kHz, at 50 dB SPL. B. Plot of normalized fenfluramine- and serotonin-evoked changes in spike count in 20 neurons to which both drugs were applied. Most neurons showed similar responses to fenfluramine and serotonin. Asterisks mark outliers. The regression including the outliers is not significant (p = 0.7; r2 = .009), but the regression excluding the two outliers is significant (p = 0.007; r2 = .37).
Serotonin receptor antagonists
If the effects of iontophoresed fenfluramine are due to the release of endogenous serotonin, then they should be blocked by serotonin receptor antagonists. We directly tested this hypothesis in a set of 34 IC neurons by applying fenfluramine concurrently with several different serotonin (5-HT) receptor antagonists after observing the effects of fenfluramine alone. Among the 7 families of serotonin receptor, many have been reported to be present in the IC (for example, 5-HT1: Thompson et al. 1994; Peruzzi and Dut 2004, 5-HT2: Cornea-Hébert et al. 1999; Harlan et al. 2000, 5-HT3: Morales et al. 1998, 5-HT4: Vilaró et al. 2005; 5-HT7: To et al. 1995; Heidmann et al. 1998). This means that no single type of serotonin receptor antagonist is likely to block all of the effects of fenfluramine-evoked serotonin release. Thus, the strategy taken to evaluate whether serotonin receptor antagonists block any of the effects of fenfluramine was to use antagonists against two common types of serotonin receptor, both alone and in combination. The first of these antagonists, WAY-100635, selectively blocks the 5-HT1A receptor (Fletcher et al. 1996), a receptor type that is expressed by many IC neurons (Thompson et al. 1994; Peruzzi and Dut 2004). The second antagonist, mianserin, may be relatively selective for 5-HT2 receptors, but it also has affinity for 5-HT1, 5-HT6 and 5-HT7 receptors (Hoyer et al. 1994). Of the 34 neurons tested with serotonin receptor antagonists, 17 neurons were exposed to WAY-100635, 10 neurons were exposed to mianserin, and 7 neurons were exposed to a mixture of the two drugs. Because the effects of serotonin and serotonin receptor antagonists are sometimes selective for responses to particular frequencies or intensities (Hurley and Pollak 2001; Hurley 2006), the effects of the antagonists were evaluated in frequency tuning plots and rate-level functions. The criterion used to gauge whether fenfluramine or the antagonists had an effect on neural responsiveness was a 30% change in spike count across at least two consecutive frequencies or intensities tested.
Figure 6 illustrates neurons for which the antagonists blocked the effects of fenfluramine. Figure 6A is a rate-level function of a neuron for which fenfluramine decreased the spike count at every intensity. When WAY-100635 was applied concurrently with fenfluramine, it blocked the effects of fenfluramine. In figure 6B, an isointensity frequency plot, fenfluramine increased the spike count, most notably at frequencies above and below the BF. The effect of fenfluramine was blocked by co-application with mianserin.
Figure 6.
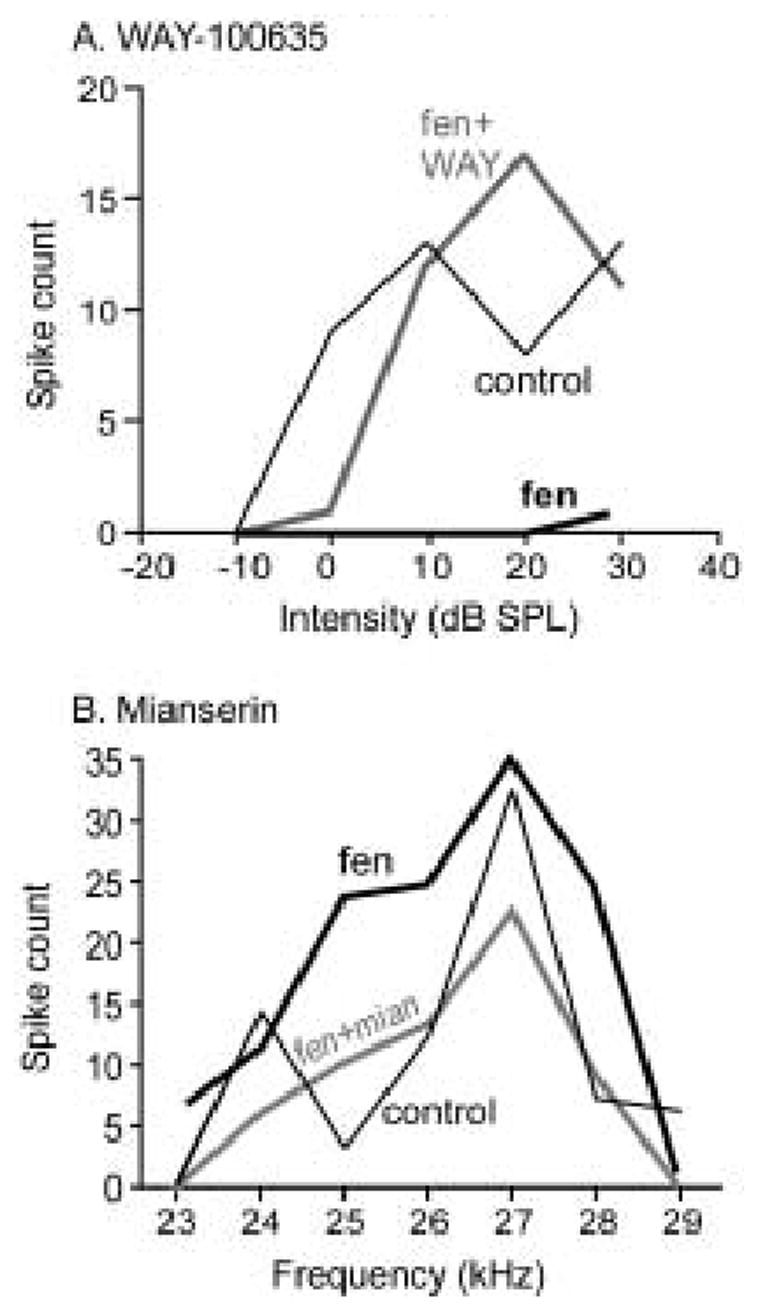
Serotonin receptor antagonists block the effects of fenfluramine. A. Rate-level function for a single neuron in the control, during fenfluramine application (fen), and during the co-application of fenfluramine and WAY100635 (fen + WAY). Fenfluramine depressed spike counts, and the 5-HT1A antagonist WAY100635 blocked this effect. The stimulus presented to this neuron was a 10 kHz FM sweep centered at 19 kHz. B. Isointensity frequency tuning plot for another neuron for which fenfluramine increased spike counts. For this neuron, the 5-HT2 receptor antagonist mianserin prevented the fenfluramine-evoked spike count increase (fen + mian). Tones were presented at 50 dB SPL.
WAY100635 and mianserin did not always block the effects of fenfluramine. In some neurons, the effects of these antagonists diverged from or even potentiated those of fenfluramine. Table 1 summarizes the effects of antagonists on all neurons tested. Across all antagonist applications, the two largest categories are 1) neurons for which antagonists blocked the effect of fenfluramine (n = 8), as in figure 6, and 2) neurons for which fenfluramine altered spike counts but the antagonists had no effect (n = 11). Smaller categories are those containing neurons for which neither fenfluramine nor antagonists altered spike count (‘No change any’), for which the antagonists had the same effect as, or potentiated the effect of, fenfluramine (‘Antagonist same effect’), and for which fenfluramine had no effect but the antagonists did (n = 5 each).
Table 1.
Numbers of neurons with different effects of fenfluramine versus serotonin receptor antagonists.
| Total | Antagonist blocks | Fen. effect antag. no effect | No change any | Antagonist same effect | Fen no effect antag. effect |
|---|---|---|---|---|---|
| WAY-100635 17 | 4 | 6 | 2 | 1 | 4 |
| Mianserin 10 | 3 | 2 | 2 | 2 | 1 |
| Mian + WAY 7 | 1 | 3 | 1 | 2 | 0 |
|
|
|||||
| Total 34 | 8 | 11 | 5 | 5 | 5 |
Fenfluramine effects in different regions of the IC
Previous studies have shown that serotonergic projections are heterogeneously distributed throughout the IC. Within the central nucleus of the IC, serotonergic fibers are denser in the dorsomedial region than in the ventral and lateral regions (Kaiser and Covey 1997; Hurley and Thompson 2001). Thus, one way that the effects of fenfluramine could differ from those of serotonin is in the recording depths or CFs of the neurons it targets. We tested this hypothesis by looking at the effects of fenfluramine on spike count versus recording depth and CF for all neurons recorded. The results of this analysis are plotted in figure 7. As can be seen in this figure, the normalized effect of fenfluramine on spike count did not show directional trends across depth (Fig. 7A) or CF (Fig. 7B), and these relationships were not significant (linear regression, p = .943 and r2 = 0 for spike count change vs. depth; p = .476 and r2 = .005 for spike count change vs. CF).
The effect of fenfluramine on first spike latency rather than spike count was also not correlated directly with depth or CF (p > .05) but a different type of spatial pattern emerged in the response of latency to fenfluramine. This can be seen in figure 8A, a plot of best frequency versus depth. For a given depth, neurons that responded to fenfluramine with significant increases in first spike latency (n = 21, filled circles) had a lower CF than neurons showing latency increases or no latency changes (n = 50, open circles; multiple regression with depth as a continuous variable and latency increase as a binomial variable. p < .001 for the overall regression, p < .001 and beta = .61 for depth, p = .003 and beta = −.28 for latency increase).
Figure 8.
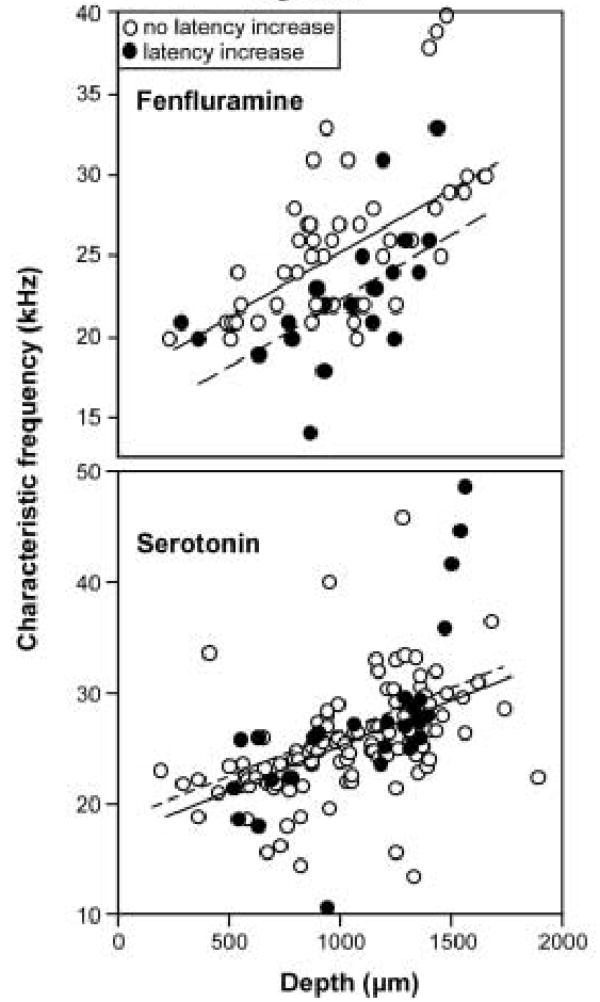
Spatial variation in the effects of fenfluramine. Plot of CF versus recording depth for neurons showing latency increases (filled circles, n = 21) and those not showing latency increases (open circles, n = 50). Neurons responding to fenfluramine with an increase in latency have lower CFs than other neurons recorded at similar depths (multiple regression with depth as a continuous variable and latency increase as a binomial variable. p < .001 for the overall regression, p < .001 and beta = .61 for depth, p = .003 and beta = −.28 for latency increase). B. Iontophoretic application of serotonin to a sample of 132 neurons recorded in a previous study did not follow the same pattern (multiple regression, p < .001 for the overall regression due to the correlation between CF and depth: p < .001, beta = .486, but p = .197 and beta = .010 for latency increase).
The relatively small number of neurons exposed to serotonin in this study makes it difficult to perform the same analysis for serotonin. However, recording depth, CF, and the effect of serotonin on latency have been measured for many neurons exposed to serotonin in a previous study in Mexican free-tailed bat using identical experimental techniques, although the data were not examined in the same way (Hurley and Pollak 2005b). Figure 8B plots the data from this previous study as a comparison. The relevant parameters of the different populations of neurons in figures 8A and 8B (CF, depth, and latency change) were compared to determine whether these parameters were similar in the two populations. Mean recording depths and latency changes were not significantly different in these populations (p = .92 for depth, p = .79 for latency change, 2-tailed unpaired ttests). There was a difference in CF that, although significant (p = .039), was relatively small (25.8 kHz for the current fenfluramine database and 24.3 kHz for the previous serotonin database). As figure 8B shows, neurons responding to serotonin with increases in first spike latency are not encountered at lower recording depths than other neurons in this separate large sample of neurons (n = 132, multiple regression, p < .001 for the overall regression due to the correlation between CF and depth: p < .001, beta = .486, but p = .197 and beta = .010 for latency increase).
DISCUSSION
Activating serotonin receptors in the IC directly with exogenously applied serotonin alters the responses of many IC neurons to sound, but bypasses the dense serotonergic projections found within the IC. The broad hypothesis tested in this study was that activating the serotonergic pathway at an earlier stage, by releasing serotonin from projections within the IC, would differ in its effects from directly applying serotonin either regionally or temporally. Our findings support two main conclusions. The first of these is that the iontophoretic application of fenfluramine does release serotonin in the IC. The second is that the effects of releasing serotonin with fenfluramine are substantially similar to those of applying serotonin directly, although a subtle spatial pattern of the effects of fenfluramine emerged when not only the depth but also the characteristic frequency of the recorded neurons was considered. Below, we discuss the evidence underlying these conclusions, and describe a model of the spatial pattern of neurons responsive to fenfluramine relative to the gradient of serotonergic fiber density and laminar frequency organization of the IC.
Iontophoretic application of fenfluramine releases serotonin
Two lines of evidence suggest that the fenfluramine iontophoresed in this study acted by releasing serotonin. The first of these is the similarity in the effects of fenfluramine relative to those of serotonin in previous studies; both fenfluramine and serotonin predominantly depress spike counts and increase latencies (Hurley and Pollak 1999, 2001). Furthermore, when these two drugs were applied sequentially to the same neurons in the present study, their effects were also similar (Fig. 5). Neurons with divergent effects of fenfluramine and serotonin were in the minority, but for these neurons it is possible that fenfluramine had effects other than the release of serotonin. In addition to releasing serotonin, fenfluramine can trigger the release of norepinephrine, although at a lower efficacy, and may also alter dopamine release through direct or indirect mechanisms (Rowland and Carlton 1986; Rothman et al. 2003). Thus, for the small number of neurons in which the effects of fenfluramine and serotonin did not coincide, it is possible that the divergent effects were due to fenfluramine-evoked release of another signaling molecule instead of, or in addition to, the release of serotonin.
The block of the effects of fenfluramine by selective antagonists of serotonin receptors in some neurons also supports the contention that fenfluramine acted through the release of serotonin (Fig. 6). The number of neurons showing effects of fenfluramine that could be blocked by the antagonists was relatively small compared to the total sample size (Table 1, 1st column), and the responses of some neurons to fenfluramine were not altered by the antagonists (Table 1, 2nd column). This is consistent with the diversity of serotonin receptor types thought to be present in the IC (Thompson et al. 1994; Peruzzi and Dut 2004; Cornea-Hébert et al. 1999; Harlan et al. 2000; Morales et al. 1998; Vilaró et al. 2005; To et al. 1995; Heidmann et al. 1998), because using antagonists selective for one or two receptor types would not be effective for neurons without these receptor types.
Two other types of antagonist effects also occurred in different neurons; antagonists altered the spike counts of some neurons that did not respond to fenfluramine, and antagonists had effects similar to those of fenfluramine in other neurons. Both of these phenomena are consistent with several features of the serotonin system in vivo. For example, the spontaneous release of serotonin during these experiments could have occupied receptors so that they were unresponsive to fenfluramine, but were capable of responding to antagonists (Table 1, 5th column). Alternatively, if neurons express multiple types of serotonin receptors in the IC, a common occurrence in other brain regions (Amargos-Bosch et al. 2004; Beique et al. 2004; Santana et al. 2004), the block of one type of receptor could unmask the effects of another, so that the antagonist could have the same effect as, or even potentiate the effect of, fenfluramine (Table 1, 4th column).
Fenfluramine and serotonin effects are similar
Serotonin levels in the IC increase after the injection of salicylate (Liu et al. 2003) and do not after exposure to noise (Cransac et al 1998), but little else is known regarding the dynamics of serotonin in the IC. One of our initial predictions was that fenfluramine would deplete serotonin stores during continual application, because fenfluramine causes a peak and subsequent decline in serotonin levels over the course of tens of minutes to several hours when administered systemically (Auerbach et al. 1989; Carboni and Di Chiara 1989; LaFerrere and Wurtman 1989; Rothman et al. 1999; Tao et al. 2002; Rothman et al. 2003), and more rapidly when administered locally (Schwartz et al. 1989). Refuting this prediction, the effects of fenfluramine did not decay appreciably over the course of several minutes. In addition, across multiple sequential applications, the effects of fenfluramine were dose-dependent. Both findings argue against substantial depletion of serotonin stores over this period.
A second prediction was that fenfluramine would show a gradient in its effects dorsoventrally along the tracks of the recording electrodes. This prediction reflects the gradient in the density of serotonergic fibers seen in the central IC of multiple species of mammals, including the Mexican free-tailed bat. In multiple species, serotonergic fibers in the central IC are denser dorsomedially, with regions of lower density ventrally and sometimes laterally (Klepper and Herbert 1991; Kaiser and Covey 1997; Hurley and Thompson 2001). These fibers are both sources of and sinks for serotonin because they house serotonergic reuptake sites as well as sites for serotonin release (Nielsen et al. 2006). Therefore, such a gradient could conceivably lead to either an increased concentration of serotonin dorsomedially within the central IC in response to fenfluramine, or simply to a more rapid turnover of serotonin in this region. In practice, we did not observe a depth or CF gradient in the effects of fenfluramine.
A difference in the effects of fenfluramine versus serotonin
One spatial pattern in the effect of fenfluramine did emerge when not simply recording depth or CF, but both of these factors, were considered. This was that neurons responding to fenfluramine with increases in their first spike latencies were found ventral relative to other neurons across a spectral range (Fig. 8A). This pattern was not seen in previously gathered data on the effects of iontophoresed serotonin (Fig 8B), and is especially interesting when viewed in the light of the orientation of frequency laminae within the IC. Anatomical and physiological evidence suggests the presence of fibrodendritic frequency laminae that are oriented roughly dorsolateral to ventromedial when viewed in the transverse plane within the IC of most mammals (reviewed in Irvine 1992; Schreiner and Langner 1997; Oliver and Huerta 1992; Malmierca 2003). The pattern of effects of fenfluramine seen in figure 8A is suggestive of the regionalization of neurons that exhibit serotonin-evoked latency increases within this laminar organization. This is schematically diagrammed in figure 9, a transverse section of the IC of the Mexican free-tailed bat (Hurley and Thompson 2001). The shaded region represents the central nucleus of the IC, and the solid lines mark the general orientation of frequency laminae. If the neurons responding to fenfluramine with increased latencies were clustered orthogonally to the frequency laminae as illustrated by the dashed outline in figure 9, this would account for the pattern of effects observed in figure 8A. That is, for a given frequency region, neurons responding to fenfluramine with increased latencies would be encountered at greater recording depths. Likewise, for a given recording depth, neurons responding to fenfluramine with increased latencies would have lower CFs. Because these neurons span a wide range of CFs and recording depths, however, no direct relationship between the effects of fenfluramine and these variables would emerge. The gradient of serotonergic fibers within the central IC of the free-tailed bat is also roughly orthogonal to the orientation of frequency laminae (darker shading = greater fiber density; based on Hurley and Thompson 2001), so this model implies that the latency-increasing neurons are not located in regions of the IC with the highest density of serotonergic fibers. This could be a reflection of either a specialized response to serotonin on the part of these neurons irrespective of fiber density, or of the possibility that serotonin receptors in the fiber-dense regions of the central IC are already occupied by endogenously released serotonin.
Figure 9.
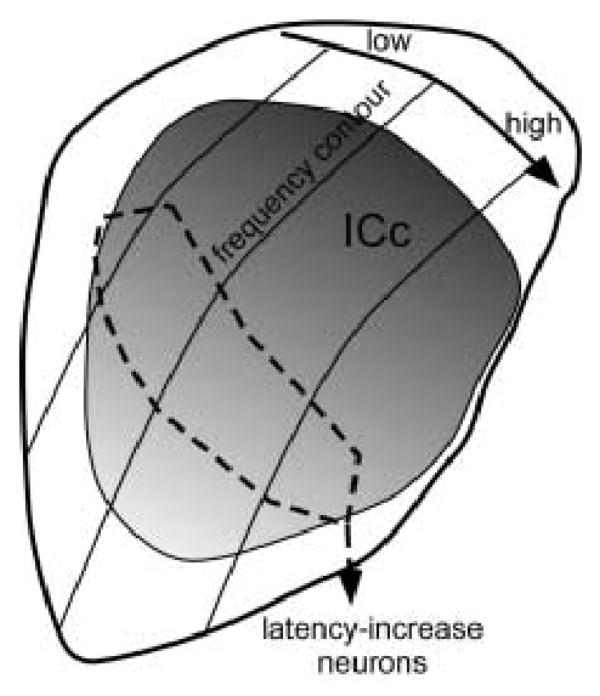
A model of the regionalization of neurons responding to fenfluramine with increases in spike count. Details are contained in the text.
The functional implications of such clustering in responsiveness to fenfluramine is unclear. Within the frequency laminae of the IC there exist secondary spatial gradients in response properties, including a gradient in the limited range of frequencies contained in a single lamina that is orthogonal to the main frequency axis in the IC (Schreiner and Langner 1997). In addition to a gradient in CFs, there are gradients in other types of response properties including the pattern of the spike train, the shape of the frequency tuning curve, selectivity for FM sweeps, or the degree to which binaural responsiveness is shaped by ipsilateral inhibition (Wenstrup et al. 1985, 1986; Bruckner and Rubsamen 1995; Hage and Ehret 2003; Ehret et al. 2003). Because we did not measure these response properties in the current study, we cannot evaluate whether fenfluramine selectively increases the latencies of these types of neurons, but these possibilities can be tested in the future.
Other determinants of the selectivity of serotonergic effects
Tempering these conclusions is the fact that fenfluramine may be an imperfect mimic of endogenously released serotonin in some ways. Because it acts on the serotonin transporter to induce serotonin release (Baumann et al. 2000; Itzhak and Ali 2006), the exact locations and amount of serotonin released by fenfluramine may differ from endogenous release. In addition, the possible prevention of reuptake through the transporters (Rowland and Carlton, 1986; Baumann et al. 2000) could prolong serotonin availability. Despite these caveats, the lack of predicted differences in response to the iontophoresis of fenfluramine and serotonin is consistent with the interpretation that the pattern of release or reuptake of serotonin is only one of the factors in determining its effects in the current experimental paradigm. Spatial or temporal variation in the effects of serotonin could also be mediated at other steps along the serotonergic pathway, including at the level of serotonin receptors. In fact, some serotonin receptor agonists differentially affect neurons with V- versus non-V shaped tuning curves, suggesting that functionally distinct neuron types differentially express serotonin receptors (Hurley 2006). Thus, serotonin receptors likely play an important role in determining the regional or temporal dynamics of the effects of serotonin release in the IC.
In summary, the evidence presented here supports the use of fenfluramine as a tool to locally release serotonin from the endogenous serotonergic plexus within the IC. Although some differences emerged between the effects of iontophoresed serotonin and fenfluramine, their many similarities suggest that factors in addition to the patterns of serotonin release determine the responsiveness to serotonin in this auditory nucleus.
Acknowledgments
These experiments were supported in part by NIDCD grant DC006608. This work has been presented in part in abstract form. The authors would like to thank Dr. GT Smith for helpful advice on the manuscript.
Footnotes
Publisher's Disclaimer: This is a PDF file of an unedited manuscript that has been accepted for publication. As a service to our customers we are providing this early version of the manuscript. The manuscript will undergo copyediting, typesetting, and review of the resulting proof before it is published in its final citable form. Please note that during the production process errors may be discovered which could affect the content, and all legal disclaimers that apply to the journal pertain.
References
- Amargos-Bosch M, Bortolozzi A, Puig M, Serrats J, Adell A, Celada P, Toth M, Mengod G, Artigas F. Co-expression and in vivo interaction of serotonin1A and serotonin2A receptors in pyramidal neurons of prefrontal cortex. Cereb Cortex. 2004;14(3):281–299. doi: 10.1093/cercor/bhg128. [DOI] [PubMed] [Google Scholar]
- Auerbach S, Minzenberg M, Wilkinson L. Extracellular serotonin and 5-hydroxyindoleacetic acid in hypothalamus of the unanesthetized rat measured by in vivo dialysis coupled to high-performance liquid chromatography with electrochemical detection: dialysate serotonin reflects neuronal release. Brain Res. 1989;499(2):281–290. doi: 10.1016/0006-8993(89)90776-2. [DOI] [PubMed] [Google Scholar]
- Baumann M, Ayestas M, Dersch C, Partilla J, Rothman R. Serotonin transporters, serotonin release, and the mechanism of fenfluramine neurotoxicity. Ann N Y Acad Sci. 2000;914:172–186. doi: 10.1111/j.1749-6632.2000.tb05194.x. [DOI] [PubMed] [Google Scholar]
- Baumann MH, Ayestas MA, Dersch CM, Rothman RB. 1-(m-chlorophenyl)piperazine (mCPP) dissociates in vivo serotonin release from long-term serotonin depletion in rat brain. Neuropsychopharmacol. 2001;24(5):492–501. doi: 10.1016/S0893-133X(00)00221-9. [DOI] [PubMed] [Google Scholar]
- Beique JC, Chapin-Penick EM, Mladenovic L, Andrade R. Serotonergic facilitation of synaptic activity in the developing rat prefrontal cortex. J Physiol. 2004;556(Pt 3):739–54. doi: 10.1113/jphysiol.2003.051284. [DOI] [PMC free article] [PubMed] [Google Scholar]
- Blakely R, Bauman A. Biogenic amine transporters: regulation in flux. Curr Opin Neurobiol. 2000;10(3):328–336. doi: 10.1016/s0959-4388(00)00088-x. [DOI] [PubMed] [Google Scholar]
- Bruckner S, Rubsamen R. Binaural response characteristics in isofrequency sheets of the gerbil inferior colliculus. Hear Res. 1995;86(1–2):1–14. doi: 10.1016/0378-5955(95)00048-9. [DOI] [PubMed] [Google Scholar]
- Bunin M, Wightman R. Quantitative evaluation of 5-hydroxytryptamine (serotonin) neuronal release and uptake: an investigation of extrasynaptic transmission. J Neurosci. 1998;18(13):4854–4860. doi: 10.1523/JNEUROSCI.18-13-04854.1998. [DOI] [PMC free article] [PubMed] [Google Scholar]
- Carboni E, Di Chiara G. Serotonin release estimated by transcortical dialysis in freely-moving rats. Neurosci. 1989;32(3):637–645. doi: 10.1016/0306-4522(89)90285-6. [DOI] [PubMed] [Google Scholar]
- Casseday JH, Covey E. Frequency tuning properties of neurons in the inferior colliculus of an FM bat. J Comp Neurol. 1992;319(1):34–50. doi: 10.1002/cne.903190106. [DOI] [PubMed] [Google Scholar]
- Cobb WS, Abercrombie ED. Differential regulation of somatodendritic and nerve terminal dopamine release by serotonergic innervation of substantia nigra. J Neurochem. 2003;84(3):576–84. doi: 10.1046/j.1471-4159.2003.01546.x. [DOI] [PubMed] [Google Scholar]
- Consolo S, Arnaboldi S, Ramponi S, Nannini L, Ladinsky H, Baldi G. Endogenous serotonin facilitates in vivo acetylcholine release in rat frontal cortex through 5-HT 1B receptors. J Pharmacol Exp Ther. 1996;277(2):823–830. [PubMed] [Google Scholar]
- Cornea-Hebert V, Riad M, Wu C, Singh S, Descarries L. Cellular and subcellular distribution of the serotonin 5-HT2A receptor in the central nervous system of adult rat. J Comp Neurol. 1999;409(2):187–209. doi: 10.1002/(sici)1096-9861(19990628)409:2<187::aid-cne2>3.0.co;2-p. [DOI] [PubMed] [Google Scholar]
- Cransac H, Cottet-Emard J, Hellstrom S, Peyrin L. Specific sound-induced noradrenergic and serotonergic activation in central auditory structures. Hear Res. 1998;118(1–2):151–156. doi: 10.1016/s0378-5955(98)00031-8. [DOI] [PubMed] [Google Scholar]
- Ebert U, Ostwald J. Serotonin modulates auditory information processing in the cochlear nucleus of the rat. Neurosci Lett. 1992;145:51–54. doi: 10.1016/0304-3940(92)90201-h. rat, CN, cochlear nucleus, serotonin, 5HT. [DOI] [PubMed] [Google Scholar]
- Ehret G, Egorova M, Hage SR, Muller BA. Spatial map of frequency tuning-curve shapes in the mouse inferior colliculus. Neuroreport. 2003;14(10):1365–9. doi: 10.1097/01.wnr.0000078545.07662.85. [DOI] [PubMed] [Google Scholar]
- Fletcher A, Forster E, Bill D, Brown G, Cliffe I, Hartley J, Jones D, McLenachan A, Stanhope K, Critchley D, Childs K, Middlefell V, Lanfumey L, Corradetti R, Laporte A, Gozlan H, Hamon M, Dourish C. Electrophysiological, biochemical, neurohormonal and behavioural studies with WAY-100635, a potent, selective and silent 5-HT1A receptor antagonist. Behav Brain Res. 1996;73(1–2):337–353. doi: 10.1016/0166-4328(96)00118-0. [DOI] [PubMed] [Google Scholar]
- Foehring R, van Brederode J, Kinney G, Spain W. Serotonergic modulation of supragranular neurons in rat sensorimotor cortex. J Neurosci. 2002;15(22):8238–8250. doi: 10.1523/JNEUROSCI.22-18-08238.2002. [DOI] [PMC free article] [PubMed] [Google Scholar]
- Hage SR, Ehret G. Mapping responses to frequency sweeps and tones in the inferior colliculus of house mice. Eur J Neurosci. 2003;18(8):2301–12. doi: 10.1046/j.1460-9568.2003.02945.x. [DOI] [PubMed] [Google Scholar]
- Harlan R, Yuan Y, Garcia M. Serotonin 5-HT2C receptors in central auditory pathways. ARO abstr. 2000;23:113. [Google Scholar]
- Havey DC, Caspary DM. A simple technique for constructing ‘piggyback’ multibarrel microelectrodes. Electroenceph Clin Neurophysiol. 1980;48(2):249–251. doi: 10.1016/0013-4694(80)90313-2. [DOI] [PubMed] [Google Scholar]
- Heidmann D, Szot P, Kohen R, Hamblin M. Function and distribution of three rat 5-hydroxytryptamine7 (5-HT7) receptor isoforms produced by alternative splicing. Neuropharmacol. 1998;37(12):1621–1632. doi: 10.1016/s0028-3908(98)00070-7. [DOI] [PubMed] [Google Scholar]
- Hoyer D, Clarke D, Fozard J, Hartig P, Martin G, Mylecharane E, Saxena P, Humphrey P. International Union of Pharmacology classification of receptors for 5-hydroxytryptamine (Serotonin) Pharmacol Rev. 1994;46(2):157–203. [PubMed] [Google Scholar]
- Hurley LM. Different serotonin receptor agonists have distinct effects on sound-evoked responses in inferior colliculus. J Neurophysiol. 2006 doi: 10.1152/jn.00046.2006. Epub ahead of print. [DOI] [PMC free article] [PubMed] [Google Scholar]
- Hurley LM, Devilbiss D, Waterhouse B. A matter of focus: monoaminergic modulation of stimulus coding in mammalian sensory networks. Curr Opin Neurobiol. 2004;14(4):488–495. doi: 10.1016/j.conb.2004.06.007. [DOI] [PubMed] [Google Scholar]
- Hurley LM, Pollak GD. Serotonin differentially modulates responses to tones and frequency-modulated sweeps in the inferior colliculus. Journal of Neuroscience. 1999;19(18):8071–8082. doi: 10.1523/JNEUROSCI.19-18-08071.1999. [DOI] [PMC free article] [PubMed] [Google Scholar]
- Hurley LM, Pollak GD. Serotonin effects on frequency tuning of inferior colliculus neurons. J Neurophysiol. 2001;85(2):828–842. doi: 10.1152/jn.2001.85.2.828. [DOI] [PubMed] [Google Scholar]
- Hurley LM, Pollak GD. Serotonin modulates responses to species-specific vocalizations in the inferior colliculus. J Comp Physiol A Neuroethol Sens Neural Behav Physiol. 2005a;191(6):535–546. doi: 10.1007/s00359-005-0623-y. [DOI] [PubMed] [Google Scholar]
- Hurley LM, Pollak GD. Serotonin shifts first spike latencies of inferior colliculus neurons. J Neurosci. 2005b;25(34):7876–7886. doi: 10.1523/JNEUROSCI.1178-05.2005. [DOI] [PMC free article] [PubMed] [Google Scholar]
- Hurley LM, Thompson A. Serotonergic innervation of the auditory brainstem of the Mexican free-tailed bat, Tadarida brasiliensis. J Comp Neurol. 2001;435(1):77–88. doi: 10.1002/cne.1194. [DOI] [PubMed] [Google Scholar]
- Irvine DRF. Physiology of the auditory brainstem. In: Popper AN, Fay RR, editors. The Mammalian Auditory Pathway: Neurophysiology. Vol. 2. Springer-Verlag; New York: 1992. pp. 153–231. [Google Scholar]
- Itzhak Y, Ali S. Role of nitrergic system in behavioral and neurotoxic effects of amphetamine analogs. Pharmacol Ther. 2006;109(1–2):246–262. doi: 10.1016/j.pharmthera.2005.08.004. [DOI] [PubMed] [Google Scholar]
- Jacobs BL, Foote SL, Bloom FE. Differential projections of neurons within the dorsal raphe nucleus of the rat:a horseradish peroxidase (HRP) study. Brain Res. 1978;147:149–153. doi: 10.1016/0006-8993(78)90779-5. [DOI] [PubMed] [Google Scholar]
- Jen P, Xu L. The effect of monaural middle ear destruction on response properties of neurons in the auditory midbrain of juvenile and adult mice. Brain Res. 2006;1091(1):207–16. doi: 10.1016/j.brainres.2006.01.055. [DOI] [PubMed] [Google Scholar]
- Kaiser A, Covey E. 5-HT innervation of the auditory pathway in birds and bats. In: Syka JL, editor. Acoustical signal processing in the central auditory system. Plenum; New York: 1997. pp. 71–78. [Google Scholar]
- Kirifides M, Simpson K, Lin R, Waterhouse B. Topographic organization and neurochemical identity of dorsal raphe neurons that project to the trigeminal somatosensory pathway in the rat. J Comp Neurol. 2001;435(3):325–340. doi: 10.1002/cne.1033. [DOI] [PubMed] [Google Scholar]
- Klepper A, Herbert H. Distribution and origin of noradrenergic and serotonergic fibers in the cochlear nucleus and inferior colliculus of the rat. Brain Res. 1991;557:190–201. doi: 10.1016/0006-8993(91)90134-h. [DOI] [PubMed] [Google Scholar]
- Laferrere B, Wurtman R. Effect of D-fenfluramine on serotonin release in brains of anaesthetized rats. Brain Res. 1989;504(2):258–263. doi: 10.1016/0006-8993(89)91365-6. [DOI] [PubMed] [Google Scholar]
- Liu J, Li X, Wang L, Dong Y, Han H, Liu G. Effects of salicylate on serotoninergic activities in rat inferior colliculus and auditory cortex. Hear Res. 2003;175(1–2):45–53. doi: 10.1016/s0378-5955(02)00708-6. [DOI] [PubMed] [Google Scholar]
- Malmierca M. The structure and physiology of the rat auditory system: an overview. Int Rev Neurobiol. 2003;56:147–211. doi: 10.1016/s0074-7742(03)56005-6. [DOI] [PubMed] [Google Scholar]
- Marsh R, Fuzessery Z, Grose C, Wenstrup J. Projection to the inferior colliculus from the basal nucleus of the amygdala. J Neurosci. 2002;22(23):10449–10460. doi: 10.1523/JNEUROSCI.22-23-10449.2002. [DOI] [PMC free article] [PubMed] [Google Scholar]
- Mooney R, Huang X, Shi M, Bennett-Clarke C, Rhoades R. Serotonin modulates retinotectal and corticotectal convergence in the superior colliculus. Prog Brain Res. 1996;112(57–69):57–69. doi: 10.1016/s0079-6123(08)63320-8. [DOI] [PubMed] [Google Scholar]
- Morales M, Battenberg E, Bloom F. Distribution of neurons expressing immunoreactivity for the 5HT3 receptor subtype in the rat brain and spinal cord. J Comp Neurol. 1998;402(3):385–401. [PubMed] [Google Scholar]
- Nielsen K, Brask D, Knudsen G, Aznar S. Immunodetection of the serotonin transporter protein is a more valid marker for serotonergic fibers than serotonin. Synapse. 2006;59(5):270–276. doi: 10.1002/syn.20240. [DOI] [PubMed] [Google Scholar]
- Oliver D. Projections to the inferior colliculus from the anteroventral cochlear nucleus in the cat: possible substrates for binaural interaction. J Comp Neurol. 1987;264(1):24–46. doi: 10.1002/cne.902640104. [DOI] [PubMed] [Google Scholar]
- Oliver DL, Huerta MF. Inferior and superior colliculi. In: Webster DB, Popper AN, editors. The Mammalian Auditory Pathway: Neuroanatomy. Springer-Verlag; New York: 1992. pp. 168–222. [Google Scholar]
- Peruzzi D, Dut A. GABA, serotonin and serotonin receptors in the rat inferior colliculus. Brain Res. 2004;998(2):247–250. doi: 10.1016/j.brainres.2003.10.059. [DOI] [PubMed] [Google Scholar]
- Pobbe R, Zangrossi HJ. 5-HT(1A) and 5-HT(2A) receptors in the rat dorsal periaqueductal gray mediate the antipanic-like effect induced by the stimulation of serotonergic neurons in the dorsal raphe nucleus. Psychopharmacol (Berl) 2005;183(3):314–321. doi: 10.1007/s00213-005-0196-z. [DOI] [PubMed] [Google Scholar]
- Pollak GD, Burger RM, Klug A. Dissecting the circuitry of the auditory system. Trends Neurosci. 2003;26(1):33–9. doi: 10.1016/s0166-2236(02)00009-7. [DOI] [PubMed] [Google Scholar]
- Rothman R, Ayestas M, Dersch C, Baumann M. Aminorex, fenfluramine, and chlorphentermine are serotonin transporter substrates. Implications for primary pulmonary hypertension. Circulation. 1999;100(8):869–875. doi: 10.1161/01.cir.100.8.869. [DOI] [PubMed] [Google Scholar]
- Rothman R, Clark R, Partilla J, Baumann M. (+)-Fenfluramine and its major metabolite, (+)-norfenfluramine, are potent substrates for norepinephrine transporters. J Pharmacol Exp Ther. 2003;305(3):1191–1199. doi: 10.1124/jpet.103.049684. [DOI] [PubMed] [Google Scholar]
- Rowland N, Carlton J. Neurobiology of an anorectic drug: fenfluramine. Prog Neurobiol. 1986;27(1):13–62. doi: 10.1016/0301-0082(86)90011-0. [DOI] [PubMed] [Google Scholar]
- Sakai K, Crochet S. Role of dorsal raphe neurons in paradoxical sleep generation in the cat: no evidence for a serotonergic mechanism. Eur J Neurosci. 2001;13(1):103–112. [PubMed] [Google Scholar]
- Santana N, Bortolozzi A, Serrats J, Mengod G, Artigas F. Expression of serotonin1A and serotonin2A receptors in pyramidal and GABAergic neurons of the rat prefrontal cortex. Cereb Cortex. 2004;14(10):1100–1109. doi: 10.1093/cercor/bhh070. [DOI] [PubMed] [Google Scholar]
- Schreiner CE, Langner G. Laminar fine structure of frequency organization in auditory midbrain. Nature. 1997;388(6640):383–6. doi: 10.1038/41106. [DOI] [PubMed] [Google Scholar]
- Schuller G, Radtke-Schuller S, Betz M. A stereotaxic method for small animals using experimentally determined reference profiles. J Neurosci Meth. 1986;18(4):339–350. doi: 10.1016/0165-0270(86)90022-1. [DOI] [PubMed] [Google Scholar]
- Schwartz D, Hernandez L, Hoebel B. Fenfluramine administered systemically or locally increases extracellular serotonin in the lateral hypothalamus as measured by microdialysis. Brain Res. 1989;482(2):261–270. doi: 10.1016/0006-8993(89)91189-x. [DOI] [PubMed] [Google Scholar]
- Sheibani V, Farazifard R. Dorsal raphe nucleus stimulation modulates the response of layers IV and V barrel cortical neurons in rat. Brain Res Bull. 2006;68(6):430–435. doi: 10.1016/j.brainresbull.2005.09.017. [DOI] [PubMed] [Google Scholar]
- Tao R, Fray A, Aspley S, Brammer R, Heal D, Auerbach S. Effects on serotonin in rat hypothalamus of D-fenfluramine, aminorex, phentermine and fluoxetine. Eur J Pharmacol. 2002;445(1–2):69–81. doi: 10.1016/s0014-2999(02)01751-x. [DOI] [PubMed] [Google Scholar]
- Thompson GC, Thompson AM, Garrett KM, Britton BH. Serotonin and serotonin receptors in the central auditory system. Otolaryngol- Head Neck Surg. 1994;110:93–102. doi: 10.1177/019459989411000111. [DOI] [PubMed] [Google Scholar]
- To Z, Bonhaus D, Eglen R, Jakeman L. Characterization and distribution of putative 5-ht7 receptors in guinea-pig brain. Br J Pharmacol. 1995;115(1):107–116. doi: 10.1111/j.1476-5381.1995.tb16327.x. [DOI] [PMC free article] [PubMed] [Google Scholar]
- van der Stelt HM, Breuer ME, Olivier B, Westenberg HG. Permanent deficits in serotonergic functioning of olfactory bulbectomized rats: An in vivo microdialysis study. Biol Psychiat. 2005;57(9):1061–1067. doi: 10.1016/j.biopsych.2004.12.040. [DOI] [PubMed] [Google Scholar]
- Vater M, Feng AS. Functional organization of ascending and descending connections of the cochlear nucleus of horseshoe bats. J Comp Neurol. 1990;292(3):373–95. doi: 10.1002/cne.902920305. [DOI] [PubMed] [Google Scholar]
- Vilaró M, Cortes R, Mengod G. Serotonin 5-HT4 receptors and their mRNAs in rat and guinea pig brain: distribution and effects of neurotoxic lesions. J Comp Neurol. 2005;484(4):418–439. doi: 10.1002/cne.20447. [DOI] [PubMed] [Google Scholar]
- Waterhouse B, Azizi S, Burne R, Woodward D. Modulation of rat cortical area 17 neuronal responses to moving visual stimuli during norepinephrine and serotonin microiontophoresis. Brain Res. 1990;514(2):276–292. doi: 10.1016/0006-8993(90)91422-d. [DOI] [PubMed] [Google Scholar]
- Waterhouse B, Moises H, Woodward D. Interaction of serotonin with somatosensory cortical neuronal responses to afferent synaptic inputs and putative neurotransmitters. Brain Res Bull. 1986;17(4):507–518. doi: 10.1016/0361-9230(86)90218-2. [DOI] [PubMed] [Google Scholar]
- Wenstrup J, Ross L, Pollak G. A functional organization of binaural responses in the inferior colliculus. Hear Res. 1985;17(2):191–195. doi: 10.1016/0378-5955(85)90021-8. [DOI] [PubMed] [Google Scholar]
- Wenstrup J, Ross L, Pollak G. Binaural response organization within a frequency-band representation of the inferior colliculus: implications for sound localization. J Neurosci. 1986;6(4):962–973. doi: 10.1523/JNEUROSCI.06-04-00962.1986. [DOI] [PMC free article] [PubMed] [Google Scholar]
- Yuan Q, Harley C, McLean J. Mitral cell beta1 and 5-HT2A receptor colocalization and cAMP coregulation: a new model of norepinephrine-induced learning in the olfactory bulb. Learn Mem. 2003;10(1):5–15. doi: 10.1101/lm.54803. [DOI] [PMC free article] [PubMed] [Google Scholar]
- Zook JM, Casseday JH. Projections from the cochlear nuclei in the mustache bat, Pteronotus parnellii. J Comp Neurol. 1985;237(3):307–24. doi: 10.1002/cne.902370303. [DOI] [PubMed] [Google Scholar]
- Zwiers M, Versnel H, Van Opstal A. Involvement of monkey inferior colliculus in spatial hearing. J Neurosci. 2004;24(17):4145–4156. doi: 10.1523/JNEUROSCI.0199-04.2004. [DOI] [PMC free article] [PubMed] [Google Scholar]