Abstract
Genetic maps are built using the genotypes of many related individuals. Genotyping errors in these data sets can distort genetic maps, especially by inflating the distances. We have extended the traditional likelihood model used for genetic mapping to include the possibility of genotyping errors. Each individual marker is assigned an error rate, which is inferred from the data, just as the genetic distances are. We have developed a software package, called TMAP, which uses this model to find maximum-likelihood maps for phase-known pedigrees. We have tested our methods using a data set in Vitis and on simulated data and confirmed that our method dramatically reduces the inflationary effect caused by increasing the number of markers and leads to more accurate orders.
GENETIC mapping uses the genotypes of many related individuals at selected markers to determine the relative locations of these markers. The genotype data allow us to infer where recombinations have occurred, which is directly related to the genetic distance. The purpose of a genetic mapping algorithm is to reconstruct as accurately as possible the order of the markers on the chromosomes and the genetic distances between them.
Genetic mapping algorithms fall into two categories: those that use multipoint-likelihood maximization and those that rely only on two-point statistics. MapMaker (Lander et al. 1987), CRI-MAP (Green et al. 1990), CarthaGène (de Givry et al. 2005), and R/qtl (Broman et al. 2003) fall into the former category, while GMendel (Echt et al. 1992), JoinMap (Stam 1993), and RECORD (van Os et al. 2005b) fall into the latter. Multipoint-likelihood maximization has theoretical advantages, but is slower than two-point methods.
We use multipoint-likelihood maximization, because it is more robust in the presence of missing data. Two-point statistics derive no information when an individual's genotype is missing for one of the markers. However, multipoint analysis uses nearby markers to approximate the missing genotypes, appropriately discounted because of possible recombinations. For the same reason, multipoint analysis is more powerful with markers that are not fully informative. In backcross and intercross pedigrees, this advantage is less apparent, but in outbred pedigrees, the markers will generally have many different segregation types, and two-point analysis between these will not incorporate all the information.
Without accounting for genotyping errors, each error in a nonterminal marker causes two apparent recombinations in the data set. Thus, every 1% error rate in a marker adds ∼2 cM of inflated distance to the map. If there is an average of one marker every 2 cM, then an average of a 1% error rate will double the size of the map. Markers with very high error rates will have large distances to the adjacent markers. These cases can be detected, either manually or automatically, and the markers removed. However, markers with low error levels will not be detected and, furthermore, may represent too large a portion of the data set to eliminate completely.
Apparent double recombinations may also be due to biological phenomena such as gene conversion or mutation and not laboratory errors. Nevertheless, as with laboratory genotyping errors, these phenomena are not indicative of recombination and treating them as recombinations inflates the map distances (Castiglione et al. 1998). For the purpose of this article, we use the term error to refer to any process that causes changes to single genotypes at a time, as opposed to recombination, which also affects all subsequent genotypes.
Previous work has presented methods for detecting errors in genotype data once the marker order has been decided (Lincoln and Lander 1992; Douglas et al. 2000; van Os et al. 2005a). The suspect genotypes can be checked and corrected if necessary. However, this verification procedure can be time consuming and not necessarily fully effective because some combinations of markers and individuals may consistently produce the same erroneous genotypes. Alternatively, the verification step may be skipped and the markers recoded solely on the basis of the error detection algorithm. This method may itself introduce errors, unless the parameters are chosen very conservatively, in which case it may miss errors. Finally, since the map itself has been built using the error-containing data set, those errors may be less apparent with that map.
In contrast, our approach integrates error detection and compensation into the map-building procedure. Furthermore, we use a likelihood model that does not force a dichotomy between correcting or not correcting particular genotypes. Instead, we have a probability distribution over the possible genotypes, which depends on both the observed genotype and the estimated probability of error. Thus, even genotypes that are only possibly erroneous can be correctly utilized in constructing the map.
Previous work modeling errors within the map-ordering process has not incorporated both independent error probabilities for the markers and estimation of the parameters from the data. MapMaker 3.0 includes an optional genotyping error rate for the entire linkage group but has no provisions for estimating this parameter from the data (Lincoln and Lander 1992). R/qtl is a software package that primarily performs QTL analysis, but includes a model for building maps with a fixed, uniform error rate, similar to MapMaker (Broman et al. 2003). Thallman et al. (2001) presented a model with independent error rates for each marker, but without provisions for estimating these from the data. On the other hand, Rosa et al. (2002) presented a method that estimates a global error rate from the data while ordering, but they use Gibbs sampling and not the EM algorithm, and thus their approach requires many more iterations to converge to a solution.
In the context of linkage analysis, the notion of complex-valued recombination fractions has been introduced (Göring and Terwilliger 2000; see also Abkevich et al. 2001). The purpose was to account for errors in the phenotype models. Our approach is similar, except that our errors are in the genotypes, not in the model, and we account for errors at every locus, not just at the disease locus.
We have developed a software package that uses the error-compensating likelihood model to find the maximum-likelihood map under that model. We have named the package TMAP after the tlod statistic of Abkevich et al. (2001). Although this method could apply to any pedigree type, TMAP works only with pedigrees where all parents are completely genotyped and phase known. This includes backcross, intercross, and phase-known outbred pedigrees. For phase-unknown outbred pedigrees, it is possible to determine the phases with sufficiently many offspring, as was done with the Vitis data used in this article (D. A. Cartwright, unpublished results). TMAP is freely available from http://math.berkeley.edu/∼dustin/tmap/.
METHODS
Likelihood model:
In our likelihood model, each marker has both an observed genotype, which is specified in a data file, and a true genotype, which is not observed directly and can only be inferred. The relationship between the two genotypes is parameterized by an error rate e. In each haplotype, the true and observed genotypes coincide with probability 1 − e. Thus, the overall genotypes coincide with probability (1 − e)2 and differ only in the maternal haplotype with probability (1 − e)e, only in the paternal haplotype also with probability (1 − e)e, and in both haplotypes with probability e2. This error model is completely analogous to the probability distribution of recombinations between a pair of markers. Of course, the true genotype cannot be known a priori, and in many cases the observed genotypes are not fully known either. Thus when computing the likelihood, we sum over the likelihoods of all possible values for these genotypes.
Explicitly, the equation is as follows. Let n and m denote the number of individuals and markers, respectively. Let θi denote the recombination rate between markers i and i + 1, and let ɛi denote the error rate for marker i. Then, the likelihood is a function of these two sets of parameters,
 |
(1) |
where 𝒢 is the set of all possible genotypes,  is the set of all genotypes that are consistent with the observations, each element g consists of the true genotypes gi, each element
  consists of the observed genotypes
  , r(g1, g2) is the number of recombinations between genotypes g1 and g2, and
 |
is the likelihood of having exactly r recombinations between two markers separated by a recombination fraction θ (or equivalently, exactly r errors in a marker with error rate θ).
We can represent this model visually as shown in Figure 1. Each node represents an abstract marker, i.e., genotypes for all individuals in the pedigree. The leaf nodes are the known, observed, possibly erroneous markers, and the internal nodes are the inferred, unobserved, error-free markers. Thus, except for the terminal markers, each physical marker corresponds to two nodes, one error free and one observed. Each arc represents separation between two markers, either because of recombination (vertical) or because of errors (horizontal).
Figure 1.—
Graphical representation of the error model. Each node represents an abstract marker, i.e., genotypes for all individuals in the pedigree. The leaf nodes are the known, observed, possibly erroneous markers, and the internal nodes are the inferred, unobserved, error-free markers. Thus, except for the terminal markers, each physical marker corresponds to two nodes, one error free and one observed. Each arc represents separation between two markers, either because of recombination (vertical) or because of errors (horizontal).
As shown in the graph (Figure 1), there is no point in computing an error rate for the markers at either end. For these markers, errors and recombinations are indistinguishable in the model, so we conservatively assume that all the apparent recombinations are true recombinations and not errors.
Thus, the error rates effectively add m − 2 parameters to each linkage group of m markers. The maximum-likelihood values of these additional parameters can be estimated along with the genetic distances using the EM algorithm (Lander and Green 1987). In the notation of Equation 1, we can use approximate values of θi and ɛi to compute the joint probability distribution over 𝒢 and  (E step), which can then be used to compute better approximations of θi and ɛi (M step). Iterating these two steps typically converges to the maximum-likelihood solution.
Finally, the recombination rates are translated into map distances using the Kosambi map function. The Kosambi map function models recombination interference, even though the model assumes that each of the θi is independent of the others, meaning that recombination events separated by markers have independent probabilities.
Since errors are defined in a way that is mathematically equivalent to recombinations, the position at one end of the map is equivalent to the neighboring position in this model. Any pair of maps that differs only by switching these two markers will have the same likelihood. Therefore, any likelihood maximization of the order will leave each of these two pairs in an arbitrary order. These symmetries are analogous to the equivalence of any given order and the reverse order, except that reversing a map is a physical as well as a mathematical symmetry, but reversing the final two markers is not a physical symmetry. For the final map, we can pick the order that minimizes the error, again assuming that recombinations are more likely than errors, all else being equal. However, while building the map, it is useful to explicitly acknowledge these symmetries.
Marker order:
We begin building our maps by trying all possible orders of s seed markers. Because of the additional symmetries, there are only s!/8 unique orders. Then, we provisionally insert the next marker in all possible positions, keeping the t highest likelihoods. Each additional marker is added in the same way. On the basis of our experiments, we have chosen s = 6 and t = 3 to provide a good balance between speed and accuracy.
When inserting a new marker near either end of the map, the symmetries described above complicate the possibilities. When adding a marker C to a map that begins AB …, there would seem to be three places to add it: ABC …, ACB …, CAB … . However, the last two are equivalent orders. Furthermore, the order of A and B was arbitrary, so the orders BAC …, BCA …, and CBA … are just as plausible. In fact, these six orders consist of three pairs of equivalent orders, where each equivalent pair is defined by the marker in the third position. Thus we try each of the three equivalent pairs of orders only once.
After building an initial order, we use a simple Monte Carlo algorithm to find the maximum-likelihood order. At each iteration, a random permutation from the neighborhood is applied to the marker order, and the log likelihood is computed. If the new log likelihood is less than the old one, the new order is accepted. If the new is greater then the old, it is nonetheless accepted with probability e−δL/T, where δL is the difference in log10 likelihood, and T, known as the temperature, is a parameter of the algorithm. This is similar to simulated annealing but with a fixed temperature (Kirkpatrick et al. 1983). We use two phases of Monte Carlo optimization, first with T = 0.5 and then with T = 0.05.
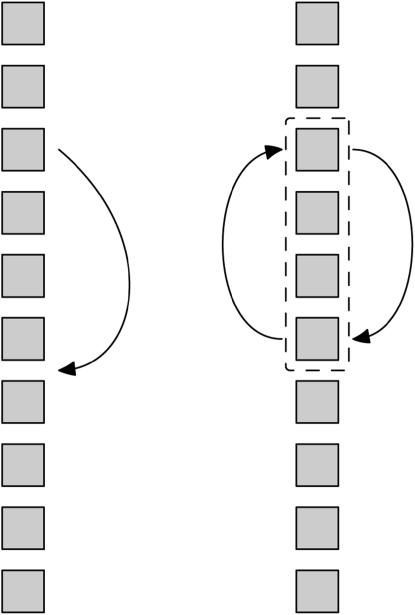
We define our neighborhood to have two different kinds of permutations, which we call flips and moves. A flip consists of taking a stretch of the map consisting of two or more markers and reversing its orientation in place, which is equivalent to a 2-change from the theory of the traveling salesman problem (Schiex and Gaspin 1997). A move consists of removing a marker from one location and inserting it in another. These are illustrated in Figure 2. Rather than consider each permutation equally, we bias the neighborhood toward the more local, smaller-scale alterations, which are more likely to have similar likelihoods. Within each family of permutations, each permutation has probability  , where
  represents the size of the subsection in a flip and the length of the move, and Cr is a constant to make the total probability 1. We use a value of r = 0.9 for both sets of permutations.
Figure 2.—
Illustration of the two types of permutations used in the marker-ordering algorithm: moves (left) and flips (right). Each square represents a single marker.
Implementation:
The core algorithms in TMAP are implemented in C. There is a command-line interface for Unix and a Java graphical interface that has been tested on Solaris, Linux, Windows, and Mac OS X.
Validation:
We tested TMAP using data from 94 progeny of a cross in Vitis vinifera, which were genotyped at 1006 markers (Troggio et al. 2007, accompanying article in this issue), as well as simulated data sets. Two facets of the program were assessed: first, the likelihood model for compensating for genotyping errors; second, the Monte Carlo search algorithm for finding optimal solutions.
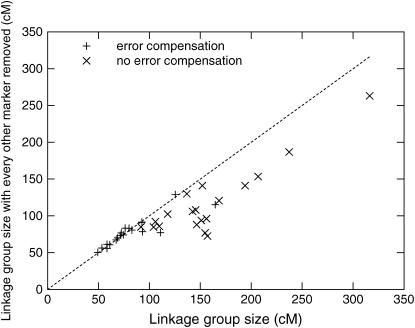
To test the ability of the error model to counteract the inflationary effect of genotyping errors, we performed the simple experiment of removing every other marker in each linkage group and measuring the change in the linkage group's size. In the presence of uncompensated errors, removing markers will cause the distances to shrink because there will be fewer apparent double recombinations, but not if the errors are properly compensated. First, we used the Monte Carlo algorithm to determine the maximum-likelihood order of each group. Then, we computed the size of each group and the size of each group after removing every other marker. We modified TMAP to not take errors into account and repeated the last step.
In some cases, we observed that error compensation also improved the ordering. Both with and without compensation, markers with many errors tend to be placed at the ends of the linkage groups, because they do not fit well anywhere in the middle. However, with error compensation, this effect is less pronounced.
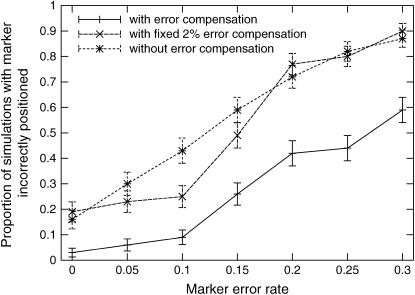
To verify this phenomenon, we simulated a backcross pedigree consisting of 19 markers and 94 individuals with a distance of 5 cM between adjacent markers and 5% of the genotypes missing. We added a varying amount of simulated errors to the 10th marker. Then, we ordered the markers using both TMAP, the modified version that did not compensate for errors, and a version that assumed a fixed error rate of 2%, similar to MapMaker and R/qtl (Lincoln and Lander 1992; Broman et al. 2003).
To validate the parameters in the Monte Carlo iterative improvement algorithm we experimented with many variant parameters. First, we used a long run of the improving algorithm to determine the maximum likelihood, or at least a close approximation of it, for each linkage group of the grapevine data. Then, for a variety of parameters, the Monte Carlo improvement algorithm was applied to each linkage group until the log10 likelihood was within 0.1 of the optimum or until a maximum number of iterations was reached. This operation was repeated 10 times for each set of parameters, and we recorded the average number of iterations required.
RESULTS
Error model:
The results of removing every other marker from linkage groups in the Vitis data set are shown in Figure 3. Without error compensation, the linkage groups always decreased in size when markers were removed, and, furthermore, there is not a lot of correlation between the sizes, but with error compensation the sizes typically remained very consistent.
Figure 3.—
Effect on linkage group size of removing every other marker both with and without compensation for errors. Error compensation leads to more consistent genetic distances.
Figure 4 shows the proportion of incorrect placements of a marker with a varying error rate. The results show that the error compensation method helps correctly position markers with significant error rates. Furthermore, the plot underestimates the relative accuracy of error compensation, because, with error compensation, many of the incorrect placements were only one or two positions away from the correct position, but without error compensation most of the incorrect placements were at the ends of the group.
Figure 4.—
Simulation of the effect of errors on marker ordering. In a linkage group of 19 markers, the 10th marker was simulated with errors, and the markers were ordered, using three different likelihood models. The first uses TMAP with the error model described in this article. The second uses a version of TMAP that assumes a fixed error rate of 2% for every marker. The third does not model any error at all.
Monte Carlo parameters:
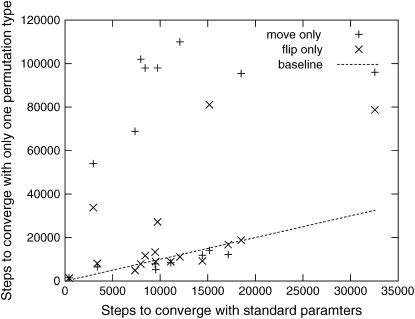
Figure 5 shows the effect of removing one class of permutations on the time to converge to an optimal solution. Each point represents a single linkage group. On the x-axis is the average number of steps needed to converge using the standard parameter set, and on the y-axis is the average number of steps needed to converge for a variant that had one of the two permutation types (flips or moves) disabled. On some linkage groups, the optimization performed poorly with only one of the permutation types, justifying the inclusion of both. Note that in some of these cases the maximum number of iterations was reached before convergence, so this plot underestimates the difference between the parameter choices.
Figure 5.—
Effect of removing one of the two permutation types on the speed of convergence to the correct order.
Similarly, we experimented with varying the parameter r for one or both permutation types and the temperature of T, to arrive at our choices for these parameters, although the differences are less dramatic. In particular, convergence was slower with r = 1, justifying the nonuniform distribution of permutations.
Error rate distribution:
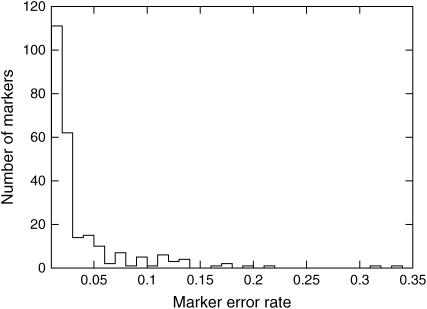
The distribution of the nonzero error rates in the Vitis data set is shown in Figure 6. Among the markers with nonzero errors, most have an error rate of <5%. Without error compensation, the cumulative effect of these markers would be to inflate the map distances, but to remove all of them would significantly reduce the usefulness of the map. Furthermore, an additional 67% of the markers had an estimated error rate of exactly 0%. In these cases, the error-compensating likelihood model reduces to the traditional one, and there is no loss of information. Finally, the distribution clearly shows that the error rate is not the same for all markers, which has been the assumption in all previous models of genotyping errors.
Figure 6.—
Distribution of nonzero error rates in the Vitis data set. In addition, 625 markers (67%) had an estimated error rate of exactly 0%.
There are a handful of markers with error rates in the range 15–35%. Their presence did not significantly affect the other markers in their linkage groups, so we did not remove them from the map. These markers with high error rates are analogous to phenotypes with incomplete penetrance. The error rate reduces the informativeness of the markers, but it is still possible to localize them to a specific area of the linkage group.
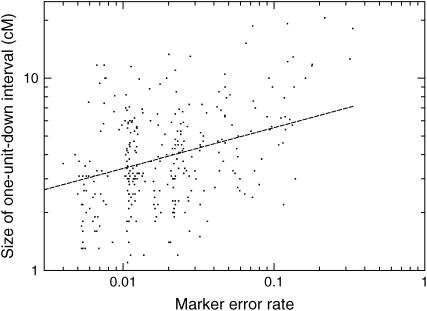
We extended the analogy between markers with high error rates and phenotypes in linkage analysis to estimate the accuracy of the positions of these markers. In linkage analysis, the range of positions with log10 likelihood 1 unit less than the maximum log10 likelihood measures the uncertainty in a marker's position. For each marker, a similar analysis was performed by holding the rest of the linkage group fixed and computing the log likelihood with the marker positioned every 0.1 cM along the length of the linkage group. The error rate and the size of the 1-unit-down interval for each marker are plotted in Figure 7. In general, markers with higher error rates are localized less precisely in the linkage group. However, even for the markers with the largest error rates, the 1-unit-down interval was never >21 cM.
Figure 7.—
Comparison of the estimated marker error rates and the size of the 1-unit-down intervals. The 1-unit-down intervals are computed by placing the marker at regular steps along the length of the linkage group and computing the interval where the log10 likelihood is 1 unit less than the maximum. These approximate the 90% confidence intervals for the marker's position.
DISCUSSION
We have defined our error model to be the same as the recombination model. This means that we treat the correct genotyping of the haplotype from the mother and of the haplotype from the father as independent events. An alternative error model would be to treat each individual's genotype as a whole as either correct or incorrect. However, a different error model would remove the symmetry between the recombination fraction of a terminal marker and the error of the adjacent marker for many, but not all, segregation types. Thus, the relative position of these two markers would be decided by the likelihoods and not by the error-minimizing rule above. Furthermore, the processes that cause genotyping errors are more likely to produce errors in only one haplotype than in both. For example, it is more likely to misread an AA genotype as AB than as BB.
More complex classes of genotyping errors are not detected by this model. For example, in one linkage group of the Vitis data, there was a pair of markers that each had the same set of errors in their genotype data. Because the genotypes from each marker seemed to confirm the genotypes from the other, the method did not detect the errors. However, there were large gaps on either side of the pair, and removing either one caused the gaps to disappear and be absorbed in the error rate of the remaining marker. This linkage group gave rise to one of the outliers in Figure 3.
CarthaGène and GMendel have both previously applied Monte Carlo techniques to the marker ordering problem. CarthaGène uses a neighborhood consisting of flips and a permutation based on a 3-change that moves whole blocks of markers at a time, but does not bias either permutation toward smaller changes. GMendel only swaps pairs of markers and does include a bias toward nearby markers that is active only during the later phases of the improvement. However, as our results show, both a richer neighborhood and a bias toward small-scale permutations improve convergence.
We have used only two temperatures in our Monte Carlo improving algorithm, rather than the more common steady decrease in temperature used in simulated annealing. Simulated annealing starts with a high initial temperature that effectively randomizes the marker order. Thus, it is not possible to take advantage of the result of the incremental ordering algorithm as a starting point. However, we found that the incremental algorithm can often quickly find good approximate solutions, so we chose a Monte Carlo algorithm that could take advantage of this.
We have shown that genotyping errors can be accommodated by a simple extension to the mapping-likelihood model, which gives a more accurate marker order and especially distances.
Acknowledgments
This work was supported by the “Grapevine Physical Mapping” and “A.M.I.CA. Vitis” projects funded by the Provincia Autonoma di Trento.
References
- Abkevich, V., N. J. Camp, A. Gutin, J. Farnham, L. Cannon-Albright et al., 2001. A robust multipoint linkage statistic (tlod) for mapping complex trait loci. Genet. Epidemiol. 21(Suppl. 1): S492–S497. [DOI] [PubMed] [Google Scholar]
- Broman, K. W., H. Wu, S. Sen and G. A. Churchill, 2003. R/qtl: QTL mapping in experimental crosses. Bioinformatics 19: 889–890. [DOI] [PubMed] [Google Scholar]
- Castiglione, P., C. Pozzi, M. Heun, V. Terzi, K. J. Müller et al., 1998. An AFLP-based procedure for the efficient mapping of mutations and DNA probes in barley. Genetics 149: 2039–2056. [DOI] [PMC free article] [PubMed] [Google Scholar]
- de Givry, S., M. Bouchez, P. Chabrier, D. Milan and T. Schiex, 2005. CarthaGène: multipopulation integrated genetic and radiation hybrid mapping. Bioinformatics 21: 1703–1704. [DOI] [PubMed] [Google Scholar]
- Douglas, J. A., M. Boehnke and K. Lange, 2000. A multipoint method for detecting genotyping errors and mutations in sibling-pair linkage data. Am. J. Hum. Genet. 66: 1287–1297. [DOI] [PMC free article] [PubMed] [Google Scholar]
- Echt, C., S. Knapp and B.-H. Liu, 1992. Genome mapping with non-inbred crosses using GMendel 2.0. Maize Genet. Coop. Newsl. 66: 27–29. [Google Scholar]
- Göring, H. H., and J. D. Terwilliger, 2000. Linkage analysis in the presence of errors I: complex-valued recombination fractions and complex phenotypes. Am. J. Hum. Genet. 66: 1095–1106. [DOI] [PMC free article] [PubMed] [Google Scholar]
- Green, P., K. Falls and S. Crooks, 1990. CRI-MAP Documentation, Version 2.4. Washington University School of Medicine, St. Louis.
- Kirkpatrick, S., C. D. Gelatt Jr. and M. P. Vecchi, 1983. Optimization by simulated annealing. Science 220: 671–680. [DOI] [PubMed] [Google Scholar]
- Lander, E. S., and P. Green, 1987. Construction of multilocus genetic linkage maps in humans. Proc. Natl. Acad. Sci. USA 84: 2363–2367. [DOI] [PMC free article] [PubMed] [Google Scholar]
- Lander, E. S., P. Green, J. Abrahamson, A. Barlow, M. J. Daly et al., 1987. MAPMAKER: an interactive computer package for constructing primary genetic linkage maps of experimental and natural populations. Genomics 1: 174–181. [DOI] [PubMed] [Google Scholar]
- Lincoln, S. E., and E. S. Lander, 1992. Systematic detection of errors in genetic linkage data. Genomics 14: 604–610. [DOI] [PubMed] [Google Scholar]
- Rosa, G. J. M., B. S. Yandell and D. Gianola, 2002. A Bayesian approach for constructing genetic maps when markers are miscoded. Genet. Sel. Evol. 34: 353–369. [DOI] [PMC free article] [PubMed] [Google Scholar]
- Schiex, T., and C. Gaspin, 1997. CarthaGène: constructing and joining maximum likelihood genetic maps. Proceedings of Intelligent Systems of Molecular Biology '97, June 1997, Halkidiki, Greece. [PubMed]
- Stam, P., 1993. Construction of integrated genetic linkage maps by means of a new computer package: JoinMap. Plant J. 3: 739–744. [Google Scholar]
- Thallman, R. M., G. L. Bennet, J. W. Keele and S. M. Kappes, 2001. Efficient computation of genotype probabilities for loci with many alleles: II. Iterative method for large, complex pedigrees. J. Anim. Sci. 79: 34–44. [DOI] [PubMed] [Google Scholar]
- Troggio, M., G. Malacarne, G. Coppola, C. Segala, D. A. Cartwright et al., 2007. A dense single-nucleotide polymorphism-based genetic linkage map of grapevine (Vitis vinifera L.) anchoring Pinot noir bacterial artificial chromosome contigs. Genetics 176: 2637–2650. [DOI] [PMC free article] [PubMed] [Google Scholar]
- van Os, H., P. Stam, R. G. F. Visser and H. J. van Eck, 2005. a RECORD: a novel method for ordering loci on a genetic linkage map. Theor. Appl. Genet. 112: 30–40. [DOI] [PubMed] [Google Scholar]
- van Os, H., P. Stam, R. G. F. Visser and H. J. van Eck, 2005. b SMOOTH: a statistical method for successful removal of genotyping errors from high-density genetic linkage data. Theor. Appl. Genet. 112: 187–194. [DOI] [PubMed] [Google Scholar]


