

Abstract
Although an inverse association between triglyceride (TG) and (HDL-C) is well documented, the impact of lowering TG on HDL-C levels has not been well established. Therefore, data were analyzed in 151 consecutive dyslipidemic patients who made multiple visits (n=1,830) to the University of Maryland Preventive Cardiology Center between 1991 and 2005. At baseline, fasting TG levels at or above the median (178 mg/dL) were associated with significantly lower HDL-C than TG levels below the median (32.6 ± 11.1 mg/dL versus 45.1 ± 14.2 mg/dL; P < 0.0001). Following baseline evaluation, various therapies were employed (i.e., dietary, exercise, medication) to reduce mean LDL (147.3 ± 53.4 mg/dL) and TG (306.1 ± 414.9 mg/dL). Using a fully adjusted mixed regression model, each 50 mg/dL reduction in TG was independently associated with a 0.5 mg/dL increase in HDL-C in hypertriglyceridemic subjects (e.g., TG ≥ 200 mg/dL) and a 1.7 mg/dL increase in HDL-C in the absence of elevated TG (p < 0.0001). The use of niacin (p < 0.0001), statins (p=0.0003) and fibrates (p=0.03) were also associated with significant increases in HDL-C beyond that anticipated with TG reduction. These data indicate that lowering TG is independently and inversely correlated with HDL-C, effects that are most pronounced in the absence of hypertriglyceridemia.
Keywords: Triglycerides, HDL-C, preventive cardiology
Introduction
Low levels of HDL-C are an independent risk factor for coronary heart disease (CHD) (1) and elevated levels of triglycerides (TG) contribute to enhanced CHD event rates in these patients (2). Although the inverse relationship between HDL-C and TG has been well documented in hypertriglyceridemic states (3), considerably less information is available at the lower end of the TG spectrum. If lowering normal fasting TG (i.e., < 150 mg/dL) (4) influences HDL-C levels, then this may have potential clinical implications. Therefore, the aim of our study was to determine the impact of lowering TG on HDL-C over time and whether this effect is independent of other TG lowering therapies.
Methods
Study Population
We reviewed medical records of 151 consecutive dyslipidemic outpatients who had 1,834 clinic visits to the University of Maryland outpatient preventive cardiology center between 1991 and 2005. At baseline, patients completed a comprehensive questionnaire assessing CHD risk factors, dietary habits, aerobic activity and the use of pharmacologic therapies. During each visit, blood pressure, weight and waist circumference were recorded and laboratory measurements, including fasting lipids, lipoproteins, and selected chemistries were obtained. Plasma concentrations of total cholesterol (TC) and triglyceride (TG) were measured enzymatically with a Hitachi 704 clinical chemistry analyzer (Boehringer Mannheim, Indianapolis, In). HDL-C was measured following precipitation of apolipoprotein B-containing lipoproteins as previously described (5). LDL-C was calculated using the Friedewald formula (6).
For each follow-up visit, adherence to lifestyle and pharmacologic therapies was also assessed. They included a National Cholesterol Education Program (NCEP Step 1 diet) (4), alcohol use (1 ounce daily), exercise (30 minutes or more of aerobic activity at least twice weekly) and smoking (active versus past or non-smoker). All information was entered into an Excel spreadsheet and patient identity was coded in accordance with Health Insurance Portability and Accountability Act (HIPPA) regulations.
Statistical Analysis
Results are presented as mean +/− SD for continuous variables. Student's t-test (two-tailed) was used to compare the mean differences in demographic, anthropometric and biochemical parameters. A mixed model regression was developed to incorporate all available data with change from baseline in HDL-C as dependent variable, change from baseline in TG as primary study variable, and BMI, diet, exercise, alcohol, smoker, niacin, statins, fibrates, age, and sex as covariates; patient was included as a random effect, with random intercept and slope. Calculated LDL-C levels were not included in the analysis (see below). Similar models were also developed that included an interaction of baseline TG < 200 mg/dL versus ≥ 200 mg/dL with TG change. Regression coefficients were interpreted as the change in HDL-C associated with a 50 mg/dL decline in TG, and 95% confidence intervals were calculated. SAS statistical software version 9.1 (SAS Institute, Cary, North Carolina) was used and levels of significance were defined as P < 0.05.
Results
Baseline characteristics and prevalence of CHD risk factors are shown in Tables 1 and 2. During the initial visit, a self-reported NCEP Step 1 diet was identified in 45% and aerobic activity was reported by 26%. At baseline, fasting TG levels at or above the median (178 mg/dL) were associated with significantly lower HDL-C than TG levels below the median (32.6 ± 11.1 mg/dL versus 45.1 ± 14.2 mg/dL; P < 0.0001). Over time, a variety of therapeutic strategies were employed that included use of statins (78%), fibrates (32%) and niacin (19%) contributing to significant reductions in TC (21%; P < 0.0001), LDL-C (28%; P < 0.0001), TG (44%; P =0003), and increases in HDL-C levels (11%; P=0.003) by the last visit. Figure 1 illustrates the changes in TG and HDL-C over time; 50% of the study cohort had 5 years of follow-up data and 25% had 10 years of follow-up. Non-significant increases in on-treatment dietary adherence (50%) or aerobic activity (29%) were likely explanations for the lack of change in BMI (mean=29.1 kg/m2) compared to baseline.
Table 1.
Baseline Characteristics of the study cohort (n=151).
| Characteristic | Mean (+ sd) |
|---|---|
| Age (yrs) | 51.4 (11.6) |
| SBP (mm Hg) | 132.1 (20.7) |
| DBP (mm Hg) | 80.8 (12.3) |
| Waist (in) | 35.6 (4.1) |
| BMI (kg/m2) | 28.5 (5.3) |
| TC (mg/dL) | 228.6 (57.6) |
| TG (mg/dL) | 306.1 (415), median=178 mg/dL |
| HDL-C (mg/dL) | 38.8 (14.2) |
| LDL-C (mg/dL) | 147.3 (53.4) |
| Glucose (mg/dL) | 108.3 (44.3) |
Table 2.
Prevalence of CHD risk factors and therapies of the study cohort at baseline
| CHD Risk Factor | Prevalence |
|---|---|
| Male | 66% |
| Caucasian | 70% |
| Hypertension | 42% |
| Smoker (active) | 15% |
| Diabetes mellitus | 16% |
| Metabolic Syndrome | 33% |
| Coronary Disease | 36% |
| Cerebrovascular disease | 5% |
| Peripheral Arterial Disease | 5% |
| Treatment (baseline) | |
| Statins | 36% |
| Fibrates | 17% |
| Niacin | 4% |
| Bile Acid Resins | 3% |
| Fish Oils | 2% |
Figure 1.
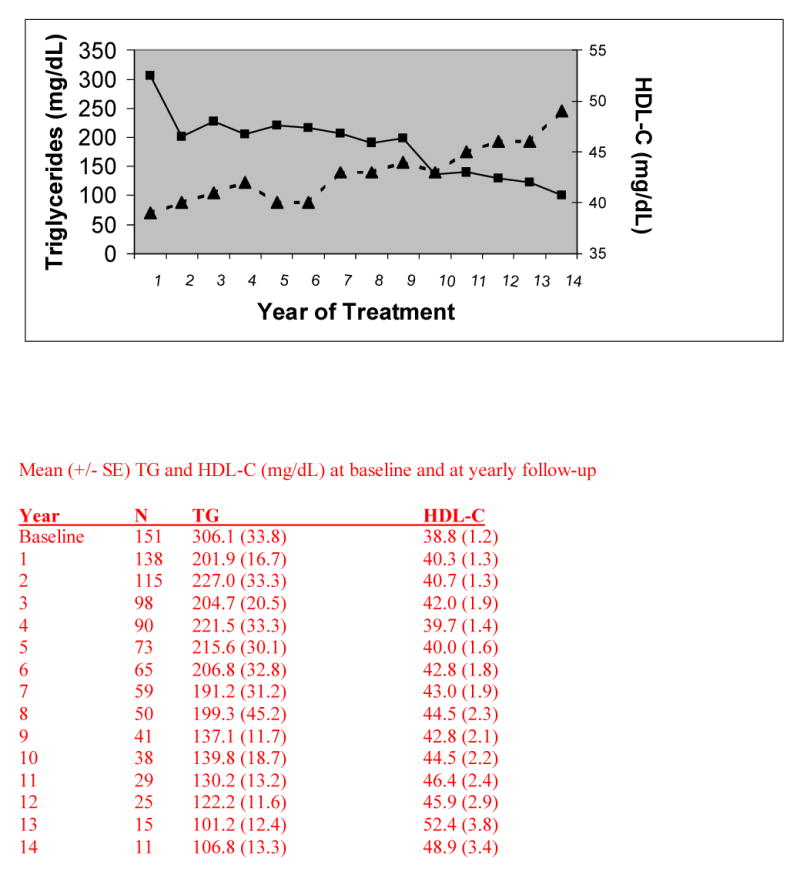
Mean TG (-■-) and HDL-C (-▲-) levels with up to 14 years of follow-up in University clinic outpatients (n=151) with dyslipidemia
To further address the relationship between the change in TG and HDL-C from baseline, we used a mixed regression model that adjusts for within subject correlation, treating subjects as random effects. The following variables were included in the model: age, sex, BMI, change in TG (continuous); alcohol, diet, exercise, use of fibrates, niacin and statins and smoking history (active versus former or never). Using the fully adjusted mixed-regression model including the baseline TG < or ≥ 200mg/dL interaction with TG change (p<0.0001), we found that for non-hypertriglyceridemic subjects (Table 3) a 50 mg/dL decline in TG was associated with a 1.7 mg/dL increase in HDL-C, after adjustment for multiple covariates (P < 0.0001). For subjects with baseline TG ≥ 200, a 50 mg/dL decline in TG was associated with a 0.5 increase in HDL-C (p<0.0001). Niacin and statin users also evidenced significant increases in HDL-C (2.9 and 1.7 mg/dL, respectively). Exclusion of diabetic subjects did not materially affect results in the mixed regression model.
Table 3.
Estimates of regression coefficients from mixed model regression analyses1 with change from baseline in HDL-C in mg/dL as dependent variable (n=1820 observations)
| All Subjects | Diabetics Excluded | |||||
|---|---|---|---|---|---|---|
| Risk Variable | Estimate | SE | P value | Estimate | SE | P value |
| TG Change from Baseline | ||||||
| Baseline TG ≥ 200 | −0.010 | 0.001 | < 0.0001 | −0.14 | 0.002 | < 0.0001 |
| Baseline TG < 200 | −0.034 | 0.005 | < 0.0001 | −0.036 | 0.006 | 0.0001 |
| Niacin | 2.872 | 0.681 | < 0.0001 | 2.484 | 0.767 | 0.001 |
| Statins | 1.708 | 0.475 | 0.0003 | 1.735 | 0.565 | 0.002 |
| Smoker | −3.428 | 1.105 | 0.002 | −1.079 | 1.431 | 0.45 |
| Fibrates | 1.269 | 0.588 | 0.03 | 1.578 | 0.666 | 0.02 |
| Diet | 1.255 | 0.891 | 0.16 | 0.793 | 0.986 | 0.47 |
| Alcohol | 0.446 | 1.055 | 0.67 | 0.294 | 1.113 | 0.79 |
| BMI (baseline) | −0.042 | 0.133 | 0.75 | −0.140 | 0.150 | 0.35 |
| Exercise | 0.117 | 0.852 | 0.89 | 0.156 | 0.986 | 0.87 |
Adjusted for age and sex; patient included as a random effect.
TG as change from baseline in mg/dL
Discussion
The most important finding in the present study is that lowering TG is associated with increases in HDL-C even after adjustment for other covariates. While the inverse relationship between TG and HDL-C has been well established (3,7), few, if any, studies have evaluated the extent to which TG reduction is associated with a rise in HDL-C. That low HDL-C results from hypertriglyceridemic states represents in part, inefficient catabolism of TG rich lipoproteins and reduced transfer of surface components (e.g., phospholipids, apolipoprotein A-I) to nascent HDL particles. TG-enriched HDL particles are also more rapidly catabolized by lipases, thereby resulting in cholesterol depleted HDL particles (8).
The effect of TG reduction on HDL-C increase was most evident in non-hypertriglyceridemic patients (TG < 200 mg/dL), where each 50 mg/dL lowering of TG translated into a 1.7 mg/dL HDL-C increment. In contrast, the lower rise of HDL-C (0.5 mg/dL) in hypertriglyceridemic subjects likely reflected the wide range of TG levels at baseline (< 50 to > 1,000 mg/dL) thereby contributing to a diluted and attenuated TG lowering impact. Several variables were associated with HDL-C effects beyond TG lowering. For example cigarette smoking has been associated with inhibition of lecithin cholesterol acyltransferase (LCAT) activity (9), a pivotal enzyme involved in HDL maturation and reverse cholesterol transport (10). In addition to lowering TG, statins may also increase HDL-C by reducing activity of cholesteryl ester transfer protein (11). Niacin has been shown to raise HDL-C independent of TG lowering by reducing its catabolism (12). In addition to TG lowering of fibrates induced by peroxisome proliferator activated receptor mediated activation of lipoprotein lipase and repression of apolipoprotein C3 (13), an independent effect of fibrates on HDL-C may also result from apolipoprotein A-I activation (14).
The lack of HDL-C augmentation by lifestyle measures must be interpreted with caution in view of the lack of quantifiable food and exercise histories over time. Nonetheless, dietary therapies generally do not result in appreciable rises in HDL-C beyond that attained through TG lowering (15). Similarly, the HDL-C increases associated with aerobic activity are highly correlated with weight loss (16). Unfortunately, weight loss was not successfully achieved in the present study and is consistent with recent trends in the U.S. population (17). Rather, the improvements in blood pressure and lipids occurred via increased pharmacologic therapies over time.
Study Limitations
Due to the retrospective nature of this analysis, the study cannot address the extent to which reductions in TG and rise in HDL-C may have provided a salutary clinical impact. Moreover, the study cannot ascertain whether the change in TG effected the change in HDL-C or vice versa because several of the medications employed impact both variables. In addition, LDL-C levels were estimated rather than directly measured resulting in underestimation of LDL-C, especially in hypertriglyceridemic states (18). Finally, there is currently no firm evidence that therapeutic manipulation of triglycerides or HDL produces a cardiovascular outcome benefit independent of variations in LDL. Hopefully, the results of clinical trials to be completed within the next 4-6 years will provide important insights into this relevant issue.
Conclusions
Lowering TG is independently correlated with HDL-C increases, effects that are most pronounced at a TG range commonly encountered in the general population and in clinical practice (i.e., < 200 mg/dL).
Acknowledgments
Supported in part by a Veterans Affair Merit Award and NIH grant HL-61369
Footnotes
Presented in part at the 55th Annual Scientific Session of the American College of Cardiology, 2006
Publisher's Disclaimer: This is a PDF file of an unedited manuscript that has been accepted for publication. As a service to our customers we are providing this early version of the manuscript. The manuscript will undergo copyediting, typesetting, and review of the resulting proof before it is published in its final citable form. Please note that during the production process errors may be discovered which could affect the content, and all legal disclaimers that apply to the journal pertain.
References
- 1.Boden WE. High-density lipoprotein cholesterol as an independent risk factor in cardiovascular disease: assessing the data from Framingham to the Veterans Affairs High--Density Lipoprotein Intervention Trial. Am J Cardiol. 2000;86:19L–22L. doi: 10.1016/s0002-9149(00)01464-8. [DOI] [PubMed] [Google Scholar]
- 2.Assmann G. Pro and con: high-density lipoprotein, triglycerides, and other lipid subfractions are the future of lipid management. Am J Cardiol. 2001;87:2B–7B. doi: 10.1016/s0002-9149(01)01448-5. [DOI] [PubMed] [Google Scholar]
- 3.Brewer HB., Jr Hypertriglyceridemia: changes in the plasma lipoproteins associated with an increased risk of cardiovascular disease. Am J Cardiol. 1999;83:3F–12F. doi: 10.1016/s0002-9149(99)00308-2. [DOI] [PubMed] [Google Scholar]
- 4.Expert Panel on Detection, Evaluation, and Treatment of High Blood Cholesterol in Adults. Executive Summary of The Third Report of The National Cholesterol Education Program (NCEP) Expert Panel on Detection, Evaluation, And Treatment of High Blood Cholesterol In Adults (Adult Treatment Panel III) JAMA. 2001;285:2486–97. doi: 10.1001/jama.285.19.2486. [DOI] [PubMed] [Google Scholar]
- 5.Miller M, Bachorik PS, McCrindle BW, Kwiterovich PO., Jr Effect of gemfibrozil in men with primary isolated low high-density lipoprotein cholesterol: a randomized, double-blind, placebo-controlled, crossover study. Am J Med. 1993;94:7–12. doi: 10.1016/0002-9343(93)90113-4. [DOI] [PubMed] [Google Scholar]
- 6.Friedewald WT, Levy RI, Fredrickson DS. Estimation of the concentration of low-density lipoprotein cholesterol in plasma, without use of the preparative ultracentrifuge. Clin Chem. 1972;18:499–502. [PubMed] [Google Scholar]
- 7.Schaefer EJ, Levy RI, Anderson DW, Danner RN, Brewer HB, Jr, Blackwelder WC. Plasma-triglycerides in regulation of H.D.L.-cholesterol levels. Lancet. 1978;2(8086):391–3. doi: 10.1016/s0140-6736(78)91863-9. [DOI] [PubMed] [Google Scholar]
- 8.Lamarche B, Rashid S, Lewis GF. HDL metabolism in hypertriglyceridemic states: an overview. Clin Chim Acta. 1999;286:145–61. doi: 10.1016/s0009-8981(99)00098-4. [DOI] [PubMed] [Google Scholar]
- 9.Chen C, Loo G. Inhibition of lecithin: cholesterol acyltransferase activity in human blood plasma by cigarette smoke extract and reactive aldehydes. J Biochem Toxicol. 1995;10:121–8. doi: 10.1002/jbt.2570100302. [DOI] [PubMed] [Google Scholar]
- 10.Miller M, Zhan M. Genetic determinants of low high-density lipoprotein cholesterol. Curr Opin Cardiol. 2004;19:380–4. doi: 10.1097/01.hco.0000126584.12520.b5. [DOI] [PubMed] [Google Scholar]
- 11.Guerin M, Dolphin PJ, Talussot C, et al. Pravastatin modulates cholesteryl ester transfer from HDL to apoB-containing lipoproteins and lipoprotein subspecies profile in familial hypercholesterolemia. Arterioscler Thromb Vasc Biol. 1995;15:1359–68. doi: 10.1161/01.atv.15.9.1359. [DOI] [PubMed] [Google Scholar]
- 12.Rosenson RS. Antiatherothrombotic effects of nicotinic acid. Atherosclerosis. 2003;171:87–96. doi: 10.1016/j.atherosclerosis.2003.07.003. [DOI] [PubMed] [Google Scholar]
- 13.Staels B, Dallongeville J, Auwerx J, et al. Mechanism of action of fibrates on lipid and lipoprotein metabolism. Circulation. 1998;98:2088–93. doi: 10.1161/01.cir.98.19.2088. [DOI] [PubMed] [Google Scholar]
- 14.Duez H, Lefebvre B, Poulain P, et al. Regulation of human apoA-I by gemfibrozil and fenofibrate through selective peroxisome proliferator-activated receptor alpha modulation. Arterioscler Thromb Vasc Biol. 2005;25:585–91. doi: 10.1161/01.ATV.0000154140.73570.00. [DOI] [PubMed] [Google Scholar]
- 15.Sacks FM, Katan M. Randomized clinical trials on the effects of dietary fat and carbohydrate on plasma lipoproteins and cardiovascular disease. Am J Med. 2002;113 9B:13S–24S. doi: 10.1016/s0002-9343(01)00987-1. [DOI] [PubMed] [Google Scholar]
- 16.Williams PT, Wood PD, Krauss RM, et al. Does weight loss cause the exercise-induced increase in plasma high density lipoproteins? Atherosclerosis. 1983;47:173–85. doi: 10.1016/0021-9150(83)90153-3. [DOI] [PMC free article] [PubMed] [Google Scholar]
- 17.Mokdad AH, Serdula MK, Dietz WH, et al. The spread of the obesity epidemic in the United States, 1991-1998. JAMA. 1999;282:1519–22. doi: 10.1001/jama.282.16.1519. [DOI] [PubMed] [Google Scholar]
- 18.Marniemi J, Maki J, Maatela J, Jarvisalo J, Impivaara O. Poor applicability of the Friedewald formula in the assessment of serum LDL cholesterol for clinical purposes. Clin Biochem. 1995;28:285–9. doi: 10.1016/0009-9120(94)00095-d. [DOI] [PubMed] [Google Scholar]