

Abstract
Oxidative stress and apoptotic cell death have been implicated in the dopaminergic cell loss that characterizes Parkinson’s disease. While factors contributing to apoptotic cell death are not well characterized, oxidative stress is known to activate an array of cell signaling molecules that participate in apoptotic cell death mechanisms. We investigated oxidative stress-induced cytotoxicity of hydrogen peroxide (H2O2) in three cell lines, the dopaminergic mesencephalon-derived N27 cell line, the GABAergic striatum-derived M213-20 cell line, and the hippocampal HN2-5 cell line. N27 cells were more sensitive to H2O2-induced cell death than M213-20 and HN2-5 cells. H2O2 induced significantly greater increases in caspase-3 activity in N27 cells than in M213-20 cells. H2O2-induced apoptotic cell death in N27 cells was mediated by caspase-3-dependent proteolytic activation of PKCδ. Gene expression microarrays were employed to examine the specific transcriptional changes in N27 cells exposed to 100 μM H2O2 for 4 hrs. Changes in genes encoding pro- or anti-apoptotic proteins included up-regulation of BIK, PAWR, STAT5B, NPAS2, Jun B, MEK4, CCT7, PPP3CC and PSDM3, while key down-regulated genes included BNIP3, NPTXR, RAGA, STK6, YWHAH, and MAP2K1. Overall, the changes indicate a modulation of transcriptional activity, chaperone activity, kinase activity, and apoptotic activity that appears highly specific, coordinated and relevant to cell survival. Utilizing this in vitro model to identify novel oxidative stress-regulated genes may be useful in unraveling the molecular mechanisms underlying dopaminergic degeneration in Parkinson’s disease.
Keywords: mitochondria, oxidative stress, gene expression, caspases, PKCdelta, Parkinson’s disease
1. INTRODUCTION
The cellular mechanisms underlying selective loss of dopaminergic neurons in the substantia nigra associated with Parkinson’s disease (PD) remain elusive (Dawson and Dawson 2003; Forman et al. 2004; Greenamyre and Hastings 2004; Jenner 2003; Moore et al. 2005; Tatton et al. 2003). Although apoptosis is considered to be an important mode of neuronal cell death in PD, cell signaling events leading to apoptotic cell death of nigral dopaminergic neurons are not fully understood. Recent studies indicate oxidative stress is a major initiator of cell death in PD (Dawson and Dawson 2003; Forman et al. 2004; Greenamyre and Hastings 2004; Jenner 2003; Moore et al. 2005; Tatton et al. 2003). Oxidative stress results from the generation of reactive oxygen species (ROS) or impairment of the cellular antioxidant system, which triggers a cascade of events leading to apoptosis, including mitochondrial dysfunction, cytochrome C release, impairment of the ubiquitin-proteasomal degradation system and iron metabolism, excitotoxicity and activation of multiple caspases and transcriptional factors (Abou-Sleiman et al. 2006; Beal 2005; Dawson and Dawson 2003; Forman et al. 2004; Greenamyre and Hastings 2004; Jenner 2003; Moore et al. 2005; Tan and Dawson 2006; Tatton et al. 2003).
Microarray-based gene expression analysis provides a powerful approach to unravel molecular mechanisms in neurodegenerative disease by identifying the simultaneous transcriptional regulation of thousands of genes (Bassilana et al. 2005; Dangond et al. 2004; Duke et al. 2006; Grunblatt et al. 2004; Mandel et al. 2003c; Miller and Federoff 2006; Nesic et al. 2002; Ricciarelli et al. 2004; Youdim 2003). Microarray-based gene expression profiling has been used by several labs to determine the effects induced by dopaminergic toxins MPTP and rotenone on spatial and temporal gene expression in animal and cell culture models of neurodegenerative disorders (Bassilana et al. 2005; Bonin et al. 2004; Chun et al. 2001; Duke et al. 2006; Graham et al. 2004; Grunblatt et al. 2004; Grunblatt et al. 2001; Mandel et al. 2003a; Mandel et al. 2003c; Miller et al. 2004; Miller and Federoff 2006; Napolitano et al. 2002; Youdim 2003). These and related gene expression studies suggest that alterations of several genes associated with the cell cycle and apoptosis are associated with dopaminergic neuronal degeneration. In this study, we used H2O2 as a direct inducer of oxidative insult and examined early changes in gene expression.
The mesencephalon is directly affected in Parkinson’s disease. We therefore used the rat mesencephalon-derived N27 cell line, which represents a homogenous population of tyrosine hydroxylase-positive cells with functional characteristics resembling dopaminergic neurons (Prasad et al. 1998), as an in vitro model for studies of dopaminergic neurodegeneration (Anantharam et al. 2002; Kaul et al. 2003; Kitazawa et al. 2003; Yang et al. 2004). We have previously demonstrated that several dopaminergic toxins, including MMT, dieldrin, manganese and MPP+, all induce sequential proteolytic activation of caspase-3 and protein kinase C (PKCδ) followed by apoptotic cell death (Anantharam et al. 2002; Kaul et al. 2003; Kitazawa et al. 2003; Yang et al. 2004). We found that PKCδ is persistently activated as a result of the cleaved 41 kDa catalytic PKCδ fragment which subsequently promotes apoptotic cell death in N27 cells (Kanthasamy et al., 2003). In this study, we examined the H2O2-sensitivity of immortalized neuronal cell lines derived from different brain regions: a dopaminergic cell line (N27), a GABAergic cell line (M213-20), and a hippocampal cell line (HN2-5). These cell lines have been shown to retain a number of features that characterize the region and cell type from which they were derived (Anantharam et al. 2002; Giordano et al. 1993; Kaul et al. 2003; Kitazawa et al. 2003; Giordano et al. 1993; Prasad et al. 1998; Singh et al. 1996). Therefore, the differential sensitivity of these individual cell lines to H2O2 may demonstrate truly different responses underlying the different mechanisms of susceptibility observed in vivo.
Presently we establish that, compared to the striatum-derived, GABAergic cell line M213-20 (Giordano et al. 1993), or the hippocampal cell line HN2-5, (Singh et al. 1996), the N27 cell line is highly sensitive to H2O2-induced oxidative stress and ensuing apoptotic cell death, and that activation of caspase-3 and PKCδ is involved in this process. Furthermore, we employed microarray gene expression profiling to examine the gene expression changes that accompany the apoptotic cascade using N27 cells exposed to a concentration of H2O2 known to cause oxidative stress and apoptotic cell death. Analysis of gene expression changes indicated that mitochondrial dysfunction, apoptosis, dopamine metabolism, transcriptional regulation and ubiquitin-proteasome degradation systems were strongly affected. The microarray data were validated for select genes and proteins using semi-quantitative PCR and Western blotting, respectively. Together with our previous findings, this presents a picture of mitochondrial dysfunction, with regulation of anti- and proapoptotic factors, and confirms that caspase-3-induced proteolytic activation of PKCδ is a key step in mediating apoptotic cell death in N27 cells.
2. METHODS
2.1. Cell culture
N27 cells were derived from rat mesencephalon and immortalized using a temperature-sensitive allele of the large simian virus 40 T antigen (Prasad et al. 1998), and then grown in RPMI medium supplemented with 10% fetal bovine serum, 1% L-glutamine, 100 U/ml penicillin and 100 U/ml streptomycin. HN2-5 cells were derived from mouse hippocampal neurons immortalized and cultured to about 70–80% confluence in DMEM containing 10% fetal bovine serum and penicillin-streptomycin (Singh et al. 1996). Both HN2-5 and N27 cells were maintained at 37°C in a humidified atmosphere of 5% CO2. The GABAergic M213-2O cell line was derived from rat striatum and immortalized using a temperature-sensitive allele of the large simian virus 40 T antigen (Giordano et al. 1993), and grown in Dulbecco’s modified Eagle’s/F12 medium containing 10% fetal bovine serum, 2 mM L-glutamine, 50 u/ml penicillin, and 50 u/ml of streptomycin and incubated at 33°C in a humidified atmosphere containing 5% CO2. Tissue culture media and supplements were purchased from InVitrogen, Carlsbad, CA.
2.2. Treatment paradigm
N27, HN2-5 and M213-20 cells were grown to 70–80% confluency and then exposed to 100–300 μM H2O2 for 1–4 hrs. Cells were also pretreated with 50 μM Z-DEVD-fmk or 2 μM rottlerin prior to H2O2-treatment. Whenever possible, cells from the same treatment batch were simultaneously subjected to caspase-3 activity assay, western blot analysis, DNA fragmentation assay and total RNA extraction. All experiments were performed at least two times.
2.3. Cytotoxicity assays
Cytotoxicity assays were performed as described previously (Kaul et al., 2005). N27, M213-20 and HN2-5 cells were grown at similar cell densities in 24-well plates and simultaneously exposed to different concentrations of H2O2 (30–300 μM) and 1 μM of the cell-impermeable dye Sytox green® (Molecular Probes, Eugene, OR). Sytox green® enters dead cells and intercalates with DNA to produce a green fluorescent signal. The extent of cell death was quantified after 5 hrs, using the fluorescent reader with an excitation 485 nm and emission 538 nm.
2.4. Caspase-3 activity
Caspase-3 enzyme activity was determined as previously described (Kaul et al. 2003). Briefly, N27 and M213-20 cells were grown at similar cell densities in 24-well plates and were exposed to either 100 or 300 μM H2O2. After a 3 hr exposure, cells were lysed and the resulting supernatants incubated with 50 μM of the fluorescent caspase-3 substrate Ac-DEVD-AMC (MP Biomedicals, Irvine, CA) at 37°C for 1 hr. Caspase-3 activity was quantified using a fluorescence plate reader (excitation 380 nm, emission 460 nm; SpectraMax Gemini XS).
2.5. DNA fragmentation
DNA fragmentation was measured using a Cell Death Detection ELISA Plus Assay Kit (Roche Biochemicals, Indianapolis, IN) as described in our previous publications (Kaul et al. 2003). Briefly, N27 cells were grown at similar cell densities in 24-well plates and exposed to 100 μM H2O2. The extent of DNA fragmentation was quantified in cell lysates after different exposure times in a Spectramax Microplate Reader (405 nm, blank reference 490 nm).
2.6. RNA extraction
Total RNA was extracted from N27 cells exposed to 100 μM H2O2 for 4 hrs using TRIZOL® reagent (Invitrogen Ltd, Carlsbad, CA). A total of 2×10⁶ cells were homogenized at 4°C in 0.5 ml TRIZOL® Reagent per the manufacturers’ protocol. RNA pellets were gently air-dried, resuspended in RNAse-free water and stored at −80°C. The quantity and quality of the RNA samples were examined spectrophotometrically and by formaldehyde agarose gel electrophoresis, demonstrating high-quality RNA with no evidence of smearing of ribosomal RNA or of high molecular weight bands indicative of DNA contamination.
2.7. Microarray experiments
In this study we employed the Human Focused Array, a membrane-based cDNA microarray containing 2700 different elements in duplicate, which can be accessed at http://www.grc.nia.nih.gov/branches/rrb/dna/index/dnapubs.htm#2. We used this human-focused cDNA array, as opposed to full chips, because the first generation, larger, commercially available “full” arrays were associated with significant hybridization problems. Furthermore, few, if any, well-characterized rat arrays were commercially available at the time. In contrast, we had extensive experience with the focused cDNA arrays for cross-species experiments, and we determined that the arrays were reliable for the study since the relatively long cDNAs used in these focused arrays allowed for good hybridization, even with occasional mismatches.
Radioactive labeling of RNA with 33P-dCTP and hybridization assays were performed as described previously (Lehrmann et al. 2003). Briefly, 5 μg total RNA was reverse transcribed in the presence of 33P-labeled dCTP. The 33P-labeled cDNA was purified through a spin column, denatured, and diluted in hybridization buffer and allowed to hybridize to the HFA for 16–18 h at 55°C with rotation. After hybridization, the arrays were rinsed once with 2XSSC buffer at room temperature, and twice at 60°C for 10 min with 2XSSC containing 0.1% SDS. The arrays were exposed to a low-energy phosphor screen (Molecular Dynamics) for 5 days and scanned in a Phosphoimager 860 (Molecular Dynamics) at 50 μm resolution.
2.8. Z-scores and z-ratio
Raw hybridization intensity data were log-transformed and normalized to yield z-scores, which in turn were used to calculate a z-ratio value for each gene with respect to the H2O2-treated cells. The z-ratio was calculated as the difference between the observed gene z-scores for the experimental and the control comparisons, and dividing by the standard deviation associated with the distribution of these differences (Cheadle et al. 2003). Z-ratio values ≥ +2.0 or ≤ −2.0 were chosen as cut-off values, defining increased and decreased expression, respectively.
2.9. Semi-Quantitative Polymerase Chain Reaction (QPCR)
Select changes in gene expression were examined by semi-QPCR. cDNA was prepared from the same RNA samples that were used for microarray analysis, and reverse transcription was performed using Superscript First-strand cDNA Synthesis System (Invitrogen, Carlsbad, CA). All procedures were carried out as per the manufacturer’s protocol. Vector NTI software (version 1.2.6) was used to design oligonucleotide primers (Table 1), which were synthesized by Integrated DNA Technologies (Coralville, IA). Semi-QPCR was performed with first stand cDNA using Taq polymerase. Briefly, 1–2 μg of total RNA was digested with DNAse I at 65°C for 15 min. The DNAse I digest was then treated with dNTPs and oligo-dT for 5 min at 65°C, and then incubated with the RT-enzyme (provided with the kit) for 1 hr at 42°C and subsequently used in the PCR reaction. PCR was carried out in a 20 μl reaction using appropriate primer sets with platinum Taq polymerase (Invitrogen, MD) as per manufacturer’s instructions. The following PCR program was used: 95°C 4 min, (95°C 40s, 55°C 30s and 70°C, 45s)n and 72°C 5 min. The number of cycles (n) varied from 30–40. GAPDH and β-actin expression were used as internal controls. All PCR reactions were carried out in triplicate using a Thermo Hybaid PCR machine (Thermo Hybaid, Franklin, MA). PCR samples were then separated on 1% agarose gel. Images were captured with Kodak Image Station 2000MM (Kodak, Rochester, NY). The bands were quantified using the Kodak 1D (ver 3.6.2) software. Densitometric analysis of the bands obtained from untreated and H2O2-treated samples were normalized to respective GAPDH or β-actin message levels in the samples prior to comparison.
Table-1.
| Rat Gene | Accession Number | Direction | 5′-3′ Nucleotide sequence |
|---|---|---|---|
| GADPH | BC059110 | Forward
Reverse |
CAATGCATCCTGCACCACCAAC
CATACTTGGCAGGTTTCTCCAG |
| β-actin | NM_031144 | Forward
Reverse |
CCCCTCTGAACCCTAAGG
GAGGTCTTTACGGATGTCAA |
| PAWR | NM_033485 | Forward
Reverse |
AGCGAGAGGATGCTATCACA
TAGGGCATCTGTAGGCAACT |
| PSMD3 | XM_213452 | Forward
Reverse |
AGAGTTGGACACTGTCACCT
AGCTTGTCCAGGAACTCGT |
| CCND1 | NM_171992 | Forward
Reverse |
TGGATGCTAGAGGTCTGCGA
ACCACACTCCCAGCAGCCA |
| JUNB | NM_021836 | Forward
Reverse |
TCTACACCAACCTCAGCAGT
AGAGTCCAGTGTGTGAGCT |
| STAT5B | NM_022380 | Forward
Reverse |
GAAGCACCTTCAGATCAACCA
AGGATGATGGTCTGCTGCT |
| MAP2K1 | NM_031643 | Forward
Reverse |
AGGATGATGGTCTGCTGCT
AGCGAGAGGATGCTATCACA |
2.10. Western blotting
Changes in protein expression were also verified in Western blot experiments. Briefly, N27 cells in normal culture medium with serum were exposed to 100 μM H2O2 as described in section 2.2. Cell extractions were performed as described previously (Kaul et al. 2003). Cell lysates containing equal amounts of protein were loaded in each lane and separated on a 10–12% SDS-PAGE gel (Kaul et al. 2003). Proteins were then transferred to a nitrocellulose membrane, and non-specific binding sites were blocked by treating with 5% non-fat dry milk powder for 2 hr. The membranes were then treated with primary antibodies (1: 1000 to 1:2000 dilution) directed against PKCδ, PP2B, NIP3, JunB, Stat5B and MEKK4 (Santa Cruz Biotechnology, Santa Cruz, CA) for 1 hr, followed by secondary HRP-conjugated anti-rabbit (1:2000) for 1 hr. Secondary antibody-bound proteins were detected using the ECL chemiluminescence kit (Amersham, Piscataway, NJ). To confirm equal protein loading, blots were reprobed with a β-actin antibody (1:2000, Sigma-Aldrich, St. Louis, MO). Western blot images were captured with a Kodak 2000 MM imaging system (Kodak Inc., New Haven, CT). Western blot images are representative of data from at least 3 separate experiments.
3. RESULTS
3.1. H2O2-induced cytotoxicity in mesencephalic, striatal and hippocampal cell lines
The cytotoxicity of H2O2 on N27, M213-20 and HN2-5 cell lines was compared by exposing them to 30 μM, 100 or 300 μM H2O2 for 5 hr. As shown in Fig. 1, H2O2 treatment induced increases in cytotoxicity in N27 (317%, 373%, and 502%, respectively) and in M213-20 cells (131%, 179%, and 312%, respectively), whereas no or non-significant increases in cellular cytotoxicity was observed in HN2-5 cells (113%, 122%, and 136%, respectively). These results suggest that N27 cells were more sensitive to the oxidative insult by H2O2 than M213-20 or HN2-5 cells.
Fig. 1.
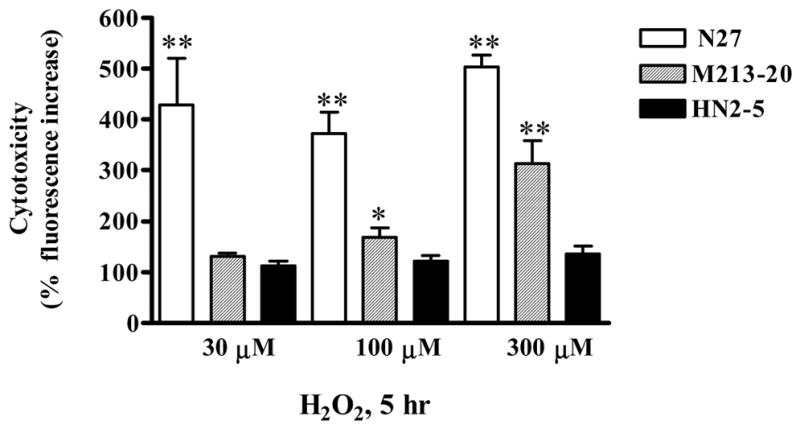
Differential sensitivity of neuronal cell lines to H2O2-induced cytotoxic cell death. N27 mesencephalic neuronal cells, M213-20 striatal and HN2-5 hippocampal cells were treated with 30–300 μM H2O2 for 5 hr and assayed for cell death with Sytox green assay. Data represent results from eight separate measurements and are expressed as mean ± SEM. Asterisks *p<0.05 and **p<0.01 indicates significant differences compared to untreated N27 cells.
3.2. H2O2-induced increased caspase-3 activity in N27 and M213-20 cell lines
As oxidative stress initiates a caspase cascade that leads to apoptotic cell death, we examined whether H2O2 exposure would induce the activation of caspase-3 in N27 and M213-30 cells. Caspase-3 activity was increased in both N27 and M213-20 cells after exposure to 100 or 300 μM H2O2 for 3 hr (Fig. 2). Compared to untreated cells, N27 cells demonstrated increases in caspase-3 activity of 461% and 1071%, respectively, while the increases in M213-20 cells were only 106% and 147%, respectively. These results suggest that caspase-3 may be implicated in the H2O2-induced cytotoxicity in both N27 and M213-20 cells, and further demonstrate that N27 cells display a higher sensitivity to H2O2-induced increases in caspase-3 activity than is the case for M213-20 cells.
Fig. 2.
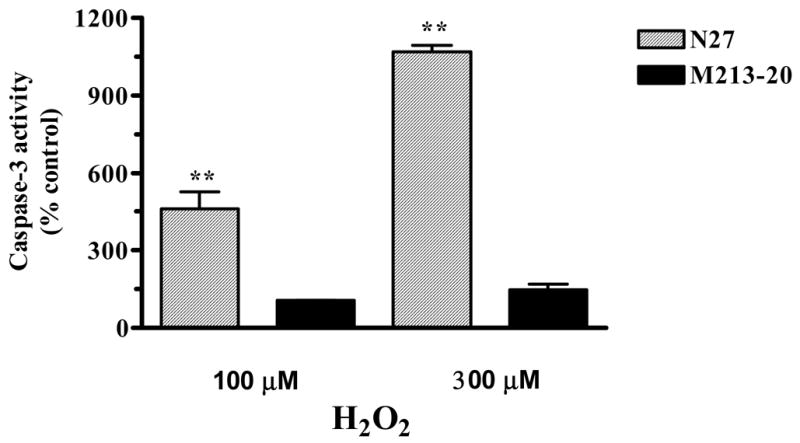
Differential sensitivity of neuronal cell lines to H2O2-induced increases in caspase-3 activation. N27 and M213-20 cells were exposed to 100 μM or 300 μM H2O2 for 3 hr at 37 °C. Caspase-3 activity was measured using Ac-DEVD-AMC, as described in the experimental procedures. The data are expressed as % control. Data represent results from five separate measurements and are expressed as mean ± SEM. Asterisks **p<0.01 indicates significant differences compared to untreated N27 cells.
3.3. Caspase-3 mediates proteolytic activation of PKCδ in the N27 cell line
Recently, we showed that PKCδ, a member of the novel PKC isoform family, is a key substrate for caspase-3 and is proteolytically activated during apoptotic cell death induced by various dopaminergic toxins (Anantharam et al. 2002; Kanthasamy et al. 2003; Kaul et al. 2003; Kitazawa et al. 2003; Yang et al. 2004). Caspase-3-mediated proteolytic cleavage of native full-length PKCδ (74 kDa) results in the persistently activated catalytic fragment (41 kDa) and regulatory fragment (38 kDa), and the persistently activated cleaved catalytic PKCδ fragment promotes apoptotic cell death in dopaminergic clonal cells. As shown in Fig 3, treatment with 100 μM and 300 μM H2O2 for 4 hr induces proteolytic cleavage of PKCδ (72–74 kDa) into 38-kDa regulatory and 41-kDa catalytically active fragments in N27 dopaminergic neuronal cells. Pretreatment with the caspase-3-specific inhibitor Z-DEVD-FMK (50 μM) significantly attenuated 100 μM H2O2-induced proteolytic cleavage of PKCδ (Fig. 3), suggesting that caspase-3 cleaves PKCδ in dopaminergic N27 cells.
Fig. 3.
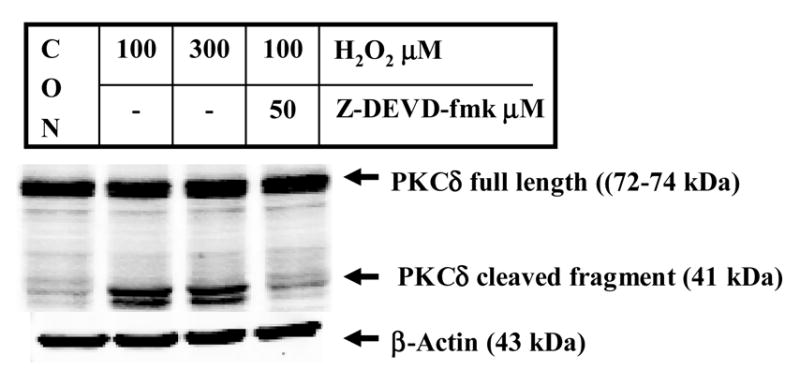
Caspase-3 mediates proteolytic cleavage of PKCδ following exposure of N27 cells to H2O2. N27 cells were exposed to 100 μM or 300 μM H2O2 for 4 hr at 37 °C. Cytosolic proteins were collected and resolved by 10% SDS-PAGE, as described in the experimental procedures. In inhibitor studies, cells were pretreated with 50 μM Z-DEVD-fmk prior to treatment with 100 μM H2O2. Arrowheads indicate native PKCδ (72–74 kDa) and cleaved PKCδ fragments (38–41 kDa). To confirm equal protein loading in each lane, the membranes were reprobed with β-actin antibody. The immunoblots were visualized using ECL detection agents from Amersham.
3.4. PKCδ mediates H2O2-induced apoptotic cell death in N27 cells
A quantitative DNA fragmentation assay was used to further confirm the results obtained by cytotoxicity assay. H2O2 treatment induced a time-dependent increase in DNA fragmentation in N27 cells (Fig. 4). Exposure to 100 μM H2O2 for 1 hr, 3 hr and 4 hr resulted in 113%, 168% and 387% increases in DNA fragmentation compared to untreated N27 cells, respectively. We next examined the effect of the PKCδ-specific inhibitor rottlerin on DNA fragmentation during H2O2 treatment. As shown in Fig. 4, DNA fragmentation was significantly suppressed in N27 cells pretreated with 5 μM rottlerin for 30 min prior to treatment with 100 μM H2O2 for 4 hr compared to H2O2-treated cells. On the other hand rottlerin treatment alone did not significantly alter the basal DNA fragmentation level. These data suggest that oxidative stress-induced apoptotic cell death is in part mediated by proteolytically activated PKCδ.
Fig. 4.
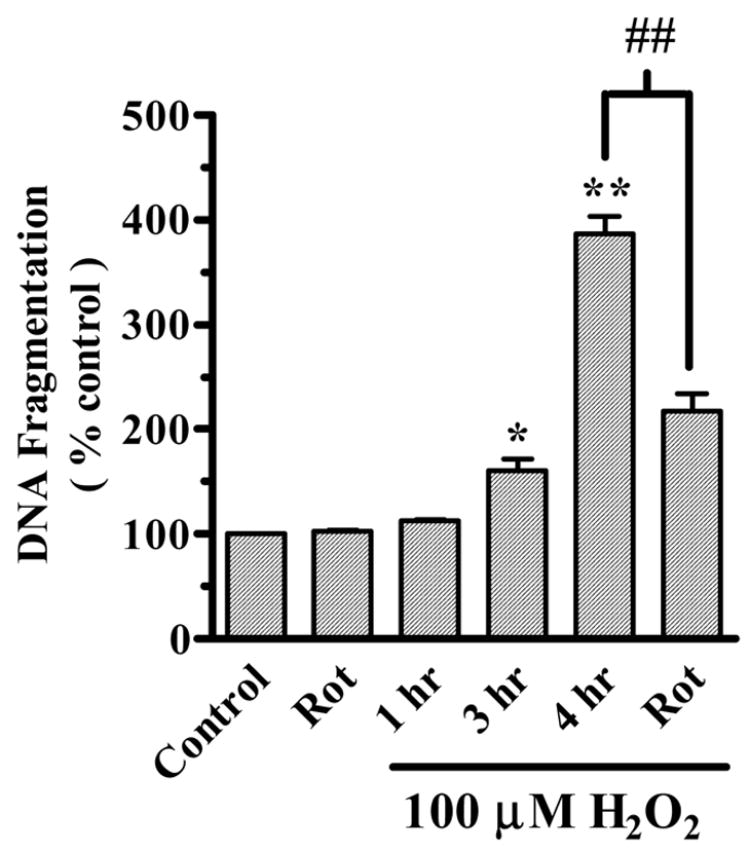
PKCδ mediates H2O2-induced apoptotic cell death. N27 cells were exposed to 100 μM for 1–4 hr at 37°C. In inhibitor studies, cells were pretreated with 2 μM rottlerin (Rot) for 30 min prior to treatment with 100 μM H2O2. Cells were lysed after treatment and the extent of DNA fragmentation was determined using a quantitative ELISA assay as described in the experimental procedures. The data are expressed as percentage of apoptosis observed in untreated cells, and represent the mean ± SEM of six individual measurements. Asterisks (*p<0.05, **p<0.01) indicate significant differences between untreated and H2O2-treated cells. Pound sign (#p<0.01) indicates significant differences between H2O2-treated and rottlerin-treated cells.
3.5. Microarray analysis of gene expression in H2O2-treated N27 cells
As N27 cells were more sensitive to oxidative stress-induced apoptotic cell death than M213-20 cells, cDNA microarrays were employed to profile the gene expression changes in N27 cells exposed to 100 μM H2O2 for 4 hrs. Gene expression was significantly altered by H2O2-treatment, with increases in sixty-five and decreases in forty-five candidate genes, respectively. We classified the candidate transcripts into groups associated with essential cellular functions, which demonstrated changes in genes encoding proteins associated with apoptosis, cell cycle and growth, chaperones, disease-related, mitochondria/redox, ubiquitin-proteasome system, nuclear/transcription, kinases, phosphatases, Ras/Rab related GTPases, and others (Table 2).
Table 2.
| 1Candidate genes | Accession Number | Human Gene description | Z-Ratio H2O2/Conrol |
|---|---|---|---|
| Apoptosis | |||
| MCL1 | NM_021960 | myeloid cell leukemia sequence 1 (BCL2-related) | + 4.0 |
| BIK | NM_001197 | Bcl2-interacting killer (apoptosis-inducing) | + 4.0 |
| PAWR | NM_002583 | apoptosis, WT1, regulator | + 3.7 |
| PLAGL1 | U72621 | Pleiomorphic adenoma gene-like1, apoptosis regulator | + 2.5 |
| DAP | NM_004394 | death-associated protein | + 2.4 |
| ASC | NM_145183 | apoptosis-associated speck-like protein containing a CARD | + 2.3 |
| CASP6 | NM_001226 | caspase 6, apoptosis-related cysteine protease PRKC, | + 2.1 |
| BNIP3 | NM_004052 | BCL2/adenovirus E1B 19kDa interacting protein 3 | − 3.8 |
| GLTSCR2 | BC013203 | glioma tumor suppressor candidate region gene 2 | − 2.5 |
| AKT1 | NM_005163 | v-akt murine thymoma viral oncogene homolog 1 | − 2.1 |
| AKT2 | AK054771 | v-akt murine thymoma viral oncogene homolog 2 | − 2.1 |
| BCL2L2 | NM_004050 | Bcl-2 related protein | − 2.0 |
| Cell cycle and Growth | |||
| CCND1 | NM_053056 | cyclin D1 (PRAD1: parathyroid adenomatosis 1) | + 11.7 |
| REPRIMO | NM_019845 | candidate mediator of the p53-dependent G2 arrest | + 4.1 |
| CDC2 | NM_001786 | cell division cycle 2, G1 to S and G2 to M | + 3.5 |
| CDC6 | NM_001254 | cell division cycle 6 homolog (S. cerevisiae) | − 2.1 |
| Chaperones | |||
| CCT7 | NM_006429 | chaperonin containing TCP1, subunit 7 (eta) | + 5.9 |
| CSDA | NM_003651 | cold shock domain protein A | + 2.6 |
| HSPA1A | NM_005345 | heat shock 70kDa protein 1A | + 2.5 |
| HSPD1 | BC010112 | heat shock 60kDa protein 1 (chaperonin) | + 2.0 |
| 14-3-3η | L20422 | multifunctional regulatory proteins 14-3-3 family member | − 2.7 |
| HSPA4 | AB023420 | heat shock 70kDa protein 4 | − 2.0 |
| Disease | |||
| EMD | NM_170708 | emerin (Emery-Dreifuss muscular dystrophy) | + 6.1 |
| STK11 | NM_000455 | serine/threonine kinase 11 (Peutz-Jeghers syndrome) | + 3.5 |
| DSCR8 | BC117304 | amyloid beta (A4) precursor protein | + 2.4 |
| APP | NM_000484 | Down syndrome critical region gene 8 | + 2.3 |
| ATM | NM_000051 | ataxia telangiectasia | + 2.0 |
| MADH1 | NM_005900 | MAD, mothers against decapentaplegic homolog 1 | − 3.7 |
| MADH6 | NM_005585 | MAD, mothers against decapentaplegic homolog 6 | − 2.9 |
| WBSCR5 | AF252611 | Williams-Beuren syndrome chromosome region 5 | − 2.1 |
| Mitochondria/Redox | |||
| MCSP | NM_030663 | mitochondrial capsule selenoprotein | + 12.7 |
| ATP5D | BC004426 | ATP synthase, H+ transporting, F1 complex, delta subunit | + 4.0 |
| NDUFS1 | BC030833 | 75 kDa NADH dehydrogenase (ubiquinone) Fe-S protein 1 | + 3.5 |
| TOMM20 | NM_014765 | translocase of outer mitochondrial membrane 20 | + 2.6 |
| SLC25A15 | NM_014252 | member mitochondrial carrier; ornithine transporter | − 3.9 |
| UCP3 | NM_003356 | uncoupling protein 3 (mitochondrial, proton carrier) | − 3.0 |
| MTCH1 | NM_014341 | mitochondrial carrier homolog 1 | − 2.3 |
| Ubiquitin- Proteosome | |||
| PSMD3 | NM_002809 | proteosome (prosome, macropain) 26S subunit, non-ATPase, 3 | + 3.0 |
| USP4 | NM_003363 | ubiquitin specific protease 4 (proto-oncogene) | + 2.0 |
| UBE2J1 | BC013973 | ubiquitin-conjugating enzyme E2, J1 | − 2.5 |
| UBC3B | BC047584 | ubiquitin-conjugating enzyme E2R 2 | − 2.3 |
| Nuclear/Transcription | |||
| NPAS2 | NM_002518 | Gas-responsive heme-binding neuronal PAS transcription factor | + 5.3 |
| USF2 | NM_003367 | upstream transcription factor 2, c-fos interacting jun B proto- | + 5.2 |
| JUNB | NM_002229 | oncogene | + 4.0 |
| STAT5B | NM_012448 | Signal transducer and activator of transcription 5B | + 4.0 |
| ATF4 | NM_001675 | activating transcription factor 4 | + 3.8 |
| TP53BP2 | NM_005426 | tumor protein p53 binding protein, 2 | + 3.0 |
| WIG1 | AK122768 | p53 target zinc finger protein | − 6.5 |
| SUPT4H1 | NM_003168 | suppressor of Ty 4 homolog 1 (S. cerevisiae) | − 5.5 |
| HSF1 | NM_005526 | heat shock transcription factor 1 | − 3.6 |
| TFAP4 | NM_003223 | transcription factor AP-4 (activating enhancer binding protein 4) | − 3.0 |
| Kinases | |||
| DYRK2 | NM_006482 | dual-specificity tyrosine-(Y)-phosphorylation regulated kinase 2 | + 4.6 |
| MEKK4 | NM_002747 | mitogen-activated protein kinase kinase kinase kinase 2 | + 3.8 |
| PHKA2 | NM_000292 | phosphorylase kinase, alpha 2 (liver) | + 3.7 |
| STK11 | NM_000455 | serine/threonine kinase 11 (Peutz-Jeghers syndrome) | + 3.5 |
| PTK2 | AL832961 | protein tyrosine kinase 2 | + 2.6 |
| ABI-2 | NM_005759 | abl-tyrosiine kinase interactor 2 | + 2.5 |
| CSNK2A2 | NM_001896 | casein kinase 2, alpha prime polypeptide | − 3.8 |
| STK6 | NM_003600 | serine/threonine kinase 6 | − 3.5 |
| MAP2K1 | NM_002755 | mitogen-activated protein kinase kinase 1 | − 3.2 |
| TYK2 | NM_003331 | tyrosine kinase 2 | − 2.8 |
| CSNK1E | NM_001894 | casein kinase 1, epsilon | − 2.3 |
| Phosphatases | |||
| PP2B | NM_005605 | protein phosphatase 2B (PPP3CC, calcineurin A gamma) | + 3.0 |
| PTPN2 | NM_002828 | protein tyrosine phosphatase, non-receptor type 2 | + 2.3 |
| PPM1D | NM_003620 | protein phosphatase 1D magnesium-dependent, delta isoform | − 4.6 |
| PPP1R8 | NM_138558 | protein phosphatase 1, regulatory (inhibitor) subunit 8 | − 3.1 |
| PR48 | BC041879 | protein phosphatase 2A 48 kDa regulatory subunit | − 3.0 |
| PPP5C | NM_006247 | protein phosphatase 5, catalytic subunit | − 2.8 |
| Ras/Rab related GTPases | |||
| RAB5C | NM_004583 | RAB21, member RAS oncogene family | + 3.5 |
| RAB21 | NM_014999 | RAB32, member RAS oncogene family | + 3.2 |
| RAB32 | NM_006834 | RAB5C, member RAS oncogene family | + 3.2 |
| RAGA | NM_006570 | Ras-related GTP-binding protein | − 6.2 |
| RABL2B | NM_007081 | RAB, member of RAS oncogene family-like 2B | − 5.5 |
| RAB2 | NM_002865 | RAB2, member RAS oncogene family | − 2.7 |
| Others | |||
| SNCB | NM_003085 | synuclein, beta | − 3.8 |
| NPTXR | NM_014293 | Neuronal Pentraxin Receptor, mediates pattern recognition | − 3.6 |
| NEUROD1 | DQ894747 | neurogenic differentiation 1 | − 3.1 |
| YWHAH | NM_003405 | tyrosine 3-monooxygenase/tryptophan 5-monooxygenase | − 3.0 |
| MAOB | NM_000898 | activation (eta) monoamine oxidase B | − 2.2 |
The candidate genes have been classified into functional groups and were annotated using the GenBank Accession numbers. Z-ratio values ≥ +2.0 or ≤ −2.0 were chosen as cut-off values, defining increased and decreased expression, respectively (see methods for more details).
3.6. Semi-Quantitative PCR analysis of gene expression changes in H2O2-treated N27 cells
Select transcripts that were identified in the microarray analysis to be significantly changed following a 4 hr exposure to 100 μM H2O2 were re-examined by semi-QPCR (Table 2). The human cDNA array provided results that could not be examined due to the limited availability of some corresponding rat sequences in GenBank. The semi-QPCR validated the gene expression changes for the six rat transcripts, Cyclin D1 (CCND1), signal transducer and activator of transcription 5b (STAT5b), Jun-B oncogene (JunB), PRKC, apoptosis, WT1, regulator (PAWR), proteasome (prosome, macropain) 26S subunit, non-ATPase, 3 (PSMD3), and mitogen activated protein kinase kinase 1 (MAP2K1). An unchanged normalization transcript, glyceraldehyde-3-phosphate dehydrogenase (GAPDH) was also examined (Table 2). Semi-QPCR confirmed the increased gene expression for CCCND1, STAT5B, JunB, PAWR, and PSMD3 and decreased MAP2K1 gene expression in H2O2-treated cells.
3.7. Western blotting analysis of proteins whose gene expression was changed in H2O2-treated N27 cells
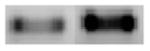
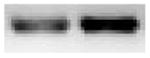
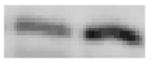
The lack of availability of specific antibodies detecting the rat proteins encoded by candidate genes limited our evaluation of all candidate genes. Five rat proteins, Jun-B, STAT5b, mitogen-activated protein kinase kinase kinase 4 (MEKK4), protein phosphatase 3, catalytic subunit, beta isoform (PPP3Cβ), and the fBCL2/adenovirus E1B 19 kDa-interacting protein 3 (BNIP3), were examined (Table 3). Increases in JunB, STAT5b, MEKK4 and PPP3CC were observed at the protein level, as was the decrease in BNIP3 protein levels.
Table 3.
Quantitative RT-PCR analysis of select candidate genes
| Genes | Band size (bp) | DNA Gel Con - H2O2 | H2O2/con mRNA fold difference | Z-Ratio H2O2/Con |
|---|---|---|---|---|
| CCND1
cyclin D1 |
720 |
|
+ 4.1 | + 11.7 |
| STAT5B
Signal transducer and activator of transcription 5B |
326 |
|
+ 3.0 | + 4.0 |
| Jun B
proto-oncogene |
630 |
|
+ 2.8 | + 4.0 |
| PAWR
apoptosis, WT1, regulator |
852 |
|
+ 2.9 | + 3.7 |
| PSMD3
26S proteosome subunit, non- ATPase, 3 |
976 |
|
+ 2.8 | + 3.0 |
| MAP2K
mitogen-activated protein kinase kinase 1 |
1703 |

|
− 1.1 | − 3.2 |
| GAPDH
Glycerol Aldehyde Dehydrogenase |
640 |
|
+ 1.0 | - |
Total RNA was extracted from control and H2O2-treated N27 cells using the Trizol reagent. RT-PCR was performed using the primers designed against the rat species (see methods section for more details).
4. DISCUSSION
To better understand the selective degeneration of dopaminergic neurons in PD pathology, we studied the sensitivity of immortalized mammalian cell lines derived from the mesencephalon (N27, dopaminergic), striatum (M213-20, GABAergic) and hippocampus (HN2-5) to oxidative stress by exposing them directly to H2O2. H2O2 induced cytotoxic cell death in all three cell types; N27 cells were most sensitive and HN2-5 cells were least sensitive (N27>M213-20 and HN2-5). H2O2 treatment also induced increases in caspase-3 enzyme activity in N27 and M213-20 cells. GABAergic M213-20 cells were also less sensitive to H2O2-induced increases in caspase-3 enzymatic activity. Pretreatment with the caspase-3-specific inhibitor Z-DEVD-FMK significantly attenuated H2O2-induced proteolytic activation of PKCδ in N27 cells. Further, pretreatment with the PKCδ-specific inhibitor rottlerin significantly suppressed H2O2-induced DNA fragmentation in N27 cells. Taken together, our results suggest that mesencephalic dopaminergic N27 cells are more susceptible to H2O2-induced apoptotic cell death than striatal M213-20 and hippocampal HN2-5 cells. These results support the view that nigral dopaminergic neurons are highly vulnerable to oxidative damage.
To study the gene expression changes that accompany the oxidative stress-induced apoptotic cascade, microarray analysis was performed in N27 cells subjected to oxidative insult. The present study demonstrated that gene expression is significantly altered by H2O2 treatment, and we identified 65 primary candidate genes that were up-regulated and 45 candidate genes that were down-regulated. These genes were classified into groups associated with essential cellular functions including apoptotic cell death, mitochondrial dysfunction, transcriptional changes, second messenger systems, chaperone functions, ubiquitin-proteasome degradation, cell growth, and cytoskeletal architecture. The functional consequences of these select candidate genes are discussed below.
4.1. Proteasomal subunit 3 (PSMD3)
PSMD3 is a part of the 26S proteasome complex, which represents the most important site for protein degradation in eukaryotic cells, and consists of several components: the 20S multimeric complex containing the catalytic sites, an 11S proteasome activator, and the 19S regulatory particle (Ardley et al. 2004; Bossy-Wetzel et al. 2004). Recent evidence indicates that impairment of the ubiquitin-proteasome system, in addition to its established role in oxidative stress and mitochondrial dysfunction, may also contribute to the pathogenesis of PD (Dawson and Dawson 2003; Forman et al. 2004; Hattori and Mizuno 2004). Recently, gene defects in ubiquitin carboxyl-terminal esterase L1 (UCHL1), an enzyme linked to ubiquitination, and parkin have been noted. Microarray analysis revealed a 3-fold increase in Z-ratio of PSMD3 transcripts in H2O2-treated N27 cells (Table 2). These results were also confirmed by RT-PCR (Table 3). Therefore, oxidative stress-induced increases in PSDM3 levels may cause impairment of the ubiquitin-proteasome pathway during neuronal apoptosis.
4.2. Cyclin D1 (CCND1)
CCND1 is an important cell-cycle regulatory protein associated with cell proliferation and differentiation (Aguirre et al. 2004). CCND1 is thought to regulate the activities of Cdk4, Cdk6 and MEK-ERK, and its over-expression has been reported in several cancers and hematopoietic malignancies. Studies in experimental models suggest that Cdks and MAP-kinase may play roles in the pathogenesis of PD. Additionally, CCND1 has also been demonstrated to bind to several transcription factors and to modulate their transcriptional activity (Aguirre et al. 2004). In our study, microarray data revealed a 12-fold increase in the Z-ratio of CCND1 transcripts in H2O2 treated N27 cells (Table 2), which was supported by the 4.1-fold increase found by RT-PCR (Table 3), suggesting a role for CCND1 in oxidative stress-mediated dopaminergic cell death.
4.3. BCl-2-interacting killer protein (BIK)
BIK is an apoptosis regulator belonging to the family of BH3-only proteins (Hur et al. 2004). The BH3-only members of the Bcl-2 protein family are essential for initiation of programmed cell death and stress-induced apoptosis. These proteins share the 9-amino acid BH3 region, which binds directly to the anti-apoptotic members of the Bcl-2 family and inhibits their apoptosis-suppressing function. Recently, BIK was demonstrated to play a role in stress-induced apoptosis, and suppression of BIK expression by siRNA protected cells from apoptotic cell death (Hur et al. 2004). Furthermore, BIK was strongly induced both at the mRNA and protein levels in estrogen starved cell models (Hur et al. 2004). We observed that H2O2 treatment induced a 4-fold increase in Z-ratio of BIK expression in microarray experiments (Table 2). Therefore, up-regulation of the BIK gene may render the dopaminergic cells vulnerable to oxidative stress, and suggests a pro-apoptotic role of BIK in oxidative stress-induced neuronal apoptosis.
4.4. Bcl-2/adenovirus E1B 19 kDa-interacting protein (BNIP3)
BNIP3 is an apoptosis regulator belonging to the Bcl-2 family of proteins (Crow 2002). Studies have shown BNIP3 plays a pivotal role in hypoxia- and ceramide-induced apoptotic cell death. BNIP3 expression is down-regulated in almost all pancreatic adenocarcinomas compared with normal pancreas (Crow 2002). Further, over-expression of the BNIP3 gene confers sensitivity of cells to apoptotic stimuli (Giatromanolaki et al. 2004). Our microarray analysis revealed that H2O2 treatment of N27 cells decreased the Z-ratio of BNIP3 by almost 3.8-fold (Table 2). These results were further validated by Western blot experiments demonstrating a 3-fold decrease in BNIP3 protein level (Table 4). Thus, the down-regulation of BNIP3 may suggest a pro-apoptotic role for BNIP3, and may represent a protective response of dopaminergic cells to overcome oxidative insult.
Table 4.
Western blot analysis of select candidate genes
| Genes | Band size (kDa) | Western blot Con - H2O2 | Protein H2O2/Con fold difference | Z-Ratio H2O2/Con |
|---|---|---|---|---|
| Jun B
proto-oncogene |
39 |
|
+ 3.0 | + 4.0 |
| STAT5B
Signal transducer and activator of transcription 5B |
80 |
|
+ 2.5 | + 4.0 |
| MEKK4
mitogen-activated protein kinase kinase kinase kinase 2 |
45 |
|
+ 3.6 | + 3.8 |
| PP2B
protein phosphatase 2B (calcineurin A gamma) |
60 |
|
+ 2.3 | + 3.0 |
| BNIP3
BCL2/adenovirus E1B interacting protein 3 |
19 |
|
− 3.0 | − 3.8 |
| β–actin | 43 |
|
+ 1.0 | - |
Control and H2O2-treated cell extracts were separated on 10–15% SDS-PAGE followed by western blot. Primary antibodies that would recognize the rat species were used in this study (see methods section for more details).
4.5. Mitogen-activated protein kinase kinase kinase 4 (MEKK4)
In mammalian cells, two families of stress-responsive MAPKs, JNK and p38, are activated by a variety of environmental stimuli including oxidative stress (Thomas and Huganir 2004). These MAPKs are activated by their cognate MAPK kinases (MAPKKs) and MAPKK kinases (MAPKKKs) through phosphorylation. MAP3K4 is one of the MAPKKKs that act upstream of JNK and p38. Recent studies have suggested a new mode of p38/JNK activation, which involves an interaction between GADD45 proteins and MAP3K4. MAP3K4 has also been shown to interact with 14-3-3 proteins (Thomas and Huganir 2004). Micorarray analysis revealed an increase in Z-ration by 3.8-fold in MEKK4 mRNA levels in H2O2-treated N27 cells (Table 2). These results were further confirmed by a 3.6-fold increase in protein expression as determined by Western blot experiments (Table 4). Overall, H2O2-induced increases in both mRNA and protein levels for MEKK4 suggest a key role for this kinase in oxidative stress-induced apoptotic cell death of neuronal cells.
4.6. PKC apoptosis WT1 regulator (PAWR)
PAWR is a Wilms tumor 1 (WT1)-interacting protein which suppresses WT1 transcription factor function via physical interaction, resulting in deregulated cell growth and tumorigenesis (Johnstone et al. 1998). PAWR has been demonstrated to induce apoptosis in different cell types and is up-regulated in rat prostate cells undergoing apoptosis, while over-expression of PAWR confers enhanced sensitivity to apoptotic stimuli. Recently, PAWR has also been shown to inhibit the activity of the atypical PKC isoforms by physically interacting with these proteins (Moscat and Diaz-Meco 2003). As shown in Table 4, exposure to H2O2 increased the Z-ratio of PAWR gene by almost 4-fold in microarray experiments (Table 2). These results were confirmed in RT-PCR experiments where we observed a 3-fold increase in PAWR mRNA levels (Table 3). Our results suggest that PAWR is a pro-apoptotic protein and renders the dopaminergic cells vulnerable to oxidative stress.
4.7. Signal transducer and activator of transcription 5b (STAT5B)
STAT5B activity is induced by a number of cytokines and growth factors, resulting in transcriptional activation of specific target genes (Baskiewicz-Masiuk and Machalinski 2004). STAT5B plays an important role in a variety of cellular processes, including proliferation, differentiation, and apoptosis (Baskiewicz-Masiuk and Machalinski 2004). Aberrant regulation of STAT5 has been observed in solid tumors as well as in patients with either chronic or acute myeloid leukemia (Merghoub et al. 2001). Dominant-negative STAT5B has recently been shown to inhibit tumor growth and induces apoptosis in T47D-derived tumors in nude mice. Therefore, STAT5B is considered to be a survival factor (Yamashita et al. 2004). STAT1 was recently shown to mediate etoposide-induced apoptosis in HeLa cells (Devries et al. 2004). In our microarray experiments with N27 cells treated with H2O2, we observed that STAT5B was up-regulated by a z-ratio of 4 (Table 2). A 3-fold increase in mRNA level (Table 3) and 2.5-fold increases in protein levels (Table 4) were obtained from semi-quantitative RT-PCR and Western blot experiments respectively confirming the microarray data. These data suggest that STAT5B may play an anti-apoptotic role in oxidative stress-induced apoptotic cell death.
4.8. JunB proto-oncogene (JunB)
JunB is a member of the activator protein-1 (AP-1) family of transcription factors and over-expression of JunB protects against axotomy-induced nigral cell death (Winter et al. 2002). JunB appears to function as a negative regulator of a number of cell systems, including proliferation, cell cycle progression and cell survival (Pietro and Zauli 2004). In M1 mouse myeloid leukemia cells, induction of differentiation with either chemicals or cytokines is associated with an increase in junB expression (Pietro and Zauli 2004). In this study, microarray analysis revealed an increase in JunB expression by a z-ratio of 4 after exposure to H2O2 (Table 2). Microarray results were confirmed with RT-PCR and Western blot analysis, which revealed a 2.8-fold increase in mRNA and a 3-fold increase in protein levels in H2O2-treated N27 cells (Tables 3 and 4). Our data therefore suggest that JunB may play an important role in oxidative damage in dopaminergic cells.
4.9. Protein phosphatase 2B (PP2B)
PP2B is a member of the protein phosphatase (PP) family of proteins involved in the dephosphorylation of serine and threonine residues. In general, the phosphatase holoenzyme is a trimeric complex composed of a regulatory subunit, a variable subunit and a catalytic subunit. Four major families of protein phosphatase catalytic subunits have been identified, designated PP1, PP2A, PP2B (calcineurin) and PP2C (Strack et al. 2004). Calcineurin is a calcium-dependent serine/threonine protein phosphatase that is highly expressed in the CNS and has been implicated in neurodegenerative disorders including PD (Tatton et al. 2003; Wu et al. 2004). Recently, the PP2B gene was identified as a potential schizophrenia susceptibility gene, supported by the idea that alterations in PP2B signaling contribute to schizophrenia pathogenesis (Gerber et al. 2003). Recent studies have shown the decrease in DARPP-32 Thr34 phosphorylation was mediated through Ca2+-dependent activation of the Ca2+-/calmodulin-dependent phosphatase, PP2B in the neostriatal neurons (Nishi et al. 2002). In contrast, the decrease in Thr75 phosphorylation was mediated through Ca2+-dependent activation of dephosphorylation by protein phosphatase-2A. The results provide support for a complex effect of glutamate on dopaminergic signaling through the regulation of dephosphorylation of different sites of DARPP-32 by different protein phosphatases. Analysis of microarray data revealed a 3.0-fold increase in the Z-ratio of PP2B expression after H2O2 treatment (Table 2). Western blot analysis revealed a 2.3-fold increase in protein levels in H2O2-treated N27 cells (Table 4). Our data therefore suggest that PP2B may play a critical role in oxidative stress-induced dopaminergic cell death.
4.10. Neuronal PAS domain protein 2 (NPAS2)
NPAS2 has been postulated to be a carbon dioxide and nitric oxide-responsive transcription factor implicated in circadian rhythm regulation (Gilles-Gonzalez and Gonzalez 2004). Nitric oxide knockout animals were resistant to Parkinsonian toxin MPTP-induced dopaminergic cell death and neuronal nitric oxide inhibitor protects against MPTP neurotoxicity (Grunewald and Beal 1999). In this study, we found a 5.3-fold increase in the Z-ratio of NPAS2 mRNA levels in response to H2O2 exposure (Table 2), suggesting this heme-binding NPAS2 transcription factor may play a role in H2O2-induced apoptotic cell death of dopaminergic cells.
4.11. Myeloid cell leukemia-1 (MCL-1)
MCL-1 is an anti-apoptotic Bcl-2 family protein which prevents apoptosis by maintaining the integrity of the mitochondrial membrane, thereby preventing the release of cytochrome C, activation of caspases and DNA fragmentation (Zhuang and Brady 2006). In this study, we observed that H2O2-treatment induced an increase by a z-ratio of 4 in the expression of the MCL-1 gene in microarray experiments (Table 2). Therefore, up-regulation of the MCL-1 gene may suggest an anti-apoptotic response of dopaminergic cells to oxidative insult and an anti-apoptotic role of MCL-1 in oxidative-stress-induced neuronal apoptosis.
4.12. Suppressor of Ty4 homolog 1 (Supt4H1)
Supt4H1 interacts with histones to assemble a repressive chromatin structure, important for the formation and/or maintenance of chromatin structure (Bolton and Boeke 2003). Therefore, the down-regulation of Supt4H1 mRNA by a z-ratio of −5.5 observed in this study could influence the loss of chromatin structure, which may have contributed to the chromatin condensation observed during H2O2-induced dopaminergic apoptosis (Table 2).
4.13. Synuclein beta (SNCB)
The synuclein family consists of three isoforms termed α, β and γ. α-Synuclein, but not β- or γ-synucleins, accumulate in various pathological lesions in neurodegenerative disorders, such as Parkinson’s disease (PD), dementia with Lewy bodies (DLB) and multiple system atrophy, which are collectively termed alpha-synucleinopathies (Von Bohlen Und Halbach 2004). Previously, we showed that α-synuclein over-expression protects against MPP+ neurotoxicity (Kaul et al. 2005). Also, MPTP induced a down-regulation of α-synuclein, but did not affect regulation of β-synuclein or parkin, in the murine substantia nigra (Xu et al. 2005). Additionally, α-synuclein-derived peptides that blocked α-synuclein aggregation were able to protect against oxidative stress in transgenic animal models of PD, suggesting that loss of the α-synuclein regulation may result in cell death. The observed down-regulation of β-synuclein (z-ratio = −3.8) may initiate α-synuclein aggregation and contribute to dopaminergic cell death (Table 2).
4.14. Chaperonin-containing TCP1 protein (CCT7)
CCT7 is a eukaryotic chaperonin, which is part of a hetero-oligomeric complex that facilitates the proper folding of tubulin, actin and centractin. Alterations in the gene expression of the structural proteins actin and tubulin have recently been reported in MPTP-induced dopaminergic degeneration (Cairns et al. 2004; Przedborski and Vila 2003). We observed an approximately 6-fold increase in the z-ratio of CCT7 by microarray analysis (Table 2), suggesting that the chaperone activity of CCT7 may be important for oxidative stress-induced neuronal apoptosis.
4.15. Tyrosine 3-monooxygenase/tryptophan 5-monooxygenase activation protein, eta polypeptide (YWHAH)
YWHAH, or 14-3-3 eta (14-3-3η) is a member of the dimeric 14-3-3 family of signal transduction proteins that specifically binds to phosphorylated serine on a variety of signaling molecules (Berg et al. 2003; Ubl et al. 2002). The 14-3-3 proteins are most abundantly expressed in the brain, are important for cell survival and have an inhibitory effect on apoptosis. Most of the 14-3-3 isoform proteins act as chaperones, and control the subcellular localization of the binding partners. Upon binding, they target them to their protein partners, and stimulate protein–protein interactions with other signaling proteins. 14-3-3 proteins have been shown to play a role in various physiological cellular processes such as signaling, cell growth, division, adhesion, differentiation, apoptosis, cell survival and regulation of ion channels. More than 100 binding partners for 14-3-3 proteins have been discovered, including proteins that are associated with dopaminergic degeneration such as apoptotic cell signaling proteins, BAD, Bcl-2, Bax, protein kinases, TH and DAT (Ostrerova et al. 1999). In this study, we observed a down-regulation of YWHAH (z-ratio = −2.9) by microarray analysis (Table 2), indicating that loss of the chaperone activity of YWHAH may play a role in oxidative signaling underlying oxidative damage in dopaminergic neurons.
4.16. Functional significance of oxidative stress and gene expression profiles
In recent years, studies have reported gene expression profiles for MPTP- and oxidative stress-induced dopaminergic cell death in animal and cell culture models of Parkinson’s disease; however, no consistent gene expression patterns have been identified by these studies (Bassilana et al. 2005; Bonin et al. 2004; Chun et al. 2001; Conn et al. 2002; Duke et al. 2006; Grunblatt et al. 2004; Grunblatt et al. 2001; Holtz and O’Malley 2003; Kuhn et al. 2003; Mandel et al. 2003b; Mandel et al. 2003c; Miller et al. 2004; Miller and Federoff 2006; Napolitano et al. 2002; Xu et al. 2005; Yoo et al. 2004; Youdim 2003; Youdim et al. 2002). The different results obtained from profiling gene expression in dopaminergic cells or regions could be attributed to differences in model systems, microarray templates, time, doses and dopaminergic toxins used. However, a pattern of affected genes with specific functions has emerged in several studies. In general, the affected genes participate in iron regulation, MAP kinases signaling, chaperone activity, mitochondrial dysfunction, nuclear proteins associated with chromatin structure, DNA-repair enzymes, impairment of the ubiquitination and proteasomal degradation system and DNA-repair enzymes. Our studies are in line with these findings, suggesting that the H2O2-induced alterations in the dopaminergic cell line studied resulted in altered expression of both pro- and anti-apoptotic proteins, mitochondrially-related proteins, transcription factors including heme-binding transcription factors, proteins associated with proteasomal degradation, molecular chaperones, MAP kinases, (tyrosine kinases, phosphatases) and nuclear proteins associated with chromatin structure, and DNA-repair enzymes. The combined effect of changes in different gene cascades may set the stage for the development and progression of apoptosis in dopaminergic neurons during oxidative insult.
In conclusion, we demonstrate that dopaminergic mesencephalic cells (N27) are more sensitive to oxidative stress-induced apoptotic cell death as compared to GABAergic striatal cells or hippocampal cells. The observed differences in susceptibility of these three cell lines to H2O2 cannot be exclusively attributed to immortalization procedures or species differences, because previous studies have shown that oxidative stress-mediated cell death mechanisms are very similar in dopaminergic cell lines that have been derived from different species and immortalized by different procedures, i.e., the rat N27 cell line (Kaul et al. 2003), the mouse MN9D cell line (Choi et al. 1999; Nicotra and Parvez 2002), and human SH-SY5Y cells (Gomez et al. 2001). The neurochemical properties of these cells may account for the differential sensitivity to oxidative damage. In particular, dopamine-containing neuronal cells show enhanced susceptibility to oxidative damage (Kweon et al. 2004; Kitazawa et al. 2002). Together with our previous findings, we have shown that mitochondrial dysfunction, induction of anti- and pro-apoptotic factors, and in particular, caspase-3-induced proteolytic activation of PKCδ, all mediate H2O2-induced apoptotic cell death in N27 cells. Furthermore, these results occurred in the same population of cells that were used for microarray experiments. Thus, the gene expression changes measured in microarray are occurring simultaneously with the apoptotic cell death events. Future studies should compare differential gene expression in the M213-20 striatal cell line and the N27 mesencephalic cell line to elucidate the molecular mechanisms underlying cell type-specific oxidative damage.
By employing microarray, RT-PCR and Western blotting analysis, we have identified several oxidative stress-regulated genes associated with specific cellular functions in the dopaminergic N27 cell line. While the picture of gene regulation in PD is far from complete, further functional characterization of the affected genes and their protein products may provide insights into the molecular pathological mechanisms associated with oxidative stress-induced dopaminergic degeneration. Inclusion of comparative gene expression profiling analysis of in vitro and in vivo neurotoxic and transgenic PD models also greatly aid in identifying key pathways associated with the neurodegenerative process in PD. This information will ultimately lead to novel molecular drug targets for intervention in the oxidative stress-induced dopaminergic cell loss observed in Parkinson’s disease as well as in other neurodegenerative disorders, including cerebral ischemia, amytrophic lateral sclerosis and even certain types of drug abuse-related neurotoxic conditions, in which oxidative stress contributes significantly to the disease etiology, process and/or outcome (Cadet et al. 2003; Imam et al. 2002; Jayanthi et al. 2004).
Acknowledgments
This study was supported by NIH grants NS 45133, ES 10586, NS 386644 and the Intramural Research Programs of the NIDA and the NIA, NIH, DHHS. The authors also gratefully acknowledge Mr. William H. Wood, GEGU, NIA IRP, NIH, DHHS and Dr. Siddharth Kaul for their technical assistance.
Footnotes
Publisher's Disclaimer: This is a PDF file of an unedited manuscript that has been accepted for publication. As a service to our customers we are providing this early version of the manuscript. The manuscript will undergo copyediting, typesetting, and review of the resulting proof before it is published in its final citable form. Please note that during the production process errors may be discovered which could affect the content, and all legal disclaimers that apply to the journal pertain.
References
- Abou-Sleiman PM, Muqit MM, Wood NW. Expanding insights of mitochondrial dysfunction in Parkinson’s disease. Nat Rev Neurosci. 2006;7(3):207–219. doi: 10.1038/nrn1868. [DOI] [PubMed] [Google Scholar]
- Aguirre D, Boya P, Bellet D, Faivre S, Troalen F, Benard J, Saulnier P, Hopkins-Donaldson S, Zangemeister-Wittke U, Kroemer G, Raymond E. Bcl-2 and CCND1/CDK4 expression levels predict the cellular effects of mTOR inhibitors in human ovarian carcinoma. Apoptosis. 2004;9(6):797–805. doi: 10.1023/B:APPT.0000045781.46314.e2. [DOI] [PubMed] [Google Scholar]
- Anantharam V, Kitazawa M, Wagner J, Kaul S, Kanthasamy AG. Caspase-3-dependent proteolytic cleavage of protein kinase Cdelta is essential for oxidative stress-mediated dopaminergic cell death after exposure to methylcyclopentadienyl manganese tricarbonyl. J Neurosci. 2002;22(5):1738–1751. doi: 10.1523/JNEUROSCI.22-05-01738.2002. [DOI] [PMC free article] [PubMed] [Google Scholar]
- Ardley HC, Scott GB, Rose SA, Tan NG, Robinson PA. UCH-L1 aggresome formation in response to proteasome impairment indicates a role in inclusion formation in Parkinson’s disease. J Neurochem. 2004;90(2):379–391. doi: 10.1111/j.1471-4159.2004.02485.x. [DOI] [PubMed] [Google Scholar]
- Baskiewicz-Masiuk M, Machalinski B. The role of the STAT5 proteins in the proliferation and apoptosis of the CML and AML cells. Eur J Haematol. 2004;72(6):420–429. doi: 10.1111/j.1600-0609.2004.00242.x. [DOI] [PubMed] [Google Scholar]
- Bassilana F, Mace N, Li Q, Stutzmann JM, Gross CE, Pradier L, Benavides J, Menager J, Bezard E. Unraveling substantia nigra sequential gene expression in a progressive MPTP-lesioned macaque model of Parkinson’s disease. Neurobiol Dis. 2005;20(1):93–103. doi: 10.1016/j.nbd.2005.02.005. [DOI] [PubMed] [Google Scholar]
- Beal MF. Mitochondria take center stage in aging and neurodegeneration. Ann Neurol. 2005;58(4):495–505. doi: 10.1002/ana.20624. [DOI] [PubMed] [Google Scholar]
- Berg D, Holzmann C, Riess O. 14-3-3 proteins in the nervous system. Nat Rev Neurosci. 2003;4(9):752–762. doi: 10.1038/nrn1197. [DOI] [PubMed] [Google Scholar]
- Bolton EC, Boeke JD. Transcriptional interactions between yeast tRNA genes, flanking genes and Ty elements: a genomic point of view. Genome Res. 2003;13(2):254–263. doi: 10.1101/gr.612203. [DOI] [PMC free article] [PubMed] [Google Scholar]
- Bonin M, Poths S, Osaka H, Wang YL, Wada K, Riess O. Microarray expression analysis of gad mice implicates involvement of Parkinson’s disease associated UCH-L1 in multiple metabolic pathways. Brain Res Mol Brain Res. 2004;126(1):88–97. doi: 10.1016/j.molbrainres.2004.03.025. [DOI] [PubMed] [Google Scholar]
- Bossy-Wetzel E, Schwarzenbacher R, Lipton SA. Molecular pathways to neurodegeneration. Nat Med. 2004;(10 Suppl):S2–9. doi: 10.1038/nm1067. [DOI] [PubMed] [Google Scholar]
- Cadet JL, Jayanthi S, Deng X. Speed kills: cellular and molecular bases of methamphetamine-induced nerve terminal degeneration and neuronal apoptosis. Faseb J. 2003;17(13):1775–1788. doi: 10.1096/fj.03-0073rev. [DOI] [PubMed] [Google Scholar]
- Cairns NJ, Lee VM, Trojanowski JQ. The cytoskeleton in neurodegenerative diseases. J Pathol. 2004;204(4):438–449. doi: 10.1002/path.1650. [DOI] [PMC free article] [PubMed] [Google Scholar]
- Cheadle C, Vawter MP, Freed WJ, Becker KG. Analysis of microarray data using Z score transformation. J Mol Diagn. 2003;5(2):73–81. doi: 10.1016/S1525-1578(10)60455-2. [DOI] [PMC free article] [PubMed] [Google Scholar]
- Choi WS, Canzoniero LM, Sensi SL, O’Malley KL, Gwag BJ, Sohn S, Kim JE, Oh TH, Lee EB, Oh YJ. Characterization of MPP(+)-induced cell death in a dopaminergic neuronal cell line: role of macromolecule synthesis, cytosolic calcium, caspase, and Bcl-2-related proteins. Exp Neurol. 1999;159(1):274–282. doi: 10.1006/exnr.1999.7133. [DOI] [PubMed] [Google Scholar]
- Chun HS, Gibson GE, DeGiorgio LA, Zhang H, Kidd VJ, Son JH. Dopaminergic cell death induced by MPP(+), oxidant and specific neurotoxicants shares the common molecular mechanism. J Neurochem. 2001;76(4):1010–1021. doi: 10.1046/j.1471-4159.2001.00096.x. [DOI] [PubMed] [Google Scholar]
- Conn KJ, Gao WW, Ullman MD, McKeon-O’Malley C, Eisenhauer PB, Fine RE, Wells JM. Specific up-regulation of GADD153/CHOP in 1-methyl-4-phenyl-pyridinium-treated SH-SY5Y cells. J Neurosci Res. 2002;68(6):755–760. doi: 10.1002/jnr.10252. [DOI] [PubMed] [Google Scholar]
- Crow MT. Hypoxia, BNip3 proteins, and the mitochondrial death pathway in cardiomyocytes. Circ Res. 2002;91(3):183–185. doi: 10.1161/01.res.0000030195.38795.cf. [DOI] [PubMed] [Google Scholar]
- Dangond F, Hwang D, Camelo S, Pasinelli P, Frosch MP, Stephanopoulos G, Brown RH, Jr, Gullans SR. Molecular signature of late-stage human ALS revealed by expression profiling of postmortem spinal cord gray matter. Physiol Genomics. 2004;16(2):229–239. doi: 10.1152/physiolgenomics.00087.2001. [DOI] [PubMed] [Google Scholar]
- Dawson TM, Dawson VL. Molecular pathways of neurodegeneration in Parkinson’s disease. Science. 2003;302(5646):819–822. doi: 10.1126/science.1087753. [DOI] [PubMed] [Google Scholar]
- Devries TA, Kalkofen RL, Matassa AA, Reyland ME. Protein Kinase C{delta} Regulates Apoptosis via Activation of STAT1. J Biol Chem. 2004;279(44):45603–45612. doi: 10.1074/jbc.M407448200. [DOI] [PubMed] [Google Scholar]
- Duke DC, Moran LB, Kalaitzakis ME, Deprez M, Dexter DT, Pearce RK, Graeber MB. Transcriptome analysis reveals link between proteasomal and mitochondrial pathways in Parkinson’s disease. Neurogenetics. 2006;7(3):139–148. doi: 10.1007/s10048-006-0033-5. [DOI] [PubMed] [Google Scholar]
- Forman MS, Trojanowski JQ, Lee VM. Neurodegenerative diseases: a decade of discoveries paves the way for therapeutic breakthroughs. Nat Med. 2004;10(10):1055–1063. doi: 10.1038/nm1113. [DOI] [PubMed] [Google Scholar]
- Gerber DJ, Hall D, Miyakawa T, Demars S, Gogos JA, Karayiorgou M, Tonegawa S. Evidence for association of schizophrenia with genetic variation in the 8p21.3 gene, PPP3CC, encoding the calcineurin gamma subunit. Proc Natl Acad Sci U S A. 2003;100(15):8993–8998. doi: 10.1073/pnas.1432927100. [DOI] [PMC free article] [PubMed] [Google Scholar]
- Giatromanolaki A, Koukourakis MI, Sowter HM, Sivridis E, Gibson S, Gatter KC, Harris AL. BNIP3 expression is linked with hypoxia-regulated protein expression and with poor prognosis in non-small cell lung cancer. Clin Cancer Res. 2004;10(16):5566–5571. doi: 10.1158/1078-0432.CCR-04-0076. [DOI] [PubMed] [Google Scholar]
- Gilles-Gonzalez MA, Gonzalez G. Signal transduction by heme-containing PAS-domain proteins. J Appl Physiol. 2004;96(2):774–783. doi: 10.1152/japplphysiol.00941.2003. [DOI] [PubMed] [Google Scholar]
- Giordano M, Takashima H, Herranz A, Poltorak M, Geller HM, Marone M, Freed WJ. Immortalized GABAergic cell lines derived from rat striatum using a temperature-sensitive allele of the SV40 large T antigen. Exp Neurol. 1993;124(2):395–400. doi: 10.1006/exnr.1993.1213. [DOI] [PubMed] [Google Scholar]
- Gomez C, Reiriz J, Pique M, Gil J, Ferrer I, Ambrosio S. Low concentrations of 1-methyl-4-phenylpyridinium ion induce caspase-mediated apoptosis in human SH-SY5Y neuroblastoma cells. J Neurosci Res. 2001;63(5):421–428. doi: 10.1002/1097-4547(20010301)63:5<421::AID-JNR1037>3.0.CO;2-4. [DOI] [PubMed] [Google Scholar]
- Graham RM, Frazier DP, Thompson JW, Haliko S, Li H, Wasserlauf BJ, Spiga MG, Bishopric NH, Webster KA. A unique pathway of cardiac myocyte death caused by hypoxia-acidosis. J Exp Biol. 2004;207(Pt 18):3189–3200. doi: 10.1242/jeb.01109. [DOI] [PubMed] [Google Scholar]
- Greenamyre JT, Hastings TG. Biomedicine. Parkinson’s--divergent causes, convergent mechanisms. Science. 2004;304(5674):1120–1122. doi: 10.1126/science.1098966. [DOI] [PubMed] [Google Scholar]
- Grunblatt E, Mandel S, Jacob-Hirsch J, Zeligson S, Amariglo N, Rechavi G, Li J, Ravid R, Roggendorf W, Riederer P, Youdim MB. Gene expression profiling of parkinsonian substantia nigra pars compacta; alterations in ubiquitin-proteasome, heat shock protein, iron and oxidative stress regulated proteins, cell adhesion/cellular matrix and vesicle trafficking genes. J Neural Transm. 2004;111(12):1543–1573. doi: 10.1007/s00702-004-0212-1. [DOI] [PubMed] [Google Scholar]
- Grunblatt E, Mandel S, Maor G, Youdim MB. Gene expression analysis in N-methyl-4-phenyl-1,2,3,6-tetrahydropyridine mice model of Parkinson’s disease using cDNA microarray: effect of R-apomorphine. J Neurochem. 2001;78(1):1–12. doi: 10.1046/j.1471-4159.2001.00397.x. [DOI] [PubMed] [Google Scholar]
- Grunewald T, Beal MF. NOS knockouts and neuroprotection. Nat Med. 1999;5(12):1354–1355. doi: 10.1038/70918. [DOI] [PubMed] [Google Scholar]
- Hattori N, Mizuno Y. Pathogenetic mechanisms of parkin in Parkinson’s disease. Lancet. 2004;364(9435):722–724. doi: 10.1016/S0140-6736(04)16901-8. [DOI] [PubMed] [Google Scholar]
- Holtz WA, O’Malley KL. Parkinsonian mimetics induce aspects of unfolded protein response in death of dopaminergic neurons. J Biol Chem. 2003;278(21):19367–19377. doi: 10.1074/jbc.M211821200. [DOI] [PubMed] [Google Scholar]
- Hur J, Chesnes J, Coser KR, Lee RS, Geck P, Isselbacher KJ, Shioda T. The Bik BH3-only protein is induced in estrogen-starved and antiestrogen-exposed breast cancer cells and provokes apoptosis. Proc Natl Acad Sci U S A. 2004;101(8):2351–2356. doi: 10.1073/pnas.0307337101. [DOI] [PMC free article] [PubMed] [Google Scholar]
- Imam SZ, Newport GD, Duhart HM, Islam F, Slikker W, Jr, Ali SF. Methamphetamine-induced dopaminergic neurotoxicity and production of peroxynitrite are potentiated in nerve growth factor differentiated pheochromocytoma 12 cells. Ann N Y Acad Sci. 2002;965:204–213. doi: 10.1111/j.1749-6632.2002.tb04162.x. [DOI] [PubMed] [Google Scholar]
- Jayanthi S, Deng X, Noailles PA, Ladenheim B, Cadet JL. Methamphetamine induces neuronal apoptosis via cross-talks between endoplasmic reticulum and mitochondria-dependent death cascades. Faseb J. 2004;18(2):238–251. doi: 10.1096/fj.03-0295com. [DOI] [PubMed] [Google Scholar]
- Jenner P. Oxidative stress in Parkinson’s disease. Ann Neurol. 2003;53(Suppl 3):S26–36. doi: 10.1002/ana.10483. discussion S36–28. [DOI] [PubMed] [Google Scholar]
- Johnstone RW, Tommerup N, Hansen C, Vissing H, Shi Y. Mapping of the human PAWR (par-4) gene to chromosome 12q21. Genomics. 1998;53(2):241–243. doi: 10.1006/geno.1998.5494. [DOI] [PubMed] [Google Scholar]
- Kanthasamy AG, Kitazawa M, Kanthasamy A, Anantharam V. Role of proteolytic activation of protein kinase Cdelta in oxidative stress-induced apoptosis. Antioxid Redox Signal. 2003;5(5):609–620. doi: 10.1089/152308603770310275. [DOI] [PubMed] [Google Scholar]
- Kaul S, Anantharam V, Kanthasamy A, Kanthasamy AG. Wild-type alpha-synuclein interacts with pro-apoptotic proteins PKCdelta and BAD to protect dopaminergic neuronal cells against MPP+-induced apoptotic cell death. Brain Res Mol Brain Res. 2005;139(1):137–152. doi: 10.1016/j.molbrainres.2005.05.022. [DOI] [PubMed] [Google Scholar]
- Kaul S, Kanthasamy A, Kitazawa M, Anantharam V, Kanthasamy AG. Caspase-3 dependent proteolytic activation of protein kinase C delta mediates and regulates 1-methyl-4-phenylpyridinium (MPP+)-induced apoptotic cell death in dopaminergic cells: relevance to oxidative stress in dopaminergic degeneration. Eur J Neurosci. 2003;18(6):1387–1401. doi: 10.1046/j.1460-9568.2003.02864.x. [DOI] [PubMed] [Google Scholar]
- Kitazawa M, Wagner JR, Kirby ML, Anantharam V, Kanthasamy AG. Oxidative stress and mitochondrial-mediated apoptosis in dopaminergic cells exposed to methylcyclopentadienyl manganese tricarbonyl. J Pharmacol Exp Ther. 2002;302:26–35. doi: 10.1124/jpet.302.1.26. [DOI] [PubMed] [Google Scholar]
- Kitazawa M, Anantharam V, Kanthasamy AG. Dieldrin induces apoptosis by promoting caspase-3-dependent proteolytic cleavage of protein kinase Cdelta in dopaminergic cells: relevance to oxidative stress and dopaminergic degeneration. Neuroscience. 2003;119(4):945–964. doi: 10.1016/s0306-4522(03)00226-4. [DOI] [PubMed] [Google Scholar]
- Kuhn K, Wellen J, Link N, Maskri L, Lubbert H, Stichel CC. The mouse MPTP model: gene expression changes in dopaminergic neurons. Eur J Neurosci. 2003;17(1):1–12. doi: 10.1046/j.1460-9568.2003.02408.x. [DOI] [PubMed] [Google Scholar]
- Kweon GR, Marks JD, Krencik R, Leung EH, Schumacker PT, Hyland K, Kang UJ. Distinct mechanisms of neurodegeneration induced by chronic complex I inhibition in dopaminergic and non-dopaminergic cells. J Biol Chem. 2004;279(50):51783–51792. doi: 10.1074/jbc.M407336200. [DOI] [PubMed] [Google Scholar]
- Lehrmann E, Hyde TM, Vawter MP, Becker KG, Kleinman JE, Freed WJ. The use of microarrays to characterize neuropsychiatric disorders: postmortem studies of substance abuse and schizophrenia. Curr Mol Med. 2003;3(5):437–446. doi: 10.2174/1566524033479690. [DOI] [PubMed] [Google Scholar]
- Mandel S, Grunblatt E, Riederer P, Gerlach M, Levites Y, Youdim MB. Neuroprotective strategies in Parkinson’s disease : an update on progress. CNS Drugs. 2003a;17(10):729–762. doi: 10.2165/00023210-200317100-00004. [DOI] [PubMed] [Google Scholar]
- Mandel S, Grunblatt E, Riederer P, Youdim MB. Genes and oxidative stress in parkinsonism: cDNA microarray studies. Adv Neurol. 2003b;91:123–132. [PubMed] [Google Scholar]
- Mandel S, Weinreb O, Youdim MB. Using cDNA microarray to assess Parkinson’s disease models and the effects of neuroprotective drugs. Trends Pharmacol Sci. 2003c;24(4):184–191. doi: 10.1016/S0165-6147(03)00067-1. [DOI] [PubMed] [Google Scholar]
- Merghoub T, Gurrieri C, Piazza F, Pandolfi PP. Modeling acute promyelocytic leukemia in the mouse: new insights in the pathogenesis of human leukemias. Blood Cells Mol Dis. 2001;27(1):231–248. doi: 10.1006/bcmd.2001.0385. [DOI] [PubMed] [Google Scholar]
- Miller RM, Callahan LM, Casaceli C, Chen L, Kiser GL, Chui B, Kaysser-Kranich TM, Sendera TJ, Palaniappan C, Federoff HJ. Dysregulation of gene expression in the 1-methyl-4-phenyl-1,2,3,6-tetrahydropyridine-lesioned mouse substantia nigra. J Neurosci. 2004;24(34):7445–7454. doi: 10.1523/JNEUROSCI.4204-03.2004. [DOI] [PMC free article] [PubMed] [Google Scholar]
- Miller RM, Federoff HJ. Microarrays in Parkinson’s disease: a systematic approach. NeuroRx. 2006;3(3):319–326. doi: 10.1016/j.nurx.2006.05.008. [DOI] [PMC free article] [PubMed] [Google Scholar]
- Moore DJ, West AB, Dawson VL, Dawson TM. Molecular pathophysiology of Parkinson’s disease. Annu Rev Neurosci. 2005;28:57–87. doi: 10.1146/annurev.neuro.28.061604.135718. [DOI] [PubMed] [Google Scholar]
- Moscat J, Diaz-Meco MT. Par-4 keeps the atypical PKCs at bay. Cell Cycle. 2003;2(2):71–72. [PubMed] [Google Scholar]
- Napolitano M, Centonze D, Calce A, Picconi B, Spiezia S, Gulino A, Bernardi G, Calabresi P. Experimental parkinsonism modulates multiple genes involved in the transduction of dopaminergic signals in the striatum. Neurobiol Dis. 2002;10(3):387–395. doi: 10.1006/nbdi.2002.0525. [DOI] [PubMed] [Google Scholar]
- Nesic O, Svrakic NM, Xu GY, McAdoo D, Westlund KN, Hulsebosch CE, Ye Z, Galante A, Soteropoulos P, Tolias P, Young W, Hart RP, Perez-Polo JR. DNA microarray analysis of the contused spinal cord: effect of NMDA receptor inhibition. J Neurosci Res. 2002;68(4):406–423. doi: 10.1002/jnr.10171. [DOI] [PubMed] [Google Scholar]
- Nicotra A, Parvez S. Apoptotic molecules and MPTP-induced cell death. Neurotoxicol Teratol. 2002;24(5):599–605. doi: 10.1016/s0892-0362(02)00213-1. [DOI] [PubMed] [Google Scholar]
- Nishi A, Bibb JA, Matsuyama S, Hamada M, Higashi H, Nairn AC, Greengard P. Regulation of DARPP-32 dephosphorylation at PKA- and Cdk5-sites by NMDA and AMPA receptors: distinct roles of calcineurin and protein phosphatase-2A. J Neurochem. 2002;81(4):832–841. doi: 10.1046/j.1471-4159.2002.00876.x. [DOI] [PubMed] [Google Scholar]
- Ostrerova N, Petrucelli L, Farrer M, Mehta N, Choi P, Hardy J, Wolozin B. alpha-Synuclein shares physical and functional homology with 14-3-3 proteins. J Neurosci. 1999;19(14):5782–5791. doi: 10.1523/JNEUROSCI.19-14-05782.1999. [DOI] [PMC free article] [PubMed] [Google Scholar]
- Pietro RD, Zauli G. Emerging non-apoptotic functions of tumor necrosis factor-related apoptosis-inducing ligand (TRAIL)/Apo2L. J Cell Physiol. 2004;201(3):331–340. doi: 10.1002/jcp.20099. [DOI] [PubMed] [Google Scholar]
- Prasad KN, Clarkson ED, La Rosa FG, Edwards-Prasad J, Freed CR. Efficacy of grafted immortalized dopamine neurons in an animal model of parkinsonism: a review. Mol Genet Metab. 1998;65(1):1–9. doi: 10.1006/mgme.1998.2726. [DOI] [PubMed] [Google Scholar]
- Przedborski S, Vila M. The 1-methyl-4-phenyl-1,2,3,6-tetrahydropyridine mouse model: a tool to explore the pathogenesis of Parkinson’s disease. Ann N Y Acad Sci. 2003;991:189–198. [PubMed] [Google Scholar]
- Ricciarelli R, d’Abramo C, Massone S, Marinari U, Pronzato M, Tabaton M. Microarray analysis in Alzheimer’s disease and normal aging. IUBMB Life. 2004;56(6):349–354. doi: 10.1080/15216540412331286002. [DOI] [PubMed] [Google Scholar]
- Singh JK, Dasgupta A, Adayev T, Shahmehdi SA, Hammond D, Banerjee P. Apoptosis is associated with an increase in saturated fatty acid containing phospholipids in the neuronal cell line, HN2-5. Biochim Biophys Acta. 1996;1304(3):171–178. doi: 10.1016/s0005-2760(96)00134-8. [DOI] [PubMed] [Google Scholar]
- Strack S, Cribbs JT, Gomez L. Critical role for protein phosphatase 2A heterotrimers in mammalian cell survival. J Biol Chem. 2004;279(46):47732–47739. doi: 10.1074/jbc.M408015200. [DOI] [PubMed] [Google Scholar]
- Tan JM, Dawson TM. Parkin blushed by PINK1. Neuron. 2006;50(4):527–529. doi: 10.1016/j.neuron.2006.05.003. [DOI] [PubMed] [Google Scholar]
- Tatton WG, Chalmers-Redman R, Brown D, Tatton N. Apoptosis in Parkinson’s disease: signals for neuronal degradation. Ann Neurol. 2003;53(Suppl 3):S61–70. doi: 10.1002/ana.10489. discussion S70–62. [DOI] [PubMed] [Google Scholar]
- Thomas GM, Huganir RL. MAPK cascade signalling and synaptic plasticity. Nat Rev Neurosci. 2004;5(3):173–183. doi: 10.1038/nrn1346. [DOI] [PubMed] [Google Scholar]
- Ubl A, Berg D, Holzmann C, Kruger R, Berger K, Arzberger T, Bornemann A, Riess O. 14-3-3 protein is a component of Lewy bodies in Parkinson’s disease-mutation analysis and association studies of 14-3-3 eta. Brain Res Mol Brain Res. 2002;108(1–2):33–39. doi: 10.1016/s0169-328x(02)00510-7. [DOI] [PubMed] [Google Scholar]
- Von Bohlen Und Halbach O. Synucleins and their relationship to Parkinson’s disease. Cell Tissue Res. 2004 doi: 10.1007/s00441-004-0921-7. [DOI] [PubMed] [Google Scholar]
- Winter C, Weiss C, Martin-Villalba A, Zimmermann M, Schenkel J. JunB and Bcl-2 overexpression results in protection against cell death of nigral neurons following axotomy. Brain Res Mol Brain Res. 2002;104(2):194–202. doi: 10.1016/s0169-328x(02)00378-9. [DOI] [PubMed] [Google Scholar]
- Wu HY, Tomizawa K, Oda Y, Wei FY, Lu YF, Matsushita M, Li ST, Moriwaki A, Matsui H. Critical role of calpain-mediated cleavage of calcineurin in excitotoxic neurodegeneration. J Biol Chem. 2004;279(6):4929–4940. doi: 10.1074/jbc.M309767200. [DOI] [PubMed] [Google Scholar]
- Xu Z, Cawthon D, McCastlain KA, Slikker W, Jr, Ali SF. Selective alterations of gene expression in mice induced by MPTP. Synapse. 2005;55(1):45–51. doi: 10.1002/syn.20089. [DOI] [PubMed] [Google Scholar]
- Yamashita H, Nishio M, Fujii Y, Iwase H. Dominant-negative Stat5 inhibits growth and induces apoptosis in T47D-derived tumors in nude mice. Cancer Sci. 2004;95(8):662–665. doi: 10.1111/j.1349-7006.2004.tb03326.x. [DOI] [PMC free article] [PubMed] [Google Scholar]
- Yang Y, Kaul S, Zhang D, Anantharam V, Kanthasamy AG. Suppression of caspase-3-dependent proteolytic activation of protein kinase C delta by small interfering RNA prevents MPP+-induced dopaminergic degeneration. Mol Cell Neurosci. 2004;25(3):406–421. doi: 10.1016/j.mcn.2003.11.011. [DOI] [PubMed] [Google Scholar]
- Yoo MS, Kawamata H, Kim DJ, Chun HS, Son JH. Experimental strategy to identify genes susceptible to oxidative stress in nigral dopaminergic neurons. Neurochem Res. 2004;29(6):1223–1234. doi: 10.1023/b:nere.0000023609.08038.c3. [DOI] [PubMed] [Google Scholar]
- Youdim MB. What have we learnt from CDNA microarray gene expression studies about the role of iron in MPTP induced neurodegeneration and Parkinson’s disease? J Neural Transm. 2003;(Suppl 65):73–88. doi: 10.1007/978-3-7091-0643-3_5. [DOI] [PubMed] [Google Scholar]
- Youdim MB, Grunblatt E, Levites Y, Maor G, Mandel S. Early and late molecular events in neurodegeneration and neuroprotection in Parkinson’s disease MPTP model as assessed by cDNA microarray; the role of iron. Neurotox Res. 2002;4(7–8):679–689. doi: 10.1080/1029842021000045507. [DOI] [PubMed] [Google Scholar]
- Zhuang J, Brady HJ. Emerging role of Mcl-1 in actively counteracting BH3-only proteins in apoptosis. Cell Death Differ. 2006;13(8):1263–1267. doi: 10.1038/sj.cdd.4401952. [DOI] [PubMed] [Google Scholar]