

Abstract
Individuals with age-related hearing loss often have difficulty understanding complex sounds such as basic speech. The C57BL/6 mouse suffers from progressive sensorineural hearing loss and thus is an effective tool for dissecting the neural mechanisms underlying changes in complex sound processing observed in humans. Neural mechanisms important for processing complex sounds include multiple tuning and combination sensitivity, and these responses are common in the inferior colliculus (IC) of normal hearing mice. We examined neural responses in the IC of C57Bl/6 mice to single and combinations of tones to examine the extent of spectral integration in the IC after age-related high frequency hearing loss. Ten percent of the neurons were tuned to multiple frequency bands and an additional 10% displayed nonlinear facilitation to the combination of two different tones (combination sensitivity). No combination-sensitive inhibition was observed. By comparing these findings to spectral integration properties in the IC of normal hearing CBA/CaJ mice, we suggest that high frequency hearing loss affects some of the neural mechanisms in the IC that underlie the processing of complex sounds. The loss of spectral integration properties in the IC during aging likely impairs the central auditory system’s ability to process complex sounds such as speech.
Keywords: Inferior colliculus, spectral integration, presbycusis, mouse, hearing
1. Introduction
A fundamental function of the human auditory system is to process speech. This processing is disrupted by age-related hearing loss, and as a consequence individuals who suffer from age-related hearing loss often have difficulty understanding basic speech sounds important in everyday life such that their social and emotional health is impacted (Frisina and Frisina, 1997; Gordon-Salant and Fitzgibbons, 1993; Humes, 1991; Weinstein and Ventry, 1982). A common type of age-related hearing loss occurs at high frequencies and is caused by hair cell degeneration at the basal end of the cochlea (Pichora-Fuller and Souza, 2003; Willott, 1991a). This peripheral hearing loss eliminates evoked activity in high frequency auditory nerve fibers and this translates into loss of sensitivity to high frequencies in central auditory nuclei. Loss of high frequency sensitivity reduces perception of the quality (or timbre) of complex sounds, including speech (de Boer and Dreschler, 1987; Moore, 1993). Although the low frequency elements in the speech sounds are still audible, the decreased sound quality often affects speech understanding (Brant and Fozard, 1990; Frisina and Frisina, 1997; Strickland et al., 1994).
The neural mechanisms underlying deficits in speech understanding with age-related hearing loss are not well understood. While it is obvious that loss of high frequency sensitivity at the periphery eliminates neural responses to high frequency simple sounds (i.e. tones) in the central auditory system, it is unclear how age-related hearing loss affects more complex neural responses such as spectral integration. Because spectral integration is important for the analysis of complex sounds, including species-specific vocalizations (Leroy and Wenstrup, 2000; Portfors, 2004; Portfors and Wenstrup, 2002; Rauschecker et al., 1995), loss of spectral integration properties with high frequency hearing loss may be an underlying neural cause of speech understanding deficits. The purpose of this study was to examine spectral integration properties of single neurons in the auditory midbrain of mice with age-related, high frequency hearing loss.
Spectral integration by single neurons is evidenced by neurons with multiple frequency tuning peaks, enhanced sensitivity to noise, or combination sensitivity; facilitated or enhanced responses to the combination of two distinctly different frequency elements (Brosch et al., 1999; Fuzessery and Feng, 1983; Kadia and Wang, 2003; Ohl and Scheich, 1997; Rauschecker, 1998; Rauschecker et al., 1995; Schreiner and Cynader, 1984; Suga and O’Neill, 1979; Sutter and Schreiner, 1991). Recent evidence suggests that neurons that integrate across frequencies first occur in the inferior colliculus (IC) (Marsh et al., 2006; Portfors and Wenstrup, 2001b; Wenstrup and Leroy, 2001). Multiply tuned and combination-sensitive neurons are found in the IC of both mustached bats (Mittmann and Wenstrup, 1995; Portfors and Wenstrup, 1999; Portfors and Wenstrup, 2001a; Portfors and Wenstrup, 2002) and mice (Portfors and Felix II, 2005).
Combination-sensitive neurons, in particular, underlie the neural selectivity for certain spectral and temporal combinations of elements within species-specific vocalizations. These types of responses support the neurons’ abilities to discriminate among vocalizations (Esser et al., 1997; Margoliash and Fortune, 1992; Ohlemiller et al., 1996; Rauschecker, 1998; Rauschecker et al., 1995). For example, the characteristic frequency and temporal tuning of one type of combination-sensitive neuron in the mustached bat, the “FM-FM” neuron, indicates its importance in echolocation behavior and in particular, the analyses of target distance (Portfors and Wenstrup, 1999; Portfors and Wenstrup, 2004; Suga and O’Neill, 1979). Combination-sensitive neurons in the IC are also involved in encoding social vocalizations in the mustached bat (Portfors, 2004; Portfors and Wenstrup, 2002; Portfors and Sinex, 2005). In processing of speech, combination-sensitive neurons may underlie formant grouping in vowel discrimination (Culling and Darwin, 1993).
We recently found combination-sensitive neurons in the IC of normal hearing mouse (CBA/CaJ strain) (Portfors and Felix II, 2005). Over 25% of the IC neurons showed either combination-sensitive facilitation or inhibition. Moreover, the facilitatory or inhibitory frequency tuning of some of these responses included sensitivity to high frequencies (> 20 kHz). In addition, we found that over 30% of the IC neurons were tuned to more than one frequency band. The majority of these multiply tuned neurons were located in the ventral region of the IC where high frequencies are represented. One excitatory frequency peak was typically in the range of 30–65 kHz, and in most units the second excitatory frequency peak was in the range of 6–20 kHz. The finding that the majority of combination-sensitive and multiply tuned neurons (all suggestive of frequency integration) are sensitive to high frequencies led us to predict that the response properties of these types of neurons will be affected by age-related high frequency hearing loss. We tested this prediction by examining spectral integration properties of neurons in the IC of C57BL/6 mice.
C57BL/6 mice are a model system for progressive sensorineural hearing loss because they experience hair cell degeneration that starts at the basal end of the cochlea and progresses quickly such that by six months of age they show a profound deafness to high frequency sounds (Francis et al., 2003; Henry and Chole, 1980; Mikaelian, 1979). This sensorineural hearing loss is caused by a mutation of the Ahl allele, which disrupts stereocilia organization in the cochlea (Di Palma et al., 2001; Johnson et al., 2000)). The time course for hearing loss in the C57 strain is accelerated compared to humans, but the cochlear pathology is similar (Frisina and Walton, 2001; Henry, 1983). Because the C57 strain is an excellent model for progressive sensorineural hearing loss, many studies have examined changes in temporal processing, frequency organization, frequency tuning curve shapes and spike discharge patterns of neurons in the brainstem, midbrain and cortex of C57 mice (Willott, 1984; Willott, 1986; Willott, 1991a; Willott et al., 1988; Willott et al., 1993).
The most dramatic change in the IC of C57 mice over the age of six months occurs physiologically and is demonstrated by a shift in frequency tuning of neurons in the ventral region (Willott et al., 1988), where high frequencies are represented in normal hearing mice (Stiebler and Ehret, 1985). As the ventral region in the IC loses its high frequency inputs due to the basal cochlear pathology, there is a shift in neural sensitivity from high to low frequencies. Neurons in the ventral region do not become inactive but instead respond to lower frequency sounds and thus respond similarly to neurons located dorsally in the IC. This leads to a reorganization such that low to middle frequencies (<30 kHz) are represented throughout the dorsal-ventral extent of the IC. Thus, the tonotopic map in the IC is altered (Willott et al., 1988). How changes in frequency organization in the IC alter spectral integration properties of individual neurons is not known. The purpose of this study was to examine spectral integration properties in the IC of mice with high frequency hearing loss. We characterized responses of neurons to single tones and combinations of tones to begin to understand the effects of sensorineural hearing loss on the processing of complex sounds. We hypothesized that high frequency hearing loss reduces spectral integration properties in the IC. We found that very few neurons in the IC of C57 mice over the age of 6 months exhibited frequency integration properties; there were few multiply tuned neurons and few combination-sensitive neurons. As multiple tuning and combination sensitivity are response properties important for processing complex sounds such as species-specific vocalizations, the loss of these response properties may underlie some deficits in speech understanding that occur with sensorineural high frequency hearing loss.
2. Material and methods
We recorded single unit responses to tones and combinations of tones in the IC of 20 C57BL/6 mice, aged 6–12 months. Auditory brain stem recordings (ABR) in previous studies showed that by six months C57 mice had lost their sensitivity to high frequencies (Henry and Lepkowski, 1978). By 6 months, not only is sensitivity to high frequencies lost, but tonotopy in the IC has been reorganized (Willott, 1984; Willott, 1986). Thus, we chose the age of our mice based on the results of previous studies and did not measure ABRs for the animals used in this study. However, we confirmed that our animals suffered from sensorineural high frequency hearing loss based on observations of reorganized tonotopy during electrophysiological recordings.
Mice were housed in pairs in standard shoebox cages and kept on a reversed 12 hour light schedule so that the lights were off during the day. Electrophysiological recordings began in the morning to increase the likelihood that recordings of single units were obtained while the animals were in an awake state.
2.1 Surgical procedure
The procedures used in this study were the same as reported in a previous paper (Portfors and Felix II, 2005) One or two days prior to beginning electrophysiological recordings, the mouse was anesthetized with isoflurane gas (IsoFlo, Abbott, North Chicago, IL) to apply a metal pin onto its skull. Once the animal was anesthetized, the skin overlying the skull was reflected laterally and the surface cleaned. A light-weight, hollow metal pin was then glued onto the skull with dental cement (Charisma, Heraeus Kulzer, Armonk, NY). A tungsten ground electrode was implanted into the right cerebral cortex and a small hole (less than 1 mm × 1 mm) was cut in the skull over the IC. After the surgery, a local anesthetic (lidocaine, Teva, Sellersville, PA) and a topical antibiotic (Neosporin) were applied to the open tissue and the animal was returned to its home cage to recover.
2.2 Acoustic stimulation
During the recording sessions, the mouse was placed in a foam restraining device that was molded to the mouse’s body. The pin on the animal’s head was screwed into a bar on the stereotaxic apparatus to hold the head in a fixed position. The stereotaxic apparatus was housed in a heated sound-attenuating chamber. Recording sessions typically lasted 6–8 hours. If the animal struggled excessively during the recording session, it was given a mild sedative (acepromazine, 1 mg/kg i.p.). The administration of acepromazine had no apparent effect on the spontaneous activity or firing rate of neurons in the IC. If the mouse continued to struggle, the recording session was terminated for the day. During the recording session, the experimenter offered the mouse water from a dropper after each electrode penetration, which was typically one hour. Experiments lasted one to three days, with one recording day being most common. Petroleum jelly was used to protect the exposed brain between recording sessions.
Acoustic stimulation and data acquisition were controlled by a PC computer located outside the chamber. Tone burst stimuli (50 ms duration, 0.5 ms rise-fall time, 3–4/sec) were generated with custom-written algorithms and output through a high speed, 16-bit digital-to-analog converter (Microstar Labs; 400,000 samples/s). Signals were fed to a programmable attenuator (Tucker Davis Technologies, model PA5), a power amplifier (Parasound, model HCA-1000) and a tweeter speaker (Infinity). The speaker was placed 10 cm away from the mouse and 25° into the sound field contralateral to the IC under study. Acoustic properties of the entire system were regularly calibrated by a ¼“ condenser microphone (Brüel & Kjær model 4135) located at the normal position of the mouse’s ear. An average decrease of 2.7 dB per 10 kHz from 6–100 kHz was present. Second and third harmonic distortion components in the speaker output were not detectable 55 dB below the signal level, as measured by custom-written software that performed a fast Fourier transform of the digitized microphone signal. The duration of tonal stimuli was typically 50 ms. However, some neurons responded best to shorter tones, and for these units, the duration of excitatory tones was adjusted accordingly. A stimulus rise-fall time of 0.5 ms was used because some units exhibited tuning to durations under 10 ms. The short rise-fall time did not produce spectral splatter, as confirmed by fast Fourier analysis of the tone burst stimuli.
2.3 Recording procedures and data collection
Single unit responses were recorded with micropipette electrodes filled with 1 M NaCl (10–20 MΩ resistance). Electrodes were advanced by a hydraulic micropositioner (David Kopf Instruments, model 650) located outside the sound-attenuating chamber. Action potentials were amplified (Dagan, model 2400), sent through a band-pass-filter (Krohn-Hite, model 3364) and a spike enhancer (FHC). The signals were digitized by a 16-bit analog-to-digital converter (Microstar Labs, 10,000 samples/s). Individual neural waveforms were displayed and archived using custom-written C++ software. The software displayed raster plots, post-stimulus time histograms (PSTHs), and statistics on-line. Spike discrimination, spike enhancement, and time-window analysis parameters could be altered offline to analyze stored raw waveforms. Raster and PSTH data as well as latencies were output in ASCII format for further data analysis using custom written IGORPro programs.
Well-isolated single unit responses were recorded in dorsal to ventral penetrations through the central nucleus of the IC. We first collected spikes elicited from single tone burst stimuli presented across multiple frequencies and intensities to characterize excitatory frequency response areas. We varied the frequency of the tone between 6 and 60 kHz in 1–2 kHz steps and varied the intensity in 20 dB steps, beginning at 10 dB above threshold. We used intensity steps of 20 dB so that we could calculate standard sharpness of tuning values of Q10, Q30 and Q50 and still be able to record from the single unit long enough to complete 5–10 repetitions of all the frequency values as well as conduct the two-tone test described below. Spike counts were obtained across the entire 100 ms window. At the start of each test, 5–10 repetitions without a stimulus were obtained to calculate spontaneous activity. If spontaneous activity was present, this spike count was subtracted from the sound-evoked spike counts. Characteristic frequencies (CF) and minimum thresholds (MT) for excitatory responses were determined audiovisually and confirmed by frequency tuning tests. We defined CF as the frequency requiring the lowest intensity to elicit stimulus-locked spikes to 50% of the presentations, and MT as the lowest intensity that elicited a consistent spike response.
Sharpness of frequency tuning was determined from the tuning curves by calculating standard values of Q10, Q30 and Q50 dB. Temporal discharge patterns and median first spike latencies at 30 dB above threshold were obtained from PSTHs and raster plots. Multiply tuned neurons were classified as those having two or more excitatory tuning curves that remained separate at the highest intensity tested (usually 70–80 dB). For neurons with tuning to multiple frequencies, we determined the peak frequency response and threshold for each frequency tuning curve. We obtained all data outlined above for each frequency tuning curve of multiply tuned neurons.
To characterize facilitatory and inhibitory frequency response areas, we used a two-tone stimulation paradigm (Kanwal et al., 1999; Portfors and Wenstrup, 2002; Portfors and Felix II, 2005). One tone was presented at the unit’s CF at 10 dB above threshold to elicit a consistent response. The second tone was presented simultaneously and was varied in frequency (between 6–60 kHz in steps of 1–2 kHz) and intensity (10–20 dB steps). The two tones always had the same duration and onset time. Each two-tone pair was presented 5–10 times. Spontaneous activity was measured prior to each test by recording activity in the absence of stimuli. Spike counts (minus spontaneous activity) elicited by each tone alone and the combination were compared to determine whether any two-tone frequency pairing resulted in a non-linear increase or decrease in response magnitude. Frequencies of the second tone that caused a 20% or greater increase or decrease from the summed response to the two tones were plotted as facilitatory or inhibitory frequency response areas, respectively. The best frequency of the facilitation or inhibition was determined and used to quantify the strength of the interaction. The strength of the facilitation or inhibition was quantified by calculating an “interaction index”, defined as (Rc−R1−R2)/(Rc+R1+R2), where Rc, R1 and R2 are neuron’s responses to the combination of both tones, the first tone presented alone and the second tone presented alone, respectively. An interaction index of 0.09 corresponds to a 20% increase above the summed responses to the two tones presented separately and was the criterion for classifying a neuron as facilitatory.
Interaction index values were calculated for inhibitory responses if the second tone that caused suppression of the excitatory tone was more than an octave away of the unit’s CF. An interaction index value of −1.0 indicated the strongest possible inhibition, and a neuron was considered to have a “combination-sensitive” inhibitory interaction if the interaction index value was less than −0.11 (a 20% decrease of the summed responses to the two tones). Inhibitory frequency response areas within one octave of the CF were classified as sideband inhibition.
To characterize excitatory and inhibitory response areas for neurons we used the quantification scheme of Egorova et al. (2001). Quantitative measures for response types included the thresholds for excitatory and inhibitory areas of response maps, steepness of the slopes for the excitatory tuning curves on both the low and high frequency sides, and sharpness of tuning based on Q values. The four classes are described in the Results and shown in Figures 2–4.
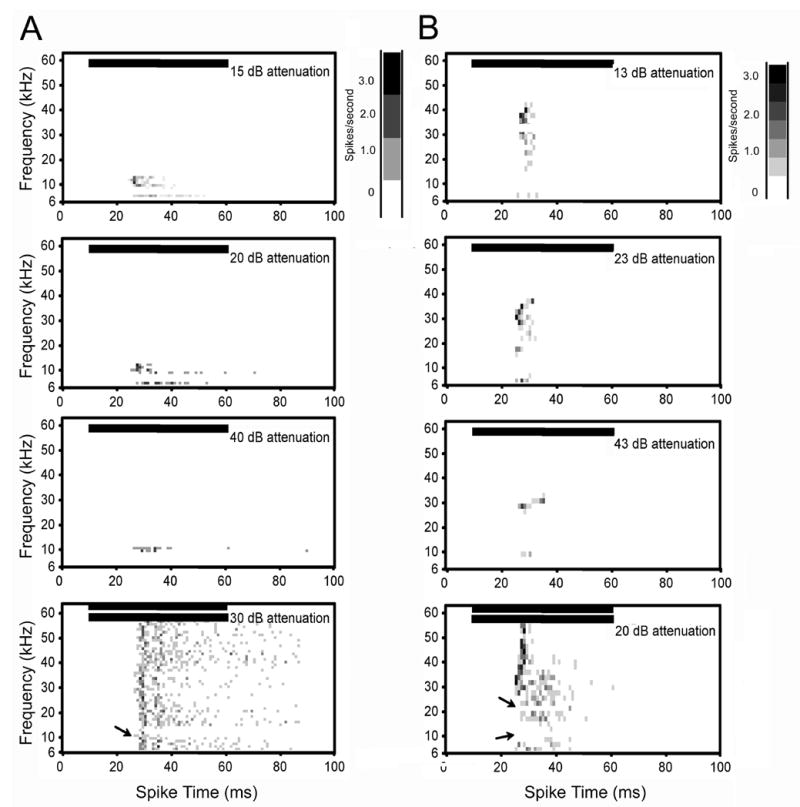
Figure 2.
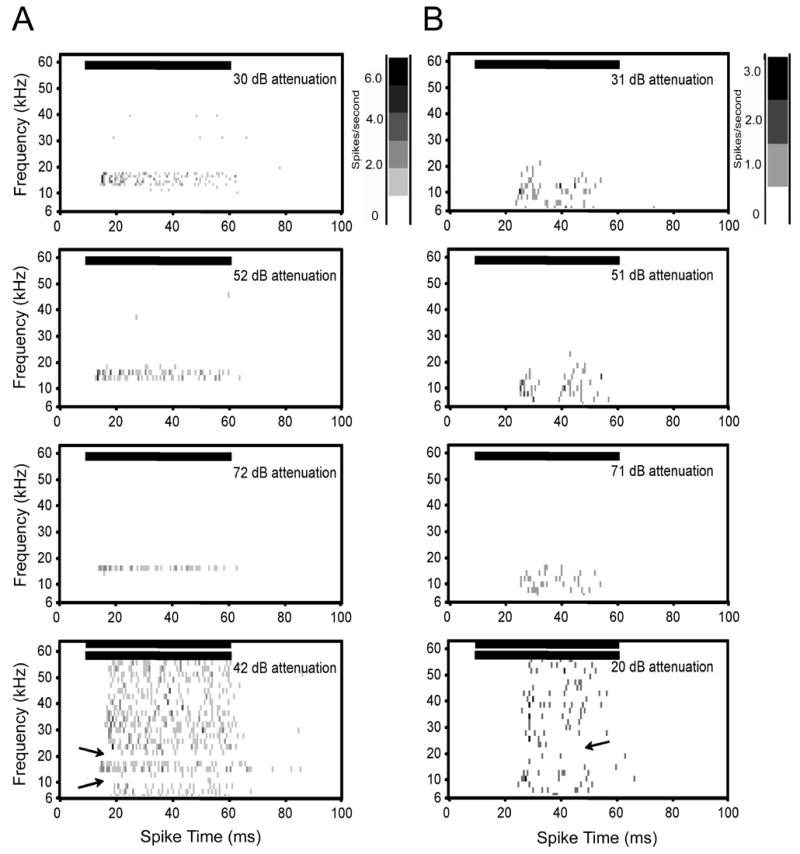
Spectral-temporal histograms of two class I neurons. In this type of plot, both frequency and temporal information is retained with time on the x-axis and frequency of sound stimulation on the y-axis. For each plot, each row represents the PSTH for the corresponding frequency and shading of each square in the matrix represents spike rate. The shaded bar designates the measured neuronal firing rate in each bin (bin size is 1 ms) in spikes/s. Class I neurons were characterized by a steep slope on the high frequency side of CF and a broadening of the response area with increased intensity on the low frequency side of CF. Because of inconsistencies in the speaker output (dB SPL) across the frequencies tested (6–60 kHz), intensities are expressed as dB attenuation. A: Single unit with a CF of 18 kHz and a threshold of 18 dB SPL. Increasing sound intensity broadened the frequency response area below 18 kHz (first four rows). The arrows in the plot in the bottom row show inhibition on the high and low frequency sides of CF. This plot was generated using a two-tone paradigm where a CF tone was held at 10 dB above threshold and a second tone was varied in frequency and intensity. The CF tone elicited a consistent spike rate from the unit, allowing inhibition due to the second tone to be seen. The y-axis in the two-tone plot shows the frequency of the second tone. For clarity only one intensity value of the second tone is shown. B. Single unit with a CF of 12 kHz and a threshold of 16 dB SPL. In this neuron, inhibition was only present on the high frequency side of CF (arrows in bottom row plot). Horizontal bars in each plot show the onset and duration of the stimulus. Bin width for all plots is 1 ms.
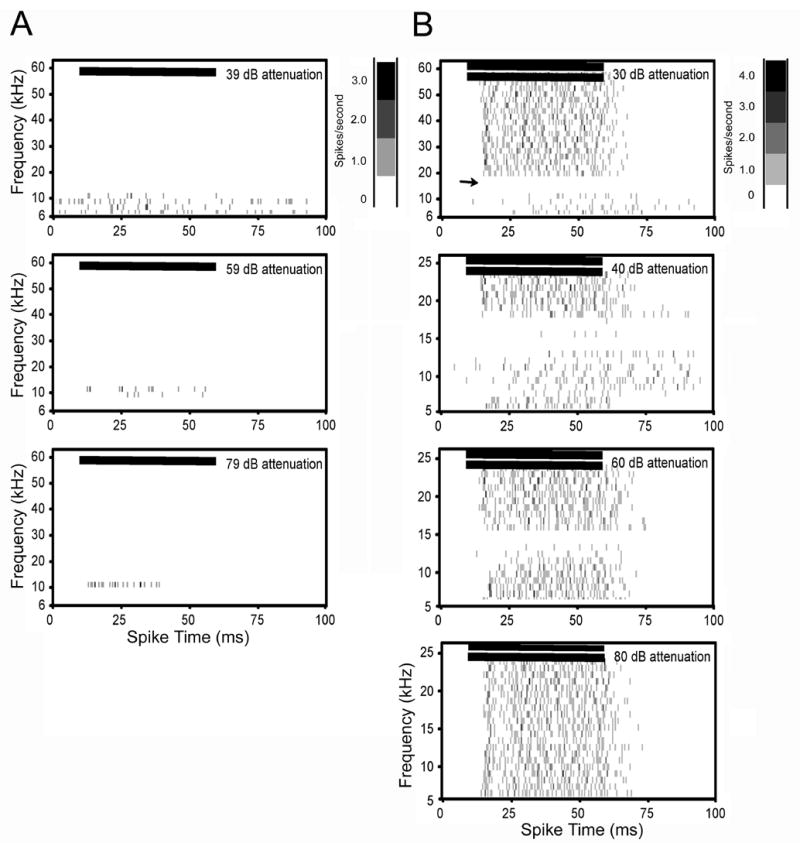
Figure 4.
Spectral temporal plot of a class III neuron. Class III neurons were characterized by symmetrical V-shaped excitatory tuning that broadened with increasing intensity. The single unit in this figure had a CF of 18kHz and a threshold of 41 dB SPL. It had an onset response and its excitatory response area broadened on the high and low frequency side with increased intensity (top 3 plots). The two-tone test (bottom plot) showed that there was no side band inhibition. Horizontal bars in each plot show the onset and duration of the stimulus. Bin width for all plots is 1 ms. See figure 2 legend for additional details on spectral-temporal plots.
2.4 Data analysis
Spike count data were analyzed using custom-written IGORPro software programs. Paired t-tests were used to test differences in response properties (characteristic frequencies, thresholds, response latencies and sharpness of tuning) of each excitatory response in multiply tuned neurons. The level of significance was p ≤ 0.05 (two-tailed).
2.5 Histological localization of recording sites
To confirm that responses were recorded from the central nucleus of the IC, we deposited dextran-conjugated rhodamine or biotin dextran amine iontophoretically (+5 μA, 10 min, 50% duty cycle) at the end of 1–2 electrode penetrations in each animal. Histological processing techniques and reconstruction of electrode tracts were the same as previously reported for mustached bat IC recordings (Portfors and Wenstrup, 2001a). The mouse was perfused through the heart with phosphate-buffered saline and 4% paraformaldehyde after being deeply anesthetized with sodium pentobarbital (60 mg/kg, i.p.). The brain was dissected, cryoprotected overnight in 30% sucrose and sectioned transversely with a freezing microtome at a thickness of 40 μm. For dextran-conjugated rhodamine two series were sectioned. One series was mounted and coverslipped with DPX. A second series was stained for Nissl substance to reveal cytoarchitecture. For biotin dextran amine, visualization was achieved using an avidin-biotin-peroxidase procedure (Vector Laboratories) and heavy metal-intensified diaminobenzidine was used for the chromagen. Sections containing deposit sites were photographed with a digital camera (Leica DC 300F) attached to an epifluorescence microscope with appropriate filters (Leica DMR). Using Photoshop software, the section containing the dye deposit was overlaid on the corresponding Nissl and stereotaxic atlas sections (Paxinos and Franklin, 2001) to reconstruct electrode penetrations.
Animal care and use procedures were in strict accordance with the National Institutes of Health Guide for the Care and Use of Animals and were approved by the Washington State University Institutional Animal Care and Use Committee.
3. Results
We obtained excitatory frequency tuning curves from 106 well isolated single units in the central nucleus of the IC. Characteristic frequencies were restricted to a range of 6–32 kHz and there was a large representation of neurons with CFs between 10–20 kHz (Fig. 1A). Altered tonotopy was also observed as has been documented previously (Willott, 1984; Willott et al., 1988). Throughout the IC, most single units were tuned to middle frequencies in the audible hearing range of the mouse (10–20 kHz). The majority of units in the ventral region (> 1000 μm from the dorsal surface) had CFs below 20 kHz and no CF exceeded 32 kHz (Fig. 1B). This is in marked contrast to the sensitivity to high frequencies present in the ventral region of normal hearing mice (Fig 1B). These findings confirmed that our mice were not sensitive to high frequencies. Thresholds as a function of CF are shown in Figure 1C. Thresholds were lowest for neurons below 15 kHz and highest for neurons above 20 kHz.
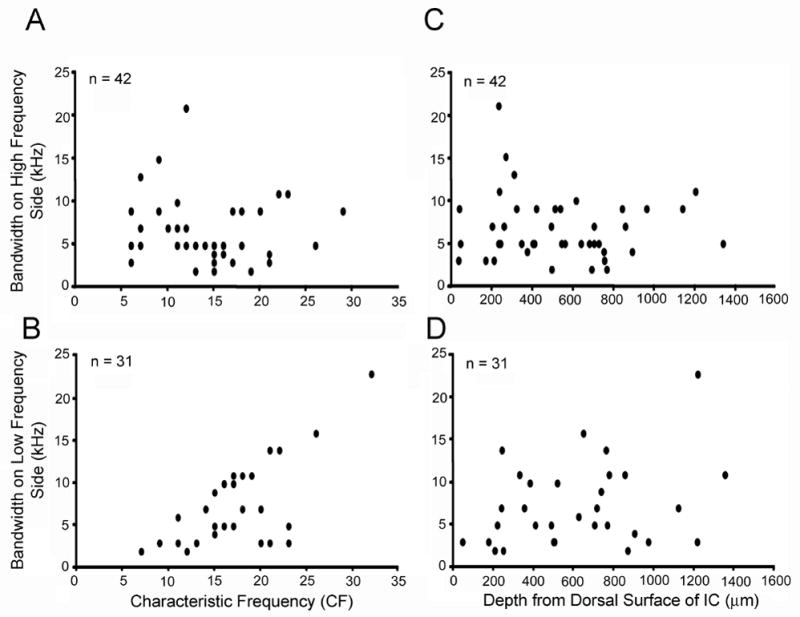
Figure 1.
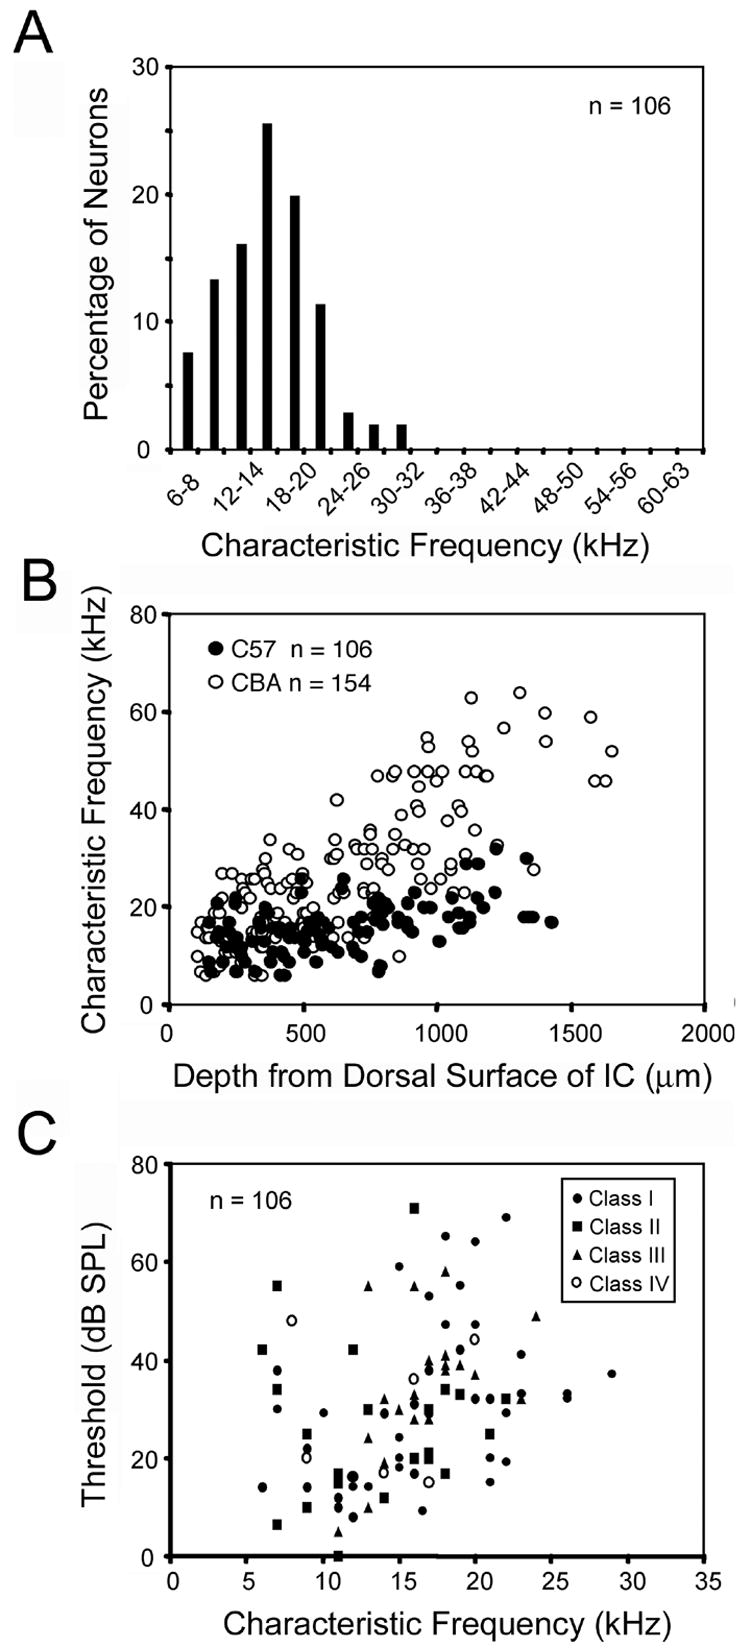
Frequency characteristics of single units in the IC. A: Characteristic frequencies (CF) of the sample of 106 neurons recorded from C57 mice between 6–12 months of age. CFs ranged from 6–32 kHz with many in the 10–20 kHz range. B: Tonotopic reorganization in the IC. CF plotted versus recording depth for neurons in the IC of C57 mice (filled circles) and normal hearing CBA/CaJ mice (open circles; replotted from Portfors and Felix II, 2005). In the C57 mice, neurons tuned to high frequencies (> 32 kHz) were absent and CFs in the ventral region of the IC were tuned to middle frequencies (10–20 kHz; filled circles). C: Minimum thresholds versus CF. Thresholds were lowest for neurons with CFs in the 10–15 kHz range.
The majority of units had single peaked tuning curves (n=95). Eleven neurons (10%) were tuned to multiple frequency bands. Two-tone tests were conducted on 67 units to examine inhibitory and facilitatory frequency response areas. The majority of neurons (75%) had some form of sideband inhibition. Sideband inhibition was the only type of inhibition recorded. Seven neurons (10%) had facilitatory frequency response areas.
3.1 Frequency response types
We divided the 95 neurons with single peaked tuning curves into four classes of frequency response areas based on the classification scheme of Egorova et al. (2001) for house mice. The four types are defined based on the shape of the unit’s excitatory and inhibitory frequency response areas as described in the Methods. Neurons with multiple tuning curves (n=11) were classified separately and are described in a subsequent section of the Results.
Forty-three (45%) neurons were classified as class I. Class I neurons were characterized by a steep slope on the high frequency side of the excitatory response area and a broadening of the response area on the low frequency side. These units often have inhibitory sidebands on the high and low frequency sides. Class 1 neurons had a broad range of CFs and thresholds. The majority of neurons with CFs higher than 15 kHz were class I. Frequency and temporal features of two class I neurons are illustrated in Figure 2 with spectral-temporal plots for single tones and two-tone combinations. Spectral-temporal plots show both frequency and temporal information of responses in one plot. Each row represents the PSTH for the corresponding frequency with spike rate calculated in each 1 ms bin. Because the frequency response of the acoustic system was not flat across the range of frequencies presented, the intensity level is plotted as dB attenuation. This is a common method for plotting intensity in frequency response maps when the frequency range is large (Young and Davis, 2002). To obtain dB SPL levels, the dB attenuation value is subtracted from the acoustic calibration curve for the system. The neuron in Fig. 2A had a CF of 18 kHz and a threshold of 18 dB SPL. At 10 dB above threshold, the response was narrowly tuned (Q10 = 8.5) with a sustained temporal firing pattern and no spontaneous activity. As the intensity was increased, the frequency tuning curve broadened only on the low frequency side. The high frequency side never broadened past 19 kHz even at the highest intensities tested (80 dB SPL). The two-tone test confirmed that inhibition flanked the high frequency and low frequency sides of the excitatory response area (Fig. 2A, bottom row). The neuron in Fig 2B had a CF of 12 kHz and a threshold of 16 dB SPL. This unit was not as sharply tuned, with a Q10 dB value 2.0. This unit also had a sustained temporal firing pattern and no spontaneous activity. The excitatory response area broadened on the low frequency side with increasing intensity. Inhibition was present on the high frequency side of the excitatory response area (Fig. 2B, bottom plot, solid arrow).
Class II neurons (n = 22, 23 %) had steep slopes on the low and high frequency sides of the excitatory response area and inhibitory areas flanking both sides. These neurons had non-monotonic rate/level functions due to strong inhibition occurring at high intensities. Class II neurons had the lowest mean threshold (Figure 1C). Frequency and temporal features of two class II neurons are displayed in Figure 3. The neuron in Figure 3A had a CF of 18 kHz and a threshold of 17 dB SPL. It had very sharp frequency tuning with a Q10 dB value of 18. The response magnitude decreased with increasing intensity and was totally suppressed at 20 dB above threshold. The unit had a pauser firing pattern as can be seen in Figure 3A. The spectral-temporal plot in the last row of Figure 3A shows that inhibition flanked the excitatory response and reached through the excitatory area. The unit in Figure 3B also showed sharp frequency tuning (Q10 dB = 15) and a non-monotonic rate/level function. This unit had a CF of 15 kHz and a threshold of 18 dB SPL. The response was suppressed at 10 dB above threshold. The spectral-temporal plot in the last row of Figure 3B shows that inhibition flanked the low and high frequency sides of the excitatory response area.
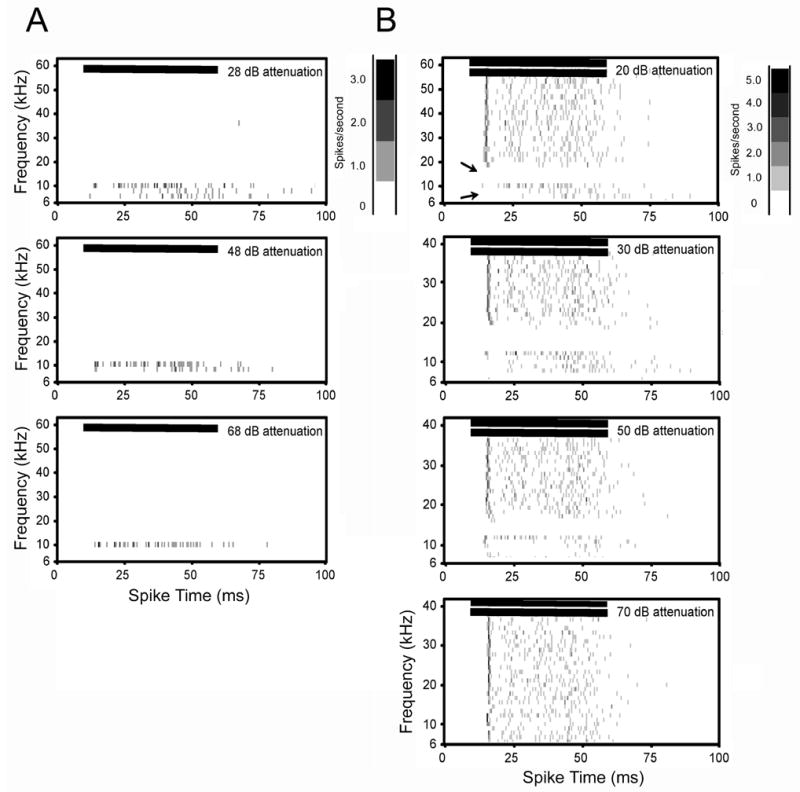
Figure 3.
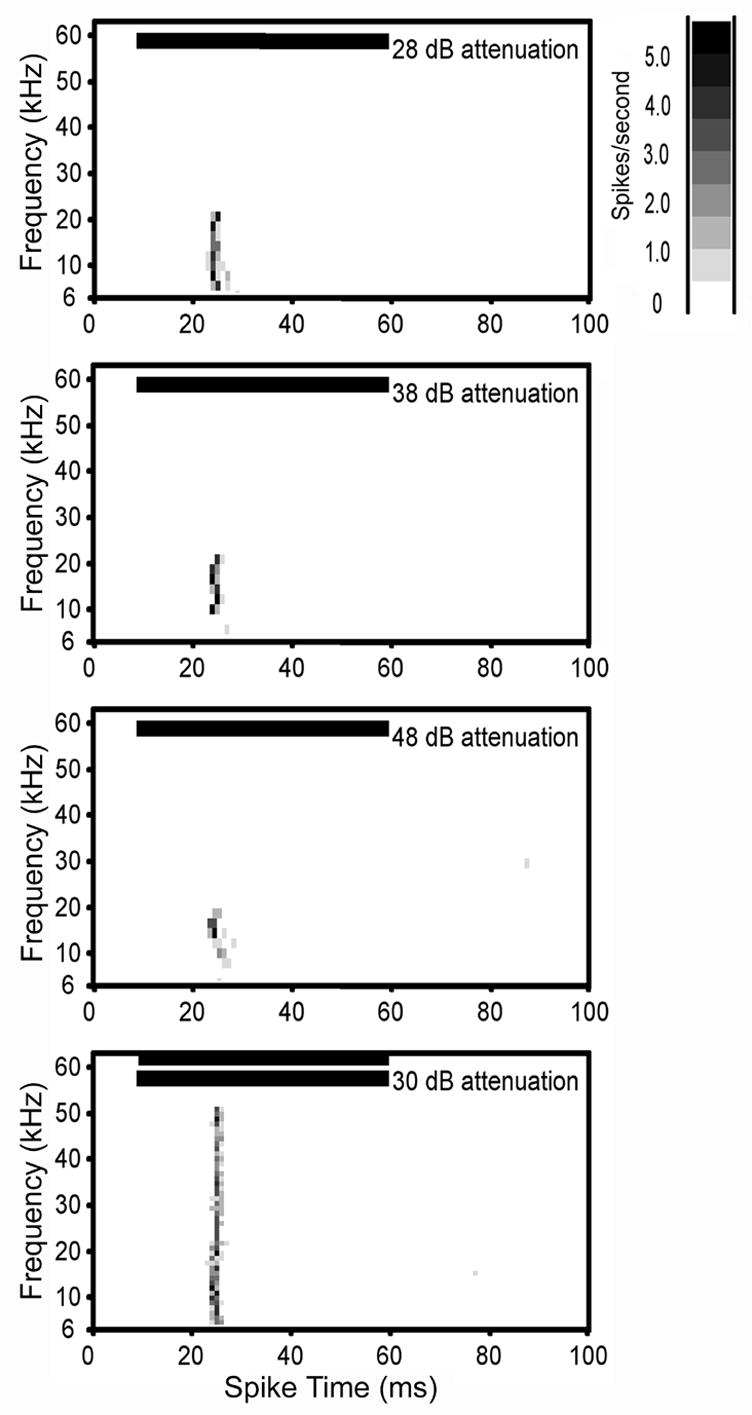
Spectral-temporal histograms of two Class II neurons. These neurons were characterized by sharp frequency tuning on the low and high frequency sides of CF and non-monotonic rate/level functions. A. Single unit with a CF of 18 kHz and a threshold of 17 dB SPL. The excitatory response area did not broaden with increasing intensity (first four plots) and the response was completely suppressed at 20 dB above threshold (note range of intensity only encompasses 15 dB). Inhibition flanked the CF as shown by the two-tone test plot in the bottom row. Solid arrows indicate inhibition and dotted arrow indicates CF. No excitation is present at the CF due to the non-monotonicity of the response. B. Single unit with a CF of 15 kHz and a threshold of 18 dB SPL. The response of this unit was completely suppressed by 10 dB above threshold (note range of intensity only encompasses 6 dB). Inhibition flanked the CF on the high and low frequency sides (solid arrows in two tone plot in bottom row. Dotted arrow shows minimal response to CF. Horizontal bars in each plot show the onset and duration of the stimulus. Bin width for all plots is 1 ms. See figure 2 legend for additional details on spectral-temporal plots.
Class III neurons (n=24, 25%) showed a symmetrical V-shaped tuning curve that broadened with intensity. These neurons had weak or no inhibition flanking the excitatory response areas. The majority of class III neurons had CFs between 12–20 kHz (Figure 1C). Figure 4 shows a class III neuron. This unit had a CF of 18 kHz and a threshold of 41 dB SPL. It had broad frequency tuning with a Q10 dB value of 2. There was no inhibition flanking the excitatory response area in this unit (Fig. 4, last row).
Class IV neurons (n=6, 6 %) showed complex excitatory and inhibitory response areas with no additional defining features.
3.2 Multiply tuned neurons
We were particularly interested in the response features of multiply tuned neurons in C57 mice because we previously showed that the majority of multiply tuned neurons in normal hearing mice (CBA/CaJ) were located in the ventral region of the IC (Portfors and Felix II, 2005). Thus, these should be reduced in C57 mice suffering from high frequency sensorineural hearing loss. Eleven of 106 neurons (10%) were tuned to multiple frequencies. These multiply tuned neurons had two excitatory tuning curves in different frequency bands. The excitatory tuning curves were separated by frequency regions that did not evoke activity in the neurons at the highest intensities tested (usually 80 dB SPL). Based on histological reconstruction of electrode tracts, we found that most multiply tuned neurons were located in the dorsal region of the IC where low to middle frequencies are represented.
We characterized separate excitatory response areas of multiply tuned neurons as “tonotopic” and “non-tonotopic”. The tonotopic area contained the frequency range that would be expected based on the unit’s depth in the IC and the non-tonotopic area was outside the frequency range predicted by the unit’s location. When designating tonotopic and non-tonotopic areas, we used the reorganized frequency map of the hearing impaired C57 IC (Willott, 1986). Most multiply tuned neurons had a tonotopic area of excitation that was higher in frequency than the second, non-tonotopic area of excitation (Table 1; Figure 5).
Table 1.
Values of response properties of multiply tuned neurons in the middle-aged C57 1C.
| Unit ID | CF (kHz) | threshold (dB SPL) | Q10dB | latency (ms) |
|---|---|---|---|---|
| 39-1-763 (CFt)a | 17 | 18 | 10.0 | 23.7 |
| (CFn) | 6 | 64 | 17.0 | 22.3 |
| 39-2-420 | 10
23 |
45
68 |
6.0
2.6 |
16.5
32.3 |
| 39D-3-566 | 12
7 |
42
75 |
12.0
7.0 |
18.1
20.3 |
| 39-3-701 | 15
6 |
52
79 |
15.0
3.0 |
35.4
30.7 |
| 50-3-1105 | 29
16 |
30
51 |
29.0
1.3 |
13.7
15.4 |
| 50-3-1149 | 29
7 |
37
72 |
14.5
7.0 |
17.4
17.3 |
| 50-3-1213 | 32
20 |
43
80 |
16.0
10.0 |
16.1
15.6 |
| 51-2-180 | 16
6 |
40
36 |
1.6
6.0 |
30.4
44.5 |
| 53-2-463 | 14
26 |
8
52 |
7.0
6.5 |
32.2
35.8 |
| 53-5-1330 | 30
16 |
30
71 |
7.5
2.7 |
36.6
20.4 |
| 66-5-354 | 19
6 |
35
53 |
3.2
6.0 |
18.8
46.5 |
CFt refers to the tonotopic and CFn to the non-tonotopic component of multiply tuned response areas.
Figure 5.
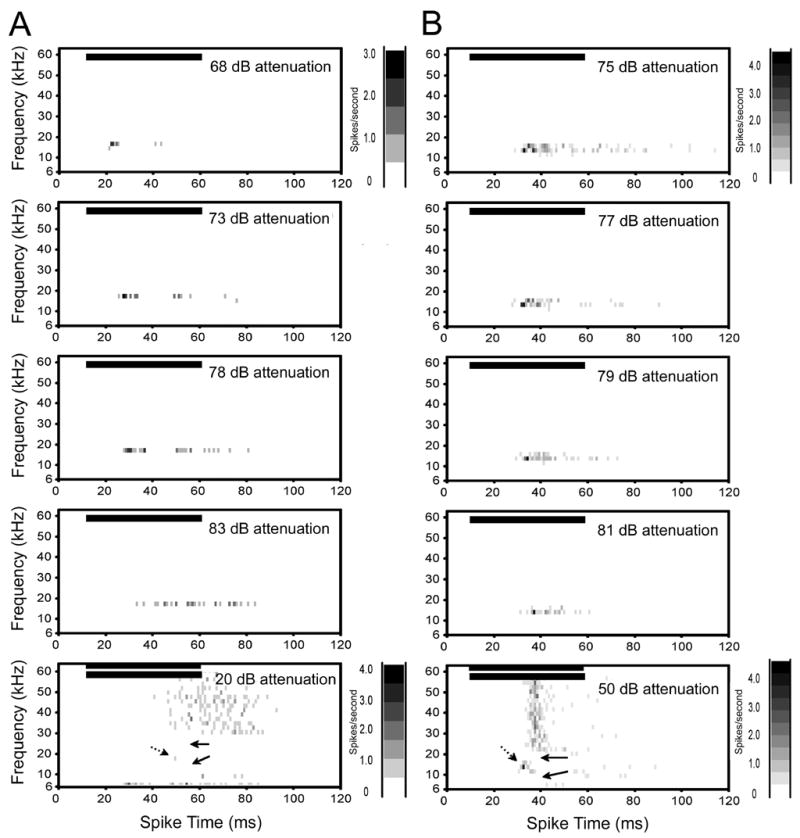
Spectral-temporal histograms of two single neurons with multiple excitatory response areas. A. This single unit had a high tonotopic and a low non-tonotopic CF. The tonotopic CF of this unit was 12 kHz and the non-tonotopic CF was 7 kHz. Thresholds were 42 dB SPL and 75 dB SPL, respectively. Although the CFs were less than an octave apart, the two excitatory response areas did not join together, even at the highest intensity tested (top plot in A). The two tone test (bottom row) showed that inhibition did not separate the two excitatory regions (solid arrows). B. This single unit had a tonotopic CF of 29 kHz and a non-tonotopic CF of 7 kHz. Thresholds were 37 and 39 dB SPL, respectively. The excitatory region surrounding CF broadened on the high frequency side with increasing intensity (top row). The excitatory region surrounding the non-tonotopic CF did not broaden with intensity. The two-tone test (bottom row) showed that inhibition did not separate the two excitatory regions. The inhibition that flanked the low frequency side of CF only extended to 20 kHz (top arrow). Inhibition flanked the high frequency side of the non-tonotopic CF, but it did not extend to the 20 kHz inhibition (bottom arrow), even at the highest intensity tested (only plot for two tone test shown). Horizontal bars in each plot show the onset and duration of the stimulus. Bin width for all plots is 1 ms. See figure 2 legend for additional details on spectral-temporal plots.
The neuron illustrated in Figure 5A had two frequency response maps that were less than an octave apart. However, the tuning curves remained separate at the highest intensity tested (80 dB SPL). The tonotopic CF of this neuron was 12 kHz and the threshold was 42 dB SPL. The latency of the tonotopic response at 30 dB above threshold was 18 ms. The second, non-tonotopic CF was 7 kHz and the threshold was 75 dB SPL. The latency of this response was 20 ms. Both the tonotopic and non-tonotopic response areas were narrowly tuned in frequency. The tonotopic tuning curve broadened slightly with increasing intensity; the Q10, Q30 and Q50 dB values were 6.0, 3.0 and 2.4 respectively. On the high frequency side, the response did not go higher than 15 kHz. Inhibition flanked the high frequency side of the excitatory tuning curve creating the sharp cut-off (Fig. 5A, bottom plot, solid arrow). The threshold of this side-band inhibition was 40 dB. The non-tonotopic response can be seen at the loudest two intensities in Figure 5A (top two plots). The Q10 dB value of this response was 3.5. The Q30 and Q50 dB values could not be tested because of the high threshold of this neuron. The high frequency side of the non-tonotopic tuning curve did not merge with the low frequency side of the tonotopic tuning curve. Moreover, a two-tone test showed that inhibition did not separate the two tuning curves (Fig. 5A, bottom plot).
One multiply tuned neuron (Fig. 5B) had a frequency tuning curve that extended beyond 30 kHz at high intensities suggesting that high frequency hearing loss had not fully progressed in this animal. This neuron had a tonotopic CF of 29 kHz and a non-tonotopic CF of 7 kHz. The thresholds of the two responses were 37 and 39 dB SPL, respectively. At 10 dB above threshold, both responses were narrowly tuned, had similar onset PSTH patterns and first spike latencies (17.4 ms). As the intensity of the stimulus increased to 30 dB above threshold, the tonotopic response became broader (Q10 dB of 14.5 versus Q30 dB of 2.7). At 40 dB above threshold, the tuning curve extended from 18 kHz to 40 kHz (Fig. 5B, top row). Inhibition was present on the low frequency side of the tuning curve (Fig. 5B, bottom row, solid arrow). The tuning curve of the non-tonotopic response did not broaden with intensity on the high frequency side (Fig. 5B, top two plots), and inhibition flanked this side (Fig. 5B, bottom plot, solid arrow).
Table 1 displays data for all the multiply tuned neurons we recorded in the IC of C57 mice. The mean (SD) CF and threshold for tonotopic responses were 19.8 kHz (±8.1 kHz) and 34.5 dB SPL (±12.6 dB SPL). In comparison, non-tonotopic CFs were significantly lower (12.6 kHz ±7.8 kHz; p< 0.05) and thresholds were significantly elevated (63.7 dB SPL ±14.0 dB SPL; p< 0.005). Tonotopic responses were more sharply tuned in frequency compared to non-tonotopic responses, with Q10 dB values of 12.1 (±7.6) and 5.3 (±2.6), respectively (p= 0.026). The majority of both tonotopic (64%) and non-tonotopic (82%) responses had CFs below 20 kHz.
3.3 Inhibitory response areas
Seventy-five percent of units tested had inhibition that flanked excitatory response areas. The majority (56%) of cells had inhibition on both the low and high frequency sides of the excitatory response area. Thirty-five percent had inhibition only on the high frequency side and 9% only on the low frequency side. Figures 6 and 7 show two neurons that exhibited strong sideband inhibition. The neuron in Figure 6 was sharply tuned in frequency with a CF of 12 kHz and a threshold of 14 dB SPL. Strong inhibition flanked both the low and high frequency sides of CF (Fig. 6, second column, solid arrows); the threshold of inhibition was 70 dB attenuation. The neuron in Figure 7 was sharply tuned in frequency with a CF of 13 kHz and a threshold of 14 dB SPL. Strong inhibition was present on the high frequency side of CF, and this inhibition had a threshold of 70 dB attenuation. The high frequency cut-off of the inhibition was sharply tuned such that at the highest intensity tested (30 dB attenuation), the inhibition did not extend past 20 kHz (Fig. 7, top plot, second column).
Figure 6.
Spectral-temporal histogram of a neuron with strong inhibition. The CF and threshold of this unit were 12 kHz and 14 dB SPL, respectively. A: Frequency tuning from single tone tests. Frequency tuning remained sharp as the stimulus intensity increased. B: Inhibitory response areas obtained from two-tone tests. A CF tone was held constant at 24 dB SPL while the frequency and intensity of a second tone was varied. Strong inhibition flanked the excitatory CF region (arrows, top row). Suppression by the second tone persisted with decreasing intensity of the second tone until a threshold of 70 dB attenuation was reached (bottom three rows). Horizontal bars in each plot show the onset and duration of the stimulus. Bin width for all plots is 1 ms. See figure 2 legend for additional details on spectral-temporal plots.
Figure 7.
Spectral-temporal histograms of single unit with strong inhibition. This unit displayed sharp frequency tuning and had a CF and threshold of 13 kHz and 14 dB SPL, respectively. Left column shows frequency tuning from single tone tests. The high frequency side of this unit’s excitatory response map remained sharply tuned at the highest intensity tested (top row). Right column shows two-tone tests. The high side inhibition had a sharp cutoff around 20 kHz (top row). Near threshold (70 dB attenuation), high side inhibition only extended to 16 kHz, but remained sharp (third row). Horizontal bars in each plot show the onset and duration of the stimulus. Bin width for all plots is 1 ms. See figure 2 legend for additional details on spectral-temporal plots.
In mice with high frequency hearing loss, we would expect that neurons with high frequency CFs would lose inhibition on the high frequency side of the CF. Therefore, we characterized the structure of the inhibitory areas to test the following predictions: 1. Bandwidth of inhibition on the high frequency side of the excitatory response area should decrease with increasing depth (and CF). 2. Bandwidth of the inhibition on the low frequency side should not change with depth (or CF) (with the caveat that for very low frequency CFs, we could only test inhibition bandwidth down to 6 kHz due to speaker constraints). Figure 8 shows that these predictions were not strongly supported. High side inhibition bandwidths were similar across depth (and CFs) with a few exceptions where neurons in dorsal locations and low CFs had inhibitory bandwidths over 10 kHz. Most neurons had inhibitory bandwidths between 4–10 kHz. Inhibitory bandwidths on the low side of CF were not correlated with depth, but were related to CF. This relation is likely an artifact due to our inability to test for inhibition below 6 kHz. Thus, neurons with low CFs had small low side inhibitory bandwidths partly due to the nature of the testing paradigm.
Figure 8.
Characteristics of bandwidths of inhibitory regions surrounding excitatory response areas in C57 units. A: Inhibitory bandwidth on the high side of CF versus CF. Forty-two units (63%) displayed inhibition at the high side of excitatory response areas. The inhibitory bandwidth was similar regardless of CF, although the units with the lowest CFs did have the biggest inhibitory bandwidths. B: As frequency representation in IC shifts in the C57 mouse, units with high CFs are located from mid to ventral regions of IC. We plotted inhibitory bandwidth versus depth to test whether high frequency units in ventral IC had smaller inhibitory bandwidths than dorsal high CF units. Inhibitory bandwidths on the high side of CF were similar across all recording depths. C: Inhibitory bandwidth on low frequency side of CF. Thirty-one units (46%) had inhibitory areas at the low frequency side of excitatory response maps. There was a positive correlation due to our inability to present frequencies below 6 kHz. D: Inhibitory bandwidths on the low side of CF were similar across all recording depths.
3.4 Combination-sensitive facilitation
Of 67 neurons tested, 7 showed facilitatory interactions between two tones of different frequencies. Response features of a facilitatory unit are illustrated in Figure 9. This unit had a CF of 10 kHz and a threshold of 35 dB SPL. At 10 dB above threshold, this unit responded with a pauser temporal firing pattern and had a mean response magnitude of 2.6 spikes/stimulus (Fig. 9A). The unit was facilitated by the presence of a second tone of 22 kHz at 74 dB SPL. The response magnitude of the tone combination was 6.2 spikes/stimulus, over a two-fold increase over the response to the excitatory CF tone alone, corresponding to a facilitation index value of 0.41. The facilitatory tone was outside the neuron’s excitatory tuning curve and elicited no response when presented alone at a high intensity (74 dB SPL; Fig. 9A, B).
Figure 9.
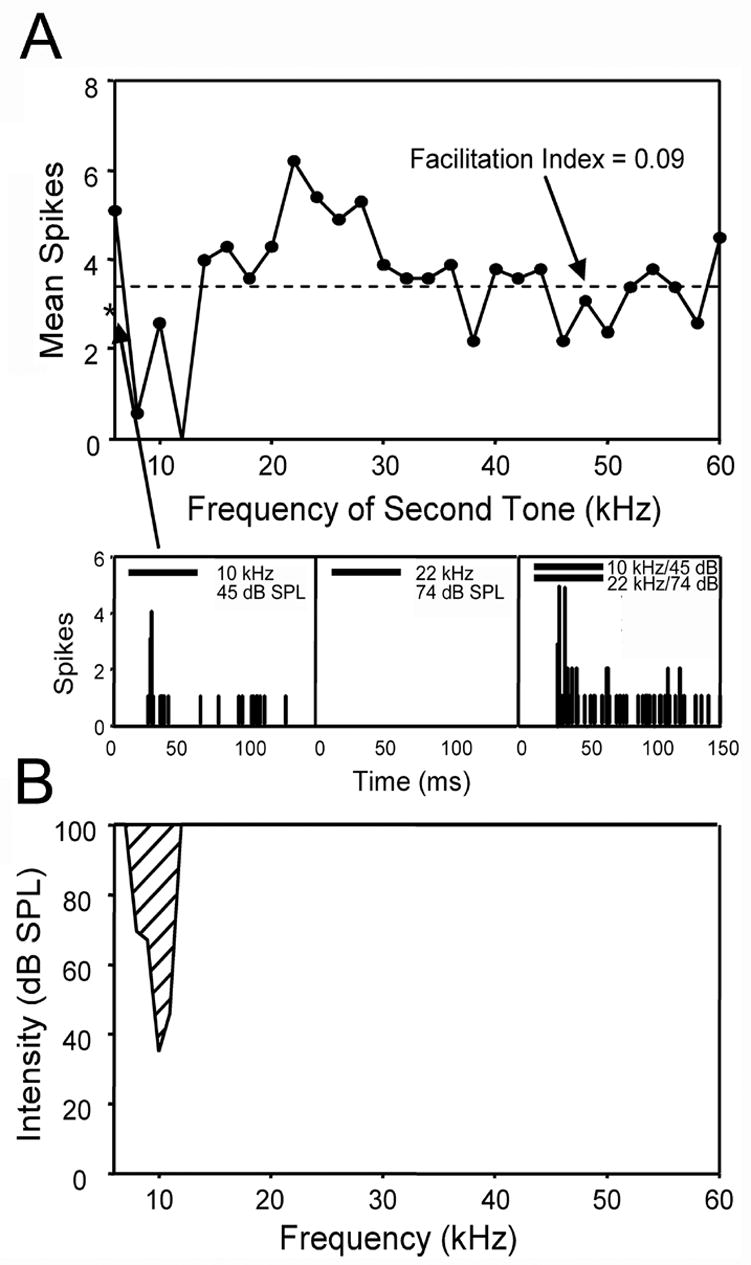
Facilitatory frequency response area of a single unit. Facilitation was determined using a two-tone paradigm, where one tone was presented at the unit’s CF and a second tone ranging from 6–60 kHz was presented simultaneously. A: Facilitation of a 10 kHz tone by a second tone at 22 kHz. The dashed line represents a facilitation index value of 0.09, corresponding to a 20% increase in the response magnitude to two tones compared to presentation of the CF tone alone. Any response above this line is defined as facilitation. The response to the CF alone is represented by an asterisk on the y-axis. Bottom left: PSTH of the response to the CF tone alone presented at 10 dB above threshold (45 dB SPL, horizontal bar). The mean spike count for the CF tone was 2.6 spikes/stimulus (asterisk). Bottom center: PSTH showing that the facilitatory tone of 22 kHz was not in the neuron’s excitatory frequency response area and did not elicit a response when presented alone at a high intensity level (74 dB SPL). Bottom right: Presentation of the CF and facilitatory tone elicited an increase in the response of more than two fold (6.2 spikes/stimulus) compared to the CF tone alone. The increase in response represents a facilitation index value of 0.41 which exceeds the criteria for facilitation (index value ≥ 0.09, arrow in A). Solid bar in PSTHs represents the sound stimulus. Bin width in PSTHs is 1 ms. B: Frequency tuning curve of the facilitated neuron in A, using single tone presentations. The facilitatory frequencies of the second tone (A) were beyond the neuron’s excitatory response area over a wide range of intensities (0–100 dB SPL).
Table 2 presents response properties of the 7 neurons that displayed combination-sensitive facilitation. The mean excitatory CF for these units was 11.6 kHz (±4.3 kHz) and the mean frequency for the facilitating tones was 23.6 kHz (±7.0 kHz). Five of the 7 facilitating frequencies were completely outside the excitatory tuning curves and no facilitating tones elicited strong responses when presented alone. In the majority of facilitatory responses (n=5), the frequency of the facilitating tone was just beyond the high end of the excitatory tuning curve. For our sample of facilitatory units, the mean octave difference between the frequencies of the two tones was just over one octave (1.14 ±0.58). In every case, the response magnitude of facilitation was more than 20% greater than the summed responses of the two tones presented alone, resulting in a mean facilitation index value of 0.23 (±0.17).
Table 2.
Response properties of units exhibiting facilitation in the aging C57 1C.
| Unit ID | Characteristic frequency (kHz) | Frequency of facilitation (kHz) | Facilitation Index | Octaves between CF and facilitation |
|---|---|---|---|---|
| 39-2-420 | 10 | 22 | 0.11 | 1.20 |
| 39-3-566 | 12 | 18 | 0.12 | 0.50 |
| 50-4-623 | 11 | 25 | 0.33 | 1.27 |
| 53-5-946 | 20 | 26 | 0.23 | 0.30 |
| 53-5-1330 | 13 | 37 | 0.17 | 1.85 |
| 62-1-249 | 7 | 15 | 0.56 | 1.14 |
| 69-3-453 | 8 | 22 | 0.10 | 1.75 |
4. Discussion
4.1 Excitatory frequency response areas
Neurons in the C57 IC clearly showed characteristics associated with high frequency sensorineural hearing loss. High characteristic frequencies (> 32 kHz) were absent and there was an overrepresentation of middle frequencies (10–20 kHz). In addition, neurons in the region of the IC that is normally sensitive to high frequencies responded exclusively to much lower frequencies. In normal hearing mice, there exists a topographic frequency map that originates at the inner ear and is preserved in all major auditory nuclei (Ehret and Romand, 1997; Muller et al., 2005). In the mouse IC, this tonotopic map normally represents lower frequencies dorsolaterally and progressively higher frequencies ventromedially (Stiebler and Ehret, 1985). Willott (1984) observed that the tonotopic map in IC is severely disrupted in mice suffering from sensorineural hearing loss. In the adult C57 mouse, responses to high frequencies are absent, presumably due to the effects of cochlear degeneration (Mikaelian, 1979; Willott, 1986; Willott et al., 1988). Interestingly, neurons in the ventral IC that are normally responsive to high frequencies, shift their sensitivity to much lower frequencies with the onset of high frequency hearing loss(Willott, 1984; Willott, 1986). In the current study, the absence of high CFs, the presence of frequency reorganization, and elevated neural thresholds throughout the IC suggest that our mice were indeed hearing impaired as they exhibited characteristics very similar to what has been described previously.
We further examined frequency response areas by classifying frequency response maps according to the system of Egorova et al. (2001). This classification system is based on the shapes of both excitatory and inhibitory response areas. We found that about half of the neurons were Class I; they had steep slopes on the high frequency side of the excitatory tuning curve and broad tuning on the low frequency side. The rest of the neurons were split between Class II (steep slopes on high and low frequency sides) and Class III (broad tuning on high and low frequency sides). Hearing loss is known to decrease inhibition (Willott et al., 1997) and because of this we expected excitatory tuning curves to be broad on both the high and low frequency sides of the tuning curve and to be categorized as Class III. In addition, with high frequency sensorineural hearing loss, excitation and inhibition on the high frequency side of tuning curves with high CFs would be expected to decrease. Thus, we expected that neurons with low CFs would be mainly Class III (broad V-shaped tuning) and neurons with high CFs would be mainly Class I (sharp tuning on high frequency side due to loss of all excitatory and inhibitory inputs and broad tuning on low frequency side). As shown in Figure 1C, the distribution of Class I and Class III responses overlapped although the neurons with the highest CFs were most often Class I. These findings suggest that a mix of altered excitatory and inhibitory inputs in hearing impaired C57 mice contribute to excitatory and inhibitory frequency response. These alterations of inputs undoubtedly affect the animals’ perceptions of complex sounds such as communication vocalizations.
4.2 Inhibitory response areas
Because inhibition is known to decrease with hearing loss(Willott et al., 1997), we characterized the bandwidths of the inhibitory response areas and compared these to CF and recording depth. We hypothesized that neurons with high CFs had lost high frequency inhibitory inputs and predicted that this would cause narrow inhibitory bandwidths on the high side of CF. Surprisingly, inhibitory bandwidths were similar regardless of CF and there was no relationship between CF and bandwidth. There was also no relationship between bandwidth on the high frequency side of CF and recording depth. We expected that neurons in the ventral region would have narrower bandwidths compared to neurons in the dorsal region due to loss of high frequency inhibitory inputs with age-related hearing loss. While the largest bandwidths were for some of the lowest CFs and most dorsal recording depths, similar bandwidths (5–10 kHz) were found for CFs between 6–29 kHz. This suggests that, in at least some neurons, high frequency sensorineural hearing loss had not reduced all inhibitory inputs over 30 kHz. However, there were no excitatory or inhibitory frequency response areas greater than 40 kHz as is seen in normal hearing mice (Portfors and Felix II, 2005).
4.3 Multiply tuned neurons and altered tonotopy
Neurons tuned to multiple frequency bands have been described in the mouse IC (Egorova et al., 2001; Portfors and Felix II, 2005) and auditory cortex (Linden et al., 2003; Stiebler et al., 1997)., but their role in sound processing remains unclear. In addition to possessing a low frequency component, most multiply tuned neurons in the IC of normal hearing mice have sensitivity to ultrasonic frequencies. This sensitivity implicates them in the processing of social vocalizations, which are emitted in the ultrasonic range (Nyby, 2001; Nyby and Whitney, 1983; Portfors and Felix II, 2005). The proportion of multiply tuned neurons recorded in the IC of C57 mice (10%) was far less than observed in the IC of normal hearing mice using the same methodology (32%; (Portfors and Felix II, 2005). Not only were there fewer units with multiple peaks of excitation, but the response properties of multiply tuned neurons were different in the C57 mouse. In normal hearing CBA/CaJ mice, multiply tuned neurons have both high and low frequency tuning peaks that are separated by more than an octave (Portfors and Felix II, 2005). In multiply tuned neurons in the C57 mouse, the low frequency response area was present, but the high frequency peak was shifted much lower compared to normal hearing mice. Because the tonotopic map organizes information throughout the auditory system, this shift in frequency with high frequency hearing loss likely has consequences for processing of complex sounds, including social vocalizations.
Neurons in the ventral IC normally respond to high frequencies, but as sensorineural hearing loss progresses, their sensitivity shifts to lower frequencies (Stiebler and Ehret, 1985; Willott, 1984). Several mechanisms have been proposed that may underlie changes in tonotopic organization in mice with sensorineural hearing loss (Willott, 1984; Willott, 1986).. One explanation for altered tonotopy involves a change in sensitivity in the cochlea (Willott, 1984). Hair cells located at the basal end of the basilar membrane that normally respond to high frequencies may shift their sensitivity to lower frequencies. In mice with age-related hearing loss, this change in sensitivity would create a new pathway for encoding low frequencies in areas normally dedicated to high frequency processing. Similar changes in sensitivity have been observed during development and following acoustic trauma (Liberman, 1984; Lippe and Rubel, 1983). Evidence to support this hypothesis is lacking and it appears unlikely considering that changes in the frequency map are more pronounced at each successive stage of auditory processing (Willott, 1986; Willott, 1991a; Willott et al., 1993).
Another hypothesis for explaining the altered frequency organization in mice with age-related high frequency hearing loss involves anatomical changes in inputs to the ventral IC. This hypothesis states that areas representing low frequencies in auditory brainstem nuclei sprout axon collaterals that then project to non-tonotopic high frequency regions of the IC. This would be similar to plasticity that occurs in the somatosensory and visual cortices where surrounding axons innervate areas formerly dedicated to regions where sensory representation has been lost (Kaas et al., 1983; Kaas et al., 1990). To test this hypothesis, Willott et al. (1985, 1991) placed retrograde neural tracers (WGA-HRP) throughout the IC and examined labeling in the dorsal and ventral cochlear nuclei. They found little difference in aging C57 mice compared to the normal hearing CBA, with respect to the sizes of the structures and the amount and strength of labeling. These data suggest that connections from brainstem nuclei to the IC remain stable during high frequency hearing loss.
The hypothesis for altered tonotopy that has garnered the most evidence thus far is the idea that there is an “unmasking” of low frequency inputs that occurs with aging. Willott (1984, 1986) suggested that low frequency, non-tonotopic inputs to the ventral IC may be present in young C57 and CBA mice, but these inputs are normally suppressed by inhibition. When inhibition is weakened through aging, the inputs are “unmasked” and become excitatory. Evidence for this mechanism includes the presence of low frequency inhibitory areas in the IC of normal hearing mice (Willott, 1986) and decreased glycine immunoreactivity in the aging C57 (Willott et al., 1997). In addition, there is a distinct difference in the CFs and thresholds of these unmasked responses compared to the low frequency tails of typical high CF responses. Therefore, merely clipping the high end of the tuning curve cannot explain these changes.
Willott’s hypothesis of two inputs to neurons in the ventral IC can partially explain differences between multiply tuned neurons in aging C57 and normal hearing CBA mice. If neurons normally receive both high frequency tonotopic and low frequency non-tonotopic input to the ventral IC (Willott, 1984), but the low frequency input is not inhibited, these neurons would exhibit multiple peaks of excitation tuned to distinct spectral bands. This would result in a population of multiply tuned neurons similar to those that have been reported in the normal hearing mouse IC (Portfors and Felix II, 2005). As C57 mice develop sensorineural hearing loss typical high frequency tonotopic responses of multiply tuned neurons would be lost following cochlear degeneration and the non-tonotopic low frequency responses would be left to solely determine the unit’s CF and threshold. These neurons would be classified as singly tuned in recordings in the aging C57 IC and may account for the decreased number of multiply tuned neurons compared to normal hearing mice. In addition, only multiply tuned neurons with relatively low tonotopic and non-tonotopic CFs would be expected in the hearing-impaired C57 IC, as supported by our results (Table I).
The presence of high and low frequency inputs to the ventral IC can explain changes in tonotopy in the C57 IC, but other explanations exist for the multiply tuned responses found in the ventral IC of normal hearing mice. First, several groups report hypersensitive low frequency tails in the cochlea and auditory nerve fibers (Chen et al., 1996; Harrison and Evans, 1982; Schoonhoven et al., 1994) and more work must be done to conclude that the low frequency tuning curves found in ventral IC neurons are distinct from high frequency tuning curves and not due to hypersensitive low frequency tails that arise in the cochlea. In addition, thresholds of ventral IC responses in the C57 are elevated compared to non-tonotopic, low frequency responses in normal hearing CBA (Portfors and Felix II, 2005). This is likely due to strain differences, as CBA mice are reported to have more sensitive hearing compared to C57s (Willott, 1986). Characterizing responses from multiply tuned neurons in young C57 mice, before the onset of hearing loss, would serve as an appropriate control for examining changes in older mice. However, this approach is difficult, considering the mouse auditory system is not fully developed until nearly one month of age (Shnerson and Willott, 1979) and the effects of high frequency hearing loss in the C57 have been observed as early as two months (Henry and Chole, 1980; Hequembourg and Liberman, 2001; Li and Borg, 1991).
4.4 Combination-sensitive neurons
Combination-sensitive neurons were first described in bats (Suga and O’Neill, 1978; Suga and O’Neill, 1979) and have since been found in other species (Fuzessery and Feng, 1983; Margoliash and Fortune, 1992). These neurons display non-linear facilitation or inhibition in response to two tones of different frequencies presented together, compared to the summed responses to the tones presented separately. Recently, combination-sensitive neurons have been shown to be selective for species-specific communication sounds in the bat IC (Portfors, 2004). Combination-sensitive neurons are present in the mouse IC (Portfors and Felix II, 2005), and it is likely that they play a role in the processing of complex sounds, including social vocalizations.
Seven neurons (10%) in the C57 IC were classified as combination-sensitive. This is fewer than were recently reported in normal hearing CBA mice (Portfors and Felix II, 2005). Roughly one-third of combination-sensitive neurons in the CBA had characteristic frequencies above 25 kHz. Therefore, the decrease in these types of responses in the C57 is not surprising because of the high frequency hearing loss that these mice experience.
When the combination-sensitive neurons were broken down into facilitatory and inhibitory responses, 7 units exhibited facilitation and none showed combination-sensitive inhibition. It has been shown that the strength of inhibition in the IC decreases in aging C57 mice (Willott et al., 1997), and this may account for combination-sensitive inhibitory units being more susceptible to loss. Because it is thought that combination-sensitivity may underlie aspects of communication-sound processing (Portfors, 2004), any loss of these neurons may affect the animal’s ability to encode and perceive communication sounds. However, this remains to be tested and understood.
4.5 Concluding remarks
Both mice and humans undergo similar changes at the periphery during hearing loss (Henry, 1983; Mikaelian, 1979), and both must extract information from spectrally complex social vocalizations (Frisina and Frisina, 1997; Geissler and Ehret, 2002). It is therefore presumed that changes in the central auditory system that accompany hearing loss will impair each species’ ability to properly represent these sounds. High frequency hearing loss may not initially impact humans as much as mice, because speech sounds contain lower frequency components that are not affected by the hearing loss (Pichora-Fuller and Souza, 2003; Willott, 1991b). However, degeneration at the cochlea spreads to areas representing progressively lower frequencies, eventually encroaching on regions important for speech. In addition, speech is composed of many high frequency harmonics that add to the quality of the sound (Hirsch and Watson, 1996). If these harmonics were unable to be detected, due to high frequency hearing loss, one might have trouble understanding speech, particularly in noisy environments. Therefore, we must continue to study how complex response properties in the auditory system change with aging to elucidate the mechanisms responsible for processing communication sounds.
Acknowledgments
This work was supported by NIH/NIDCD grant R01 DC04733 to CVP and an NIH underrepresented minorities supplement to RAF. We thank Dorin Colibaseanu for help with data collection, Deborah Palmer and Edward Groth for technical support. We also thank two anonymous reviewers for their helpful comments on this manuscript.
Abbreviations
- ABR
auditory brainstem recording
- CF
characteristic frequency
- dB
decibels
- IC
inferior colliculus
- MT
minimum threshold
- NaCL
sodium chloride
- PSTH
post-stimulus time histogram
- SD
standard deviation
- SPL
sound pressure level
Footnotes
Publisher's Disclaimer: This is a PDF file of an unedited manuscript that has been accepted for publication. As a service to our customers we are providing this early version of the manuscript. The manuscript will undergo copyediting, typesetting, and review of the resulting proof before it is published in its final citable form. Please note that during the production process errors may be discovered which could affect the content, and all legal disclaimers that apply to the journal pertain.
References
- Brant LJ, Fozard JL. Age changes in pure-tone hearing thresholds in a longitudinal study of normal human aging. J Acous Soc Am. 1990;88:813–829. doi: 10.1121/1.399731. [DOI] [PubMed] [Google Scholar]
- Brosch M, Schulz A, Scheich H. Processing of sound sequences in macaque auditory cortex: Response enhancement. J Neurophysiol. 1999;82:1542–1559. doi: 10.1152/jn.1999.82.3.1542. [DOI] [PubMed] [Google Scholar]
- Chen L, Trautwein PG, Shero M, Salvi RJ. Tuning, spontaneous activity and tonotopic map in chicken ganglion neurons following sound-induced hair cell loss and regeneration. Hear Res. 1996;98:152–164. doi: 10.1016/0378-5955(96)00086-x. [DOI] [PubMed] [Google Scholar]
- Culling JE, Darwin CJ. Perceptual separation of simultaneous vowels: Within and across-formant grouping by fo. J Acoust Soc Am. 1993;93:3454–3467. doi: 10.1121/1.405675. [DOI] [PubMed] [Google Scholar]
- De Boer E, Dreschler WA. Auditory psychophysics: Spectrotemporal representation of signals. Annu Rev Psychol. 1987;38:181–202. doi: 10.1146/annurev.ps.38.020187.001145. [DOI] [PubMed] [Google Scholar]
- Di Palma F, Pellegrino R, Noben-Trauth K. Genomic structure, alternative splice forms and normal and mutant alleles of cadherin 23 (cdh23) Gene. 2001;281:31–41. doi: 10.1016/s0378-1119(01)00761-2. [DOI] [PubMed] [Google Scholar]
- Egorova M, Ehret G, Vartanian I, Esser KH. Frequency response areas of neurons in the mouse inferior colliculus. I. Threshold and tuning characteristics. Exp Brain Res. 2001;140:145–161. doi: 10.1007/s002210100786. [DOI] [PubMed] [Google Scholar]
- Ehret G, Romand R. The central auditory system. Oxford University Press; New York: 1997. [Google Scholar]
- Esser KH, Condon CJ, Suga N, Kanwal JS. Syntax processing by auditory cortical neurons in the FM-FM area of the mustached bat Pteronotus parnellii. Proc Natl Acad Sci USA. 1997;94:14019–14024. doi: 10.1073/pnas.94.25.14019. [DOI] [PMC free article] [PubMed] [Google Scholar]
- Francis HW, Ryugo DK, Gorelikow MJ, Prosen CA, May BJ. The functional age of hearing loss in a mouse model of presbycusis. II. Neuroanatomical correlates. Hear Res. 2003;183:29–36. doi: 10.1016/s0378-5955(03)00212-0. [DOI] [PubMed] [Google Scholar]
- Frisina DR, Frisina RD. Speech recognition in noise and presbycusis: Relations to possible neural mechanisms. Hear Res. 1997;106:95–104. doi: 10.1016/s0378-5955(97)00006-3. [DOI] [PubMed] [Google Scholar]
- Frisina R, Walton J. Aging of the mouse central auditory system. In: Willott J, editor. Handbook of mouse auditory research: From behavior to molecular biology. CRC Press; New York: 2001. pp. 339–379. [Google Scholar]
- Fuzessery ZM, Feng AS. Mating call selectivity in the thalamus and midbrain of the leopard frog (Rana p. pipiens): Single and multiunit analyses. J Comp Physiol A: Sens, Neur, Behav Physiol. 1983;150:333–344. [Google Scholar]
- Geissler DB, Ehret G. Time-critical integration of formants for perception of communication calls in mice. Proc Natl Acad Sci USA. 2002;99:9021–9025. doi: 10.1073/pnas.122606499. [DOI] [PMC free article] [PubMed] [Google Scholar]
- Gordon-Salant S, Fitzgibbons P. Temporal factors and speech recognition in young and elderly listeners. J Speech Hear Res. 1993;36:1276–1285. doi: 10.1044/jshr.3606.1276. [DOI] [PubMed] [Google Scholar]
- Harrison R, Evans E. Reverse correlation study of cochlear filtering in normal and pathological guinea pig ears. Hear Res. 1982;6:303–314. doi: 10.1016/0378-5955(82)90062-4. [DOI] [PubMed] [Google Scholar]
- Henry KR. Aging and audition. In: Willott J, editor. The auditory psychobiology of the mouse. Charles C. Thomas; Springfield, IL: 1983. pp. 470–493. [Google Scholar]
- Henry KR, Lepkowski CM. Evoked potential correlates of genetic progressive hearing loss. Age-related changes from the ear to the inferior colliculus of C57BL/6 and CBA/CaJ mice. Acta Otolaryngol. 1978;86:366–374. doi: 10.3109/00016487809107515. [DOI] [PubMed] [Google Scholar]
- Henry KR, Chole RA. Genotypic differences in behavioral, physiological and anatomical expressions of age-related hearing loss in the laboratory mouse. Audiology. 1980;19:369–383. doi: 10.3109/00206098009070071. [DOI] [PubMed] [Google Scholar]
- Hequembourg S, Liberman MC. Spiral ligament pathology:A major aspect of age-related cochlear degeneration in C57BL/6 mice. J Assoc Res Otolaryngol. 2001;2:118–129. doi: 10.1007/s101620010075. [DOI] [PMC free article] [PubMed] [Google Scholar]
- Hirsch I, Watson C. Auditory psychophysics and perception. Annu Rev Psychol. 1996;47:461–481. doi: 10.1146/annurev.psych.47.1.461. [DOI] [PubMed] [Google Scholar]
- Humes L. Understanding the speech-understanding problems of the hearing impaired. J Am Acad Audiol. 1991;2:59–69. [PubMed] [Google Scholar]
- Johnson K, Zheng Q, Erway L. A major gene affecting age-related hearing loss is common to at least ten inbred strains of mice. Genomics. 2000;70:171–180. doi: 10.1006/geno.2000.6377. [DOI] [PubMed] [Google Scholar]
- Kaas JH, Merzenich MM, Killackey HP. The reorganization of the somatosensory cortex following peripheral nerve damage in adult and developing mammals. Annu Rev Neurosci. 1983;6:325–356. doi: 10.1146/annurev.ne.06.030183.001545. [DOI] [PubMed] [Google Scholar]
- Kaas JH, Krubitzer LA, Chino YM, Langston AL, Polley EH, Blair N. Reorganization of retinotopic cortical maps in adult mammals after lesions in the retina. Science. 1990;248:229–231. doi: 10.1126/science.2326637. [DOI] [PubMed] [Google Scholar]
- Kadia S, Wang X. Spectral integration in A1 of awake primates: Neurons with single- and multipeaked tuning characteristics. J Neurophysiol. 2003;89:1603–1622. doi: 10.1152/jn.00271.2001. [DOI] [PubMed] [Google Scholar]
- Kanwal JS, Fitzpatrick DC, Suga N. Facilitatory and inhibitory frequency tuning of combination-sensitive neurons in the primary auditory cortex of mustached bats. J Neurophysiol. 1999;82:2327–2345. doi: 10.1152/jn.1999.82.5.2327. [DOI] [PubMed] [Google Scholar]
- Leroy SA, Wenstrup JJ. Spectral integration in the inferior colliculus of the mustached bat. J Neurosci. 2000;20:8533–8541. doi: 10.1523/JNEUROSCI.20-22-08533.2000. [DOI] [PMC free article] [PubMed] [Google Scholar]
- Li HS, Borg E. Age-related loss of auditory sensitivity in two mouse genotypes. Acta Otolaryngol. 1991;111:827–834. doi: 10.3109/00016489109138418. [DOI] [PubMed] [Google Scholar]
- Liberman MC. Single-neuron labeling and chronic cochlear pathology. I. Threshold shift and characteristic-frequency shift. Hear Res. 1984;16:33–41. doi: 10.1016/0378-5955(84)90023-6. [DOI] [PubMed] [Google Scholar]
- Linden JF, Liu RC, Sahani M, Schreiner CE, Merzenich MM. Spectrotemporal structure of receptive fields in areas AI and AAF of mouse auditory cortex. J Neurophysiol. 2003;90:2660–2675. doi: 10.1152/jn.00751.2002. [DOI] [PubMed] [Google Scholar]
- Lippe W, Rubel EW. Development of the place principle: Tonotopic organization. Science. 1983;219:514–516. doi: 10.1126/science.6823550. [DOI] [PubMed] [Google Scholar]
- Margoliash D, Fortune E. Temporal and harmonic combination-sensitive neurons in the zebra finch’s HVC. J Neurosci. 1992;12:4309–4326. doi: 10.1523/JNEUROSCI.12-11-04309.1992. [DOI] [PMC free article] [PubMed] [Google Scholar]
- Marsh RA, Nataraj K, Gans D, Portfors CV, Wenstrup JJ. Auditory responses in the cochlear nucleus of awake mustached bats: Precursors to spectral integration in the auditory midbrain. J Neurophysiol. 2006;95:88–105. doi: 10.1152/jn.00634.2005. [DOI] [PMC free article] [PubMed] [Google Scholar]
- Mikaelian D. Development and degeneration of hearing in the C57BL/6 mouse: Relation of electrophysiologic responses from the round window and cochlear nucleus to cochlear anatomy and behavioral responses. Laryngoscope. 1979;89:1–15. doi: 10.1288/00005537-197901000-00001. [DOI] [PubMed] [Google Scholar]
- Mittmann DH, Wenstrup JJ. Combination-sensitive neurons in the inferior colliculus. Hear Res. 1995;90:185–191. doi: 10.1016/0378-5955(95)00164-x. [DOI] [PubMed] [Google Scholar]
- Moore B. Frequency analysis and pitch perception. In: Yost W, Popper A, Fay R, editors. Human psychophysics. Springer-Verlag; New York: 1993. pp. 56–115. [Google Scholar]
- Muller M, Hunerbein KV, Hoidis S, Smolders JWT. A physiological place-frequency map of the cochlea in the CBA/J mouse. Hear Res. 2005;202:63–73. doi: 10.1016/j.heares.2004.08.011. [DOI] [PubMed] [Google Scholar]
- Nyby J. Auditory communication in adults. In: Willott JF, editor. Handbook of mouse auditory research: From behavior to molecular biology. CRC Press; Boca Raton: 2001. pp. 3–18. [Google Scholar]
- Nyby J, Whitney G. Sound communication among adults. In: Willott J, editor. The auditory psychobiology of the mouse. Charles C Thomas; Springfield: 1983. pp. 98–130. [Google Scholar]
- Ohl F, Scheich H. Orderly cortical representation of vowels based on formant interaction. Proc Natl Acad Sci USA. 1997;94:9440–9444. doi: 10.1073/pnas.94.17.9440. [DOI] [PMC free article] [PubMed] [Google Scholar]
- Ohlemiller K, Kanwal J, Suga N. Facilitative responses to species-specific calls in cortical FM-FM neurons of the mustached bat. Neuroreport. 1996;7:1749–1755. doi: 10.1097/00001756-199607290-00011. [DOI] [PubMed] [Google Scholar]
- Paxinos G, Franklin K. The mouse brain in stereotaxic coordinates. 2. Academic Press; San Diego, CA: 2001. [Google Scholar]
- Pichora-Fuller MK, Souza PE. Effects of aging on auditory processing of speech. Int J Audiol Suppl. 2003;2:S11–16. [PubMed] [Google Scholar]
- Portfors CV. Combination sensitivity and processing of communication calls in the inferior colliculus of the Moustached Bat Pteronotus parnellii. Anais da Academia Brasileira de Ciências. 2004;76:253–257. doi: 10.1590/s0001-37652004000200010. [DOI] [PubMed] [Google Scholar]
- Portfors CV, Wenstrup JJ. Delay-tuned neurons in the inferior colliculus of the mustached bat: Implications for analyses of target distance. J Neurophysiol. 1999;82:1326–1338. doi: 10.1152/jn.1999.82.3.1326. [DOI] [PubMed] [Google Scholar]
- Portfors CV, Wenstrup JJ. Topographical distribution of delay-tuned responses in the mustached bat inferior colliculus. Hear Res. 2001a;151:95–105. doi: 10.1016/s0378-5955(00)00214-8. [DOI] [PubMed] [Google Scholar]
- Portfors CV, Wenstrup JJ. Responses to combinations of tones in the nuclei of the lateral lemniscus. J Assoc Res Otolaryngol. 2001b:104–117. doi: 10.1007/s101620010057. [DOI] [PMC free article] [PubMed] [Google Scholar]
- Portfors CV, Wenstrup JJ. Excitatory and facilitatory frequency response areas in the inferior colliculus of the mustached bat. Hear Res. 2002;168:131–138. doi: 10.1016/s0378-5955(02)00376-3. [DOI] [PubMed] [Google Scholar]
- Portfors CV, Wenstrup J. Neural processing of target distance: Transformation of combination-sensitive responses. In: Thomas J, Moss C, Vater M, editors. Advances in the study of echolocation in bats and dolphins. University of Chicago Press; Chicago, IL: 2004. pp. 141–146. [Google Scholar]
- Portfors CV, Sinex DS. Processing of communication sounds. In: Winer J, Schreiner CE, editors. The inferior colliculus. Springer-Verlag; New York: 2005. pp. 411–425. [Google Scholar]
- Portfors CV, Felix II RA. Spectral integration in the inferior colliculus of the CBA/caj mouse. Neurosci. 2005;136:1159–1170. doi: 10.1016/j.neuroscience.2005.08.031. [DOI] [PubMed] [Google Scholar]
- Rauschecker J. Cortical processing of complex sounds. Curr Opin Neurobiol. 1998;8:516–521. doi: 10.1016/s0959-4388(98)80040-8. [DOI] [PubMed] [Google Scholar]
- Rauschecker J, Tian B, Hauser M. Processing of complex sounds in the macaque nonprimary auditory cortex. Science. 1995;268:111–114. doi: 10.1126/science.7701330. [DOI] [PubMed] [Google Scholar]
- Schoonhoven R, Keijzer J, Versnel H, Prijs V. A dual filter model describing single-fiber responses to clicks in the normal and noise-damaged cochlea. J Acous Soc Am. 1994;95:2104–2121. doi: 10.1121/1.408672. [DOI] [PubMed] [Google Scholar]
- Schreiner C, Cynader M. Basic functional organization of second auditory cortical field (aii) of the cat. J Neurophysiol. 1984;51:1284–1305. doi: 10.1152/jn.1984.51.6.1284. [DOI] [PubMed] [Google Scholar]
- Shnerson A, Willott J. Development of inferior colliculus response properties in C57BL/6J mouse pups. Exp Brain Res. 1979;37:373–385. doi: 10.1007/BF00237720. [DOI] [PubMed] [Google Scholar]
- Stiebler I, Ehret G. Inferior colliculus of the house mouse. I. A quantitative study of tonotopic organization, frequency representation, and tone-threshold distribution. J Comp Neurosci. 1985;238:65–76. doi: 10.1002/cne.902380106. [DOI] [PubMed] [Google Scholar]
- Stiebler I, Neulist R, Fichtel I, Ehret G. The auditory cortex of the house mouse: Left-right differences, tonotopic organization and quantitative analysis of frequency representation. J Comp Physiol A: Sens, Neur, Behav Physiol. 1997;181:559–571. doi: 10.1007/s003590050140. [DOI] [PubMed] [Google Scholar]
- Strickland E, Viemeister N, Van Tasell D, Perminger J. Is useful speech information carried by fibers with high characteristic frequencies? J Acous Soc Am. 1994;95:497–501. doi: 10.1121/1.408343. [DOI] [PubMed] [Google Scholar]
- Suga N, O’neill W. Cortical neurons sensitive to particular combinations of information bearing elements of bio-sonar signals in the mustache bat. Science. 1978;200:778–781. doi: 10.1126/science.644320. [DOI] [PubMed] [Google Scholar]
- Suga N, O’neill WE. Neural axis representing target range in the auditory cortex of the mustache bat. Science. 1979;206:351–353. doi: 10.1126/science.482944. [DOI] [PubMed] [Google Scholar]
- Sutter M, Schreiner C. Physiology and topography of neurons with multipeaked tuning curves in cat primary auditory cortex. J Neurophysiol. 1991;65:1207–1226. doi: 10.1152/jn.1991.65.5.1207. [DOI] [PubMed] [Google Scholar]
- Weinstein BE, Ventry IM. Hearing impairment and social isolation in the elderly. J Speech Hear Res. 1982;25:593–599. doi: 10.1044/jshr.2504.593. [DOI] [PubMed] [Google Scholar]
- Wenstrup JJ, Leroy SA. Spectral integration in the inferior colliculus: Role of glycinergic inhibition in response facilitation. J Neurosci. 2001;21:1–6. doi: 10.1523/JNEUROSCI.21-03-j0002.2001. [DOI] [PMC free article] [PubMed] [Google Scholar]
- Willott JF. Changes in frequency representation in the auditory system of mice with age-related hearing impairment. Brain Res. 1984;309:159–162. doi: 10.1016/0006-8993(84)91022-9. [DOI] [PubMed] [Google Scholar]
- Willott JF. Effects of aging, hearing loss, and anatomical location on thresholds of inferior colliculus neurons in C57BL/6 and CBA mice. J Neurophysiol. 1986;56:391–408. doi: 10.1152/jn.1986.56.2.391. [DOI] [PubMed] [Google Scholar]
- Willott JF. Central physiological correlates of ageing and presbycusis in mice. Acta Otolaryngol. 1991a;476:153–156. doi: 10.3109/00016489109127271. [DOI] [PubMed] [Google Scholar]
- Willott JF. Aging and the auditory system. Singular Publishing Group, Inc; San Diego, CA: 1991b. [Google Scholar]
- Willott JF, Parham K, Hunter KP. Response properties of inferior colliculus neurons in middle-aged C57BL/6J mice with presbycusis. Hear Res. 1988;37:15–28. doi: 10.1016/0378-5955(88)90074-3. [DOI] [PubMed] [Google Scholar]
- Willott JF, Aitkin LM, Mcfadden SM. Plasticity of auditory cortex associated with sensorineural hearing loss in adult C57BL/6 mice. J Comp Neurol. 1993;329:402–411. doi: 10.1002/cne.903290310. [DOI] [PubMed] [Google Scholar]
- Willott JF, Milbrandt JC, Bross LS, Caspary DM. Glycine immunoreactivity and receptor binding in the cochlear nucleus of C57BL/6J and CBA/CaJ mice: Effects of cochlear impairment and aging. J Comp Neurol. 1997;385:405–414. [PubMed] [Google Scholar]
- Young E, Davis K. Circuitry and function of the dorsal cochlear nucleus. In: Oertel D, Fay R, Popper A, editors. Integrative functions in the mammalian auditory pathway. Springer-Verlag; New York: 2002. pp. 160–206. [Google Scholar]