

Abstract
This laboratory has previously reported on the development of a flow cytometry-based method for scoring in vitro micronuclei in mouse lymphoma (L5178Y) cells [Avlasevich et al., Environ. Molec. Mutagen. 47 (2006) 56-66]. With this method, necrotic and mid/late stage apoptotic cells are labeled with the fluorescent dye ethidium monoazide. Cells are then washed, stripped of their cytoplasmic membranes, and incubated with RNase plus a pan-nucleic acid dye (SYTOX Green). This process provides a suspension of free nuclei and micronuclei that are differentially stained relative to chromatin associated with dead/dying cells. The current report extends this line of investigation to include the human cell line TK6. Additionally, methods are described that facilitate simultaneous quantitative analysis of cytotoxicity, perturbations to the cell cycle, and what we hypothesize is aneuploidization. This comprehensive cytogenetic damage assay was evaluated with the following diverse agents: etoposide, ionizing radiation, methyl methanesulfonate, vinblastine, ethanol, and staurosporine. Cells were harvested after 30 hrs of continuous treatment (in the case of chemicals), or following graded doses of radiation up to 1 Gy. Key findings include the following: (1) Significant discrepancies in top dose selection were found for five of the six agents studied when relative survival measurements were based on Coulter counting versus flow cytometry. (2) Both microscopy- and flow cytometry-based scoring methods detected dose-dependent micronucleus formation for the four genotoxic agents studied, whereas no significant increases were observed for the presumed non-genotoxicants ethanol and staurosporine when top dose selection was based on flow cytometric indices of cytotoxicity. (3) SYTOX and ethidium monoazide fluorescence signals conveyed cell cycle and cell death information, respectively, and appear to represent valuable aids for interpreting micronucleus data. (4) The frequency of hypodiploid nuclei increased in response to each of the genotoxic agents studied, but not following exposure to ethanol or staurosporine. Collectively, these results indicate that a comprehensive assessment of genotoxicity and other test article-induced toxicities can be acquired simultaneously using a simple two-color flow cytometry-based technique.
Keywords: Genotoxicity, Micronuclei, Cytotoxicity, Aneuploidy, Flow cytometry, Nondisjunction
1. Introduction
The in vitro micronucleus test is widely used to assess cytogenetic damage in mammalian cells [1-4]. Its popularity is due, in large part, to the fact that it can be executed with less technical expertise relative to chromosome aberration analyses. In this system, chromosome fragments or lagging whole chromosomes become detectable in the cytoplasm of cells that have undergone division as micronuclei (MN). Thus, in the basic conduct of the assay, the MN endpoint is sensitive not only to clastogens, but also to aneugens that interfere with the migration of chromosomes to spindle poles.
In addition to chromosome lag, aneuploidy can also occur through nondisjuction of homologous chromosomes or sister chromatids, a mechanism that is thought to be more prevalent than lagging chromosomes [5-7]. Unlike lagging chromosomes, nondisjunction is not detected by the conventional micronucleus assay, as this malsegregated chromatin is incorporated into newly formed nuclei [8]. Rather, information regarding nondisjuction is usually available only from specialized micronucleus assays whereby cytochalasin B is used to block cytokinesis, chromosome-specific probe(s) are applied, and the segregation patterns of the chromosome(s) are measured in binucleated cells [7, 9].
Given the relative simplicity of the MN endpoint, coupled with the ability to adapt the assay to examine mode of action, it is not surprising that numerous attempts have been made to replace microscopy-based scoring with an automated approach. These methods are based on image analysis, laser scanning cytometry, or flow cytometry [10-20].
This laboratory has expanded upon the flow cytometric procedure of Nüsse and colleagues by incorporating an ethidium monoazide bromide (EMA) staining step in order to label the chromatin of necrotic and mid/late stage apoptotic cells. Subsequent stripping of cytoplasmic membranes and incubation with the pan-nucleic acid dye SYTOX Green (plus RNase) provides a suspension of free nuclei and MN that are differentially stained relative to chromatin associated with dead/dying cells. Using this system, good agreement between microscopy- and flow cytometry-based scoring was reported for mouse L5178Y cells [20].
The experiments described herein where designed to further evaluate this MN scoring system by testing its compatibility with human TK6 cells, a lymphoblastoid cell line that was derived from the spleen of 5 year-old male with hereditary spherocytosis [21]. In the context of the current study, it is noteworthy that these cells have wild-type p53 status, a feature that some groups speculate may help reduce the frequency of false positive results [22]. Other aims were to develop and assess the utility of simultaneous flow cytometric measurements of cytotoxicity, perturbations to the cell cycle, and induction of aneuploidy.
For these experiments, cells were treated with each one of the diverse genotoxic agents etoposide (ETOPO), ionizing radiation, methyl methanesulfonate (MMS), and vinblastine (VB), or the presumed non-genotoxicants ethanol (EtOH) or staurosporine (STS). Resulting flow cytometric data are presented, along with parallel microscopy-based MN measurements. Experimental indices of cytotoxicity and aneuploidization are also presented, as well as a discussion of their potential to convey a more complete understanding of cellular responses to genotoxic versus non-genotoxic agents.
2. Materials and methods
2.1. Reagents
Test chemicals were purchased from Sigma-Aldrich, St. Louis, MO.; pertinent information, including choice of solvent, is provided in Table I. Sucrose (CAS No. 57-50-1), sodium citrate (CAS No. 6132-04-3), citric acid (CAS No. 77-92-9), RNase A (cat. no. R-5125), IGEPAL CA-630 (CAS No. 9036-19-5), methanol (CAS No. 67-56-1), acridine orange (CAS No. 65-61-2) and propidium iodide (CAS No. 25535-16-4) were also from Sigma-Aldrich. NaCl (CAS No. 7647-14-5) and dimethylsulfoxide (CAS No. 67-68-5) were purchased from J.T. Baker, Phillipsburg, NJ. The fluorescent dyes ethidium monoazide bromide (CAS No. 58880-05-0) and SYTOX Green (cat. no. S7020), as well as 6 micron fluorescent beads (cat. no. P14828) were obtained from Invitrogen, Carlsbad, CA. Anti-phospho-histone H3 (Ser10) antibody, Alexa Fluor 488 conjugate (cat. no. 9708) was from Cell Signaling, Danvers, MA.
Table I.
Agents, Presumptive Mode(s) of Action
| Agent | Cas No. | Solvent | Mode of Action [Citation] |
|---|---|---|---|
| Etoposide | 33419-42-0 | DMSO | dsDNA breaks [39], nondisj [31] |
| Ionizing irradiation | N/A | N/A | dsDNA breaks [40], nondisj [32] |
| Methyl methanesulfonate | 66-27-3 | water | dsDNA breaks [5] |
| Vinblastine sulfate | 143-67-9 | DMSO | chromosome lag [41], nondisj [42] |
| Ethanol | 64-17-5 | Water | non-genotoxicant |
| Staurosporine | 62996-74-1 | DMSO | apoptogen, “irrelevant positive” [43] |
Abbreviations: DMSO = dimethylsulfoxidel dsDNA = double standed DNA; nondisjunction = nondisj; N/A = not applicable
The flow cytometric method used to score MN required three solutions. “EMA dye solution” consisted of 8.5 μg EMA/ml, and was prepared in PBS + 2% fetal bovine serum. “Lysis solution 1” was prepared with deionized water, and consisted of 0.584 mg NaCl/ml, 1 mg sodium citrate/ml, 0.3 μl IGEPAL/ml, 0.5 mg RNase A/ml, and 0.4 μM SYTOX Green. “Lysis solution 2” was prepared with deionized water, 85.6 mg sucrose/ml, 15 mg citric acid/ml, and 0.4 μM SYTOX Green.
2.2. Cells and culture medium
TK6 cells were purchased from American Type Culture Collection (ATCC; Manassas, VA). Cells were grown in culture medium at 37°C, 5% CO2, and in a humid atmosphere. For routine culturing, the cells were maintained between approximately 1 × 10⁴ and 1 × 10⁶ cells/ml. The culture medium consisted of RPMI 1640 supplemented with 200 mM l-glutamine, 100 IU penicillin and 100 μg/ml streptomycin, to which heat-inactivated horse serum was added for 10% v/v final concentration (all from MediaTech, Herndon, VA).
2.3. Treatment with drugs or radiation
Prior to treatment, logarithmically growing cells were adjusted to 1.5 × 10⁵/ml with culture medium, and 10 ml aliquots were transferred to T25 culture flasks. All treatments occurred in duplicate. For chemical agents, stock solutions were prepared such that a consistent volume of solvent was added to each flask (1% v/v in the case of aqueous solvents, 0.1% v/v in the case of DMSO). For radiation, cells were treated with a Shephard Irradiator, equipped with a 6000 Ci 137Cs source. The dose rate was 272.5 cGy/min. In all cases, cells were incubated at 37°C for 30 hrs (the length of time that is approximately 2.5 doubling times for untreated cells, as recommended by the IWGT expert working group [1]).
2.4. Relative survival measurements
At the 30 hr harvest time, cells were resuspended by pipetting each culture several times. Immediately after pipetting, 500 μl were transferred to cuvettes containing 10 ml Isoton II Diluent (Beckman Coulter). Cell densities were measured with a Coulter counter, model ZM, and relative survival calculations were made based on concurrent solvent or sham irradiated cultures.
After removing 500 μl for Coulter measures, a 500 μl suspension of diluted latex particles, 6 μ “counting beads”, was added to each culture. (Counting beads are frequently used for flow cytometry applications that require absolute counts [23].) The diluted bead suspension was prepared by adding 4 drops of stock beads to 10 ml culture medium. As counting beads were present throughout the remaining cell processing steps, nuclei to bead ratios could be determined for each sample, and were used to calculate relative survival measurements. Note that only nuclei that exhibited healthy cells' light scatter and EMA-negative staining characteristics were included in these measurements. As with the Coulter counts, relative survival calculations were made based on concurrent solvent or sham irradiated cultures.
2.5. Top dose selection
Unpublished data from experiments with L5178Y cells suggest that there may be advantages to basing top dose selection on two flow cytometric measurements of cytotoxicity, as these assessments tended to reveal toxicity that was not evident from Coulter counts. For the TK6 experiments described herein, we tested this same approach. More specifically, relative survival measurements based on Coulter counts were considered a first approximation of top dose—i.e., treatments that exhibited mean relative survival ≥ 40% were carried forward for further processing. MN and other measurements are presented for each dose selected by this method. For additional consideration, data are also interpreted in the context of an alternate top dose selection strategy that is based on flow cytometric analysis. With this strategy, treatments were deemed too cytotoxic if they either: 1) reduced mean relative survival below 40% (based on nuclei/bead ratios), or 2) elevated the average frequency of EMA-positive events ≥ 3-fold relative to the negative control cultures.
2.6. Micronucleus scoring via microscopy
For those cultures that exhibited average relative survival ≥ 40% based on Coulter counts, 2.5 × 10⁵ cells were collected by centrifugation and were applied to slides via a Wescore Cytopro 7620 cytocentrifuge (500 rpm, 5 minutes, low acceleration). Slides were submerged in absolute methanol for 10 min and then stored in the dark until staining. Staining was accomplished by submerging slides for 60 sec in an acridine orange solution (0.125 μg/ml, prepared in PBS). An Olympus BH-2 fluorescence microscope was used for MN measurements at 400x magnification. For each culture, 2000 mononucleated, non-apoptotic, non-necrotic cells were analyzed for the presence of MN (2000 cells per culture × duplicate cultures = 4000 cells per chemical concentration). For a cell to be scored as MN-containing, the MN event(s) had to be approximately round in shape, exhibit similar staining characteristics as the main nucleus, be less than 1/3 the size of the main nucleus, and could touch but not overlap the main nucleus (HUMN criteria, [24]).
2.7. Flow cytometric scoring of MN
2.7.1. Cell harvest, staining and lysis
Based on Coulter counts, 5 × 10⁵ cells were transferred to 15 ml polypropylene tubes for flow cytometric processing steps. As with slide preparation, this was performed only for those cultures that exhibited mean relative survival ≥ 40% as determined by Coulter counts. Cells were collected via centrifugation at approximately 600 × g for 5 min. Supernatants were aspirated, and cells were resuspended with gentle tapping. 300 μl of EMA dye solution were added to each tube, which were then placed in racks and submerged to a depth of approximately 2 cm in crushed ice. A visible light source (fluorescent bulb) was positioned approximately 10 cm above the level of the cell suspensions for 30 min.
After the photoactivation period, 3 ml of ice-cold PBS + 2% fetal bovine serum solution were added to each sample. From this point forward, exposure of samples to light was minimized through the use of aluminum foil shielding. The cells were collected via centrifugation, and the supernatants aspirated such that approximately 50 μl of supernatant remained per tube. The cells were gently resuspended with tapping, and maintained at room temperature until the following procedures were initiated (within 30 min). 500 μl of Lysis Solution 1 were added slowly (2-3 sec) to one tube at a time. Upon addition, each tube was immediately vortexed (medium setting) for 5 sec. These samples were kept at room temperature for 1 hr. At this time, 500 μl of Lysis Solution 2 were injected forcefully into one tube at a time, which was immediately vortexed for 5 sec. These specimens were maintained at room temperature for 30 min. Samples were then stored at 4°C until FCM analysis (accomplished within one day of the cell harvest/staining/lysis procedures).
2.7.2. Instrumentation and gating
Samples were protected from light and allowed to equilibrate to room temperature before flow cytometric analysis occurred. Particles were resuspended immediately before analysis with gentle pipetting. Data acquisition was accomplished with a single-laser flow cytometer, 488 nm excitation (FACSCalibur, BD Biosciences, San Jose, CA). Instrumentation settings and data acquisition/analysis were controlled with CellQuest software v3.3 (BD Biosciences). SYTOX-associated fluorescence emission was collected in the FL1 channel (530/30 band-pass filter), and EMA-associated fluorescence was collected in the FL3 channel (670 long-pass filter). Events were triggered on FL1 fluorescence. The FCM gating strategy developed for this MN scoring application required events to meet each of six criteria before they were scored as nuclei or MN (see Fig 1). The incidence of MN was determined through the acquisition of at least 20,000 gated nuclei per culture. As with microscopy-based measurements, MN induction is expressed herein as mean fold increase relative to concurrent negative control.
Figure 1.
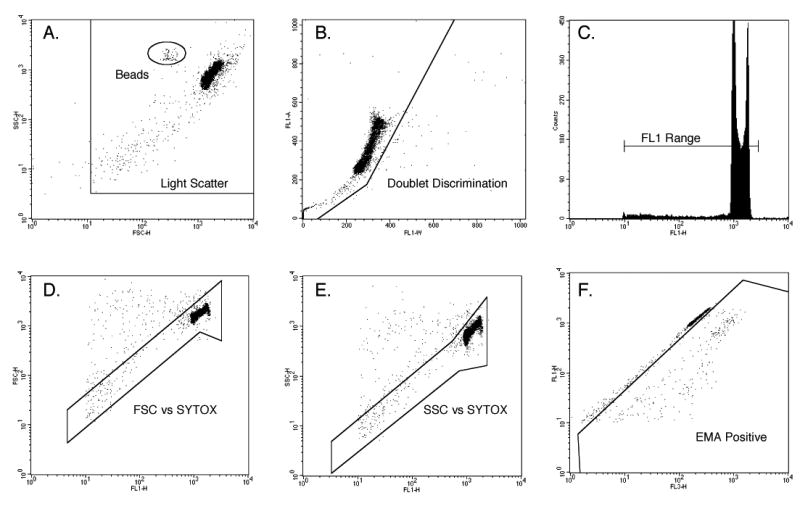
Histogram and bivariate plots of TK6 nuclei and other subcellular particles as analyzed by flow cytometry. These panels illustrate the gating strategy used to discriminate nuclei and micronuclei from apoptotic chromatin as well as other spurious events. In order for events to be scored as nuclei or micronuclei, they needed to meet each of the following six criteria: within a side scatter vs. forward scatter region, panel A; within a region that excludes doublets, plot B; at least 1/100 the SYTOX-associated fluorescence as G1 nuclei, panel C; within a region that excludes doublets, plot C; within a forward scatter vs. SYTOX fluorescence region, plot D; within a side scatter vs. SYTOX fluorescence region, plot E; ethidium monoazide-negative, panel F. Note that once the dimensions and locations of these regions were set, they were not varied within or between experiments.
2.8. Metaphase analyses
For the ETOPO, MMS, VB, and STS experiments, a portion of each cell suspension was removed and treated with 10 μg colcemid/ml 27 hours after treatment was initiated. These cells were reincubated at 37°C for 3 hrs at which time 1 × 10⁶ cells per culture were fixed with −20°C ethanol, 70% v/v. Cells were stored at −20°C until flow cytometric analysis. On the day of analysis, cells were labeled with anti-phospho-histone H3 antibody and stained with propidium iodide, basically as described by Muehlbauer and Schuler [25], but with one less centrifugation/washing step due to our use of directly conjugated antibody; hereafter this is referred to as the “phospho-H3 assay”. The stop mode was set so that 2000 metaphase cells per culture were evaluated for DNA content.
2.9. Statistics, and criteria for negative and positive calls
All frequencies, averages, and fold-increase calculations were made with Excel Office X for Mac® (Microsoft, Seattle, WA). As the most likely use of an automated MN scoring assay such as the one described herein is in the context of early screening programs, we utilized a simple a priori approach to signify negative and positive responses. That is, significant induction of MN and EMA+ events was taken to be ≥ 3-fold mean increase over concurrent negative control. For those agents that exhibited significant MN induction, agreement between scoring methods was considered with non-parametric Spearman's coefficients (rs) (JMP Software, v5 for Mac®; SAS Institute, Cary, NC). These coefficients were calculated by comparing each microscopy-based MN frequency to the corresponding flow cytometric measurement for each replicate culture, and on a per experiment basis.
3. Results
3.1. Preliminary observations
TK6 cultures were found to be compatible with cell staining and lysis procedures, as a high degree of resolution was observed among MN events, nuclei, and the chromatin of dead/dying cells (Fig 1). The gating approach used for L5178Y cells was suitable for this human cell line (Fig 2).
Figure 2.
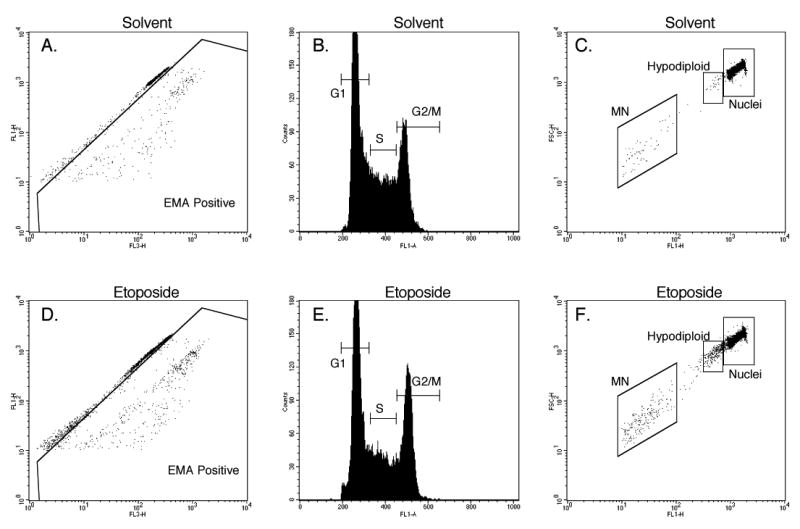
Histogram and bivariate plots of TK6 nuclei and other subcellular particles as analyzed by flow cytometry.
Panels A and D: this bivariate plot was used to quantify the percentage of EMA-positive events. Only events that fell within the side scatter vs. forward scatter region (Fig. 1A) and a region that excludes doublets (Fig. 1B) are plotted and used in the %EMA-positive calculation.
Panels B and E: this SYTOX fluorescence histogram was used to quantitatively evaluate cell cycle distribution. These gated events had to exhibit light scatter and fluorescence characteristics of healthy nuclei as illustrated by Fig 1.
Panel C and F: this bivariate plot was used to quantify the incidence of nuclei, hypodiploid nuclei, and micronuclei (MN). These gated events had to exhibit light scatter and fluorescence characteristics of healthy cells as illustrated by Fig 1.
Beyond enumeration of MN events, it was also of interest to evaluate whether other significant cellular parameters could be simultaneously measured with this flow cytometric procedure (see Table II). For instance, a linear scale presentation of SYTOX fluorescence appeared to be capable of supplying information regarding cell cycle effects (see Figs 2b and 2e). In an effort to integrate a flow cytometry-based measure of relative survival with MN enumeration, we employed latex particles as counting beads. These latex particles were readily distinguished from nuclei and sub-2n particles based on side scatter vs. forward scatter bivariate plots (see Fig 1a). EMA-positive chromatin was well resolved on FL1 vs FL3 bivariate plots, and the frequency of these events was recorded to provide an indication of apoptosis and necrosis.
Table II.
Flow Cytometric Endpoints
| Endpoint | Measure of |
|---|---|
| Micronucleus frequency | DNA double-strand breaks and/or chromosome lag |
| EMA-negative nuclei : bead ratio | Cytotoxicity (relative survival) |
| EMA-positive event frequency | Cytotoxicity (apopotosis and/or necrosis) |
| Perturbations to SYTOX fluorescence | Cytotoxicity (cell cycle effects) |
| Hypodiploid nuclei frequency | Aneuploidization (although apoptosis can not be ruled out) |
Abbreviations: EMA = ethidium monoazide bromide
Finally, it became evident early in our work with TK6 cells that certain treatments generated a population of nuclei that shared the light scatter characteristics and EMA-negative phenotype of healthy cells' nuclei, but that exhibited hypodiploid status as evidenced by a somewhat reduced SYTOX fluorescence intensity. As illustrated by Figs 2c and 2f, we quantified these “hypodiploid nuclei” in each experiment, tentatively characterizing these events as evidence of aneuploidization.
3.2. Quantitative analyses
3.2.1. Etoposide
Both Coulter counting and flow cytometry selected 25 ng/ml as an appropriate top concentration, with mean relative survival falling in the range 40 to 50% (see Fig 3a). MN frequencies showed dose-related increases when measured by flow cytometry or microscopy (Fig 4a). Good agreement between the methodologies was evident from an rs value of 0.8733.
Figure 3.
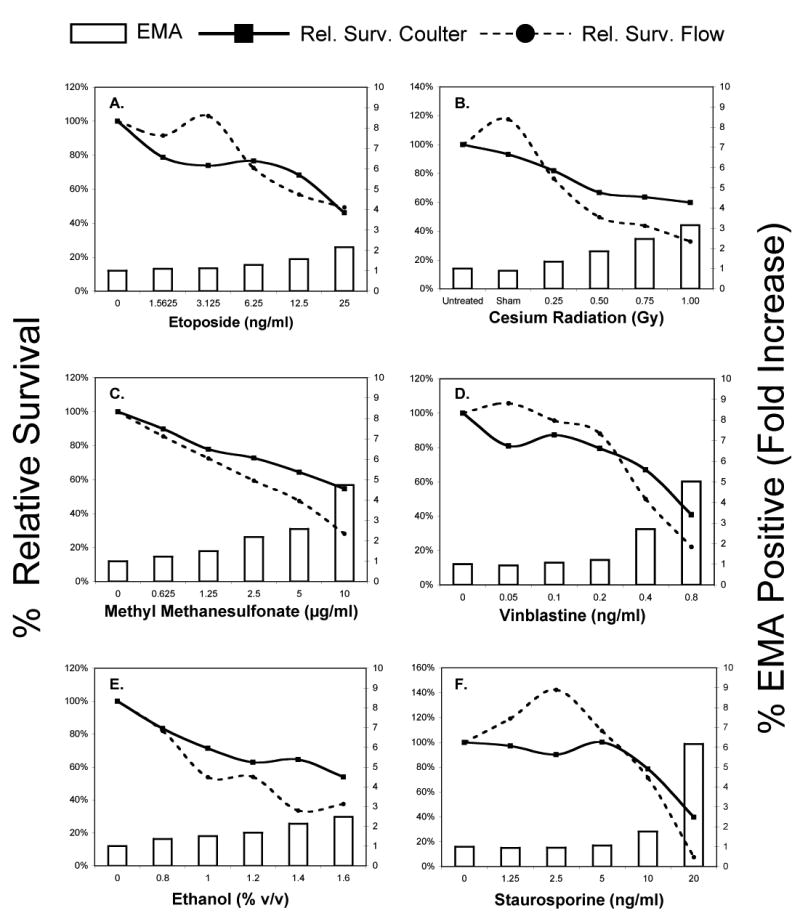
Cytotoxicity data are graphed for each of six test agents studied. The Y-axis shows mean relative survival as determined by Coulter counter (solid line) and also measured by flow cytometry in conjunction with counting beads (dashed line). Mean percentages of EMA-positive events (white bars) are graphed on the YY-axis (bars).
Figure 4.
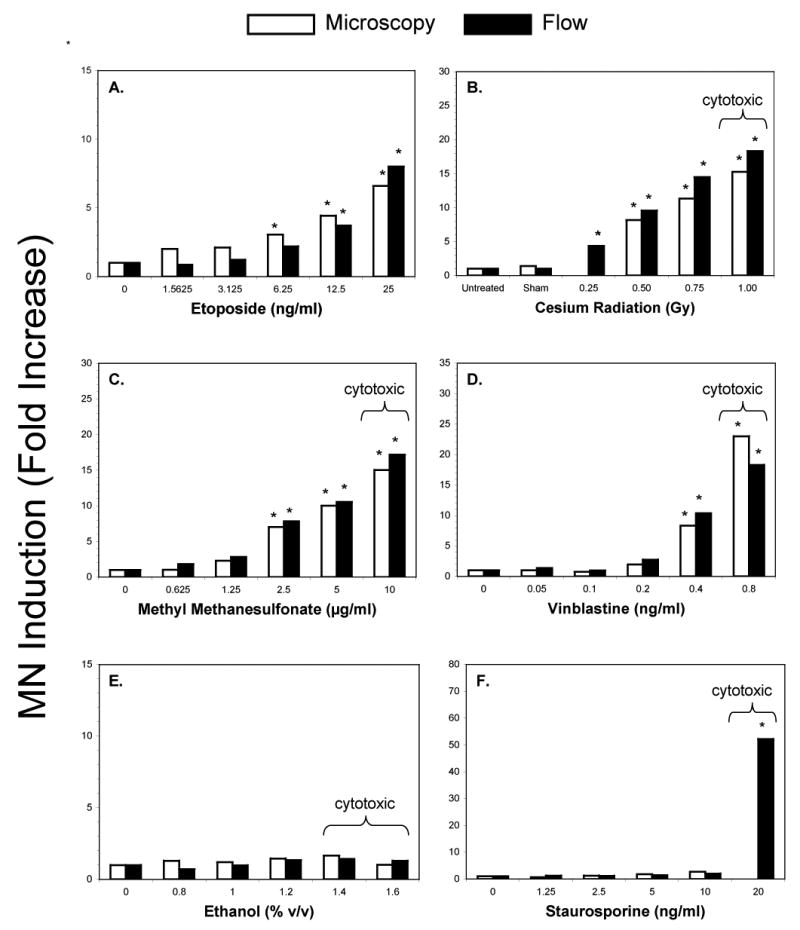
Micronucleus data are graphed for each of six test agents studied. Mean micronucleus responses (fold-increase values) are shown for microscopy-based measurements (white bars) and also for flow cytometry-based assessments (black bars). Asterisks indicate average fold-increases ≥ 3x over negative control. All dose levels that exhibited ≥ 40% relative survival as measured by Coulter counter are shown here. Doses that were deemed inappropriately high based on flow cytometric analyses are indicated by a bracket and the word “cytotoxic”.
Whereas ETOPO modestly affected the frequency of EMA-positive events, other flow cytometric endpoints were markedly altered. There was a lower fraction of cells in S phase, with a concomitant accumulation of cells in G2/M (see Fig 5a). Additionally, a robust dose-related increase in the frequency of hypodiploid nuclei was observed, with > 3-fold increase in hypodiploid nuclei evident at 6.25 ng/ml (see Fig 6a).
Figure 5.
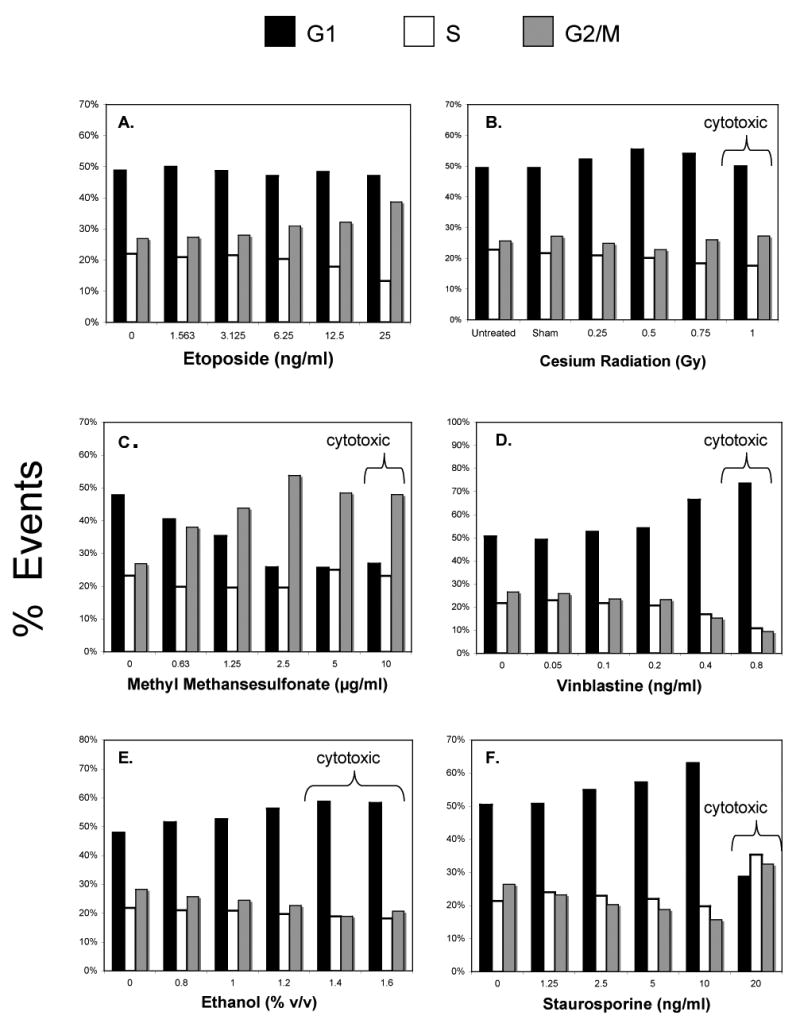
Cell cycle distribution data are graphed for each of the six test agents studied. All dose levels that exhibited ≥ 40% relative survival as measured by Coulter counter are shown here. Doses that were deemed inappropriately high based on flow cytometric analyses are indicated by a bracket and the word “cytotoxic”.
Figure 6.
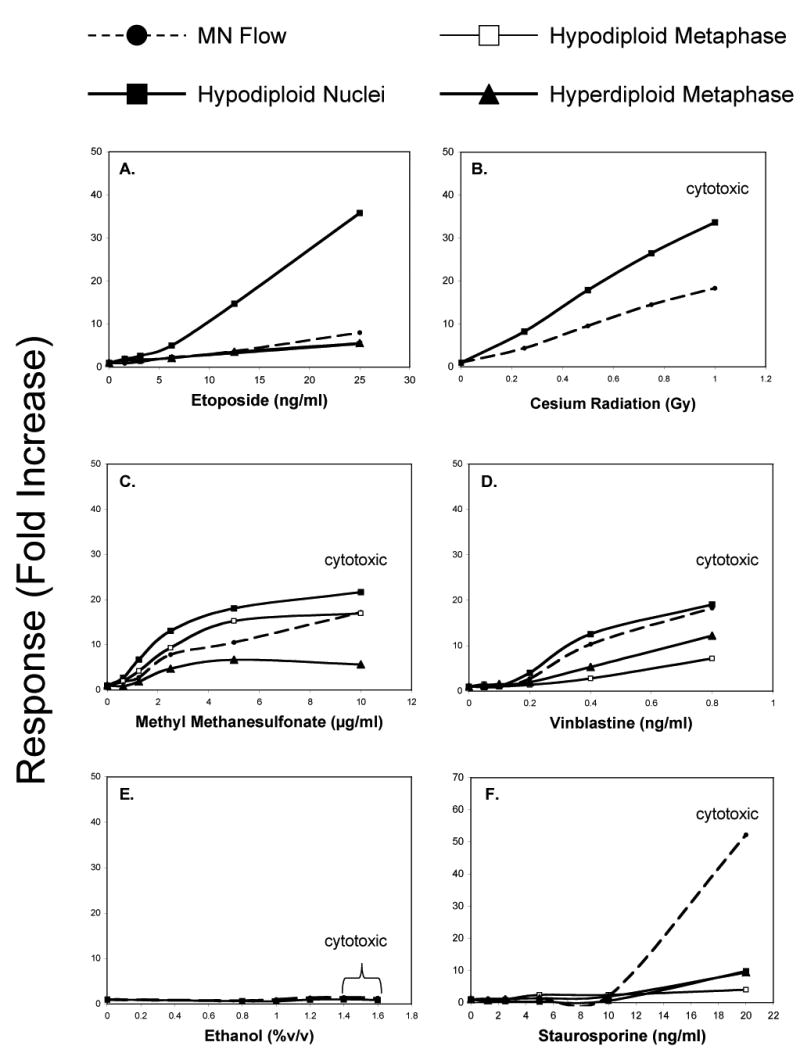
Hypodiploid nuclei responses, presented here as average fold-increase, are graphed for each of six test agents studied. To facilitate direct comparisons with micronucleus induction, this endpoint is also presented here as mean fold-increase. For several agents, the phospho-H3 assay was performed, and the induction or hypodiploid and hyperdiploid metaphase cells are graphed. All dose levels that exhibited ≥ 40% relative survival as measured by Coulter counter are shown here. Doses that were deemed inappropriately high based on flow cytometric analyses are indicated by the word “cytotoxic”.
Two microscopy-based observations are worth noting: first, treated cultures exhibited markedly more cells with two or more nuclei (15.7 fold-increase at 25 ng/ml); secondly, many of the bi- and otherwise multi-nucleated cells were observed to exhibit unequally sized nuclei.
To investigate this further, the frequency of dividing cells that exhibited hyper- and hypodiploid status was measured using the phospho-H3 assay. As shown in Fig 6a, ETOPO affected the frequency of hypodiploid and hyperdiploid metaphase cells, causing a dose-related increase over the range of concentrations tested.
3.2.2. Ionizing radiation
Gamma irradiation produced quite divergent relative growth profiles when measurements were based on Coulter counting or flow cytometry, with the latter method indicating pronounced cytotoxicity for the 1 Gy exposure level (Fig 3b). The percentage of EMA-positive events at 1 Gy also provided evidence that an unacceptable level of toxicity was reached. Irradiated cells exhibited a dose-dependent increase in MN formation (Fig 4b). Good agreement between methodologies was observed, as evidenced by an rs value of 0.9286.
A modest perturbation to the cell cycle was characterized by a dose-dependent reduction to S-phase cells (Fig 5b). The frequency of hypodiploid nuclei was highly elevated in irradiated cultures. When based on fold-increase, this endpoint was more responsive to irradiation compared to flow cytometric enumeration of MN (see Fig 6b). This suggestion of aneuploidization was reinforced by observations made by microscopy, which revealed an increased incidence of multinucleated cells 30 hrs post-irradiation (7.2-fold mean increase at 0.75 Gy).
3.2.3. Methyl methanesulfonate
MMS treatment resulted in relative survival calculations that differed significantly between scoring methods, with flow cytometry revealing more pronounced cytotoxicity. Additional evidence of excessive cytotoxicity is provided by a greater than 3-fold increase in EMA-positive events at the 10 μg/ml concentration (see Fig 3c). Dose-dependent increases in MN frequencies were obtained by microscopy and flow cytometry (Fig 4c). Agreement between methods is demonstrated by an rs value of 0.9684.
Continuous MMS treatment resulted in an accumulation of G2/M events (Fig 5c). Regarding the generation of hypodiploid nuclei, a dose-related increase was observed (Fig 6c). MMS treatment also led to elevated frequencies of multinucleated cells (8.6-fold increase at the 5 μg/ml, as determined by microscopic scoring). Furthermore, multipole mitotic figures were evident, some of which clearly exhibited non-uniformly distributed chromosomes.
The phospho-H3 assay was used to investigate the possibility of aneugenic activity. These results are presented in Fig 6c, and illustrate dose-dependent increases for both hyper- and hypo-diploid metaphase cells.
3.2.4. Vinblastine
In contrast to flow cytometric data, Coulter-based relative survival measurements did not indicate excessive cytotoxicity at the highest concentration tested. Another indication of significant cytotoxicity was the 5.3-fold mean increase in EMA-positive events that was observed at 0.8 ng/ml. Continuous treatment with VB resulted in a dose-dependent increase in MN formation, irrespective of scoring methodology (Fig 4d). Agreement between methods is demonstrated by an rs value of 0.8752.
Cell cycle analyses indicate that the proportion of cells in G1 was markedly increased at the two highest concentrations studied (Fig 5d). The frequency of nuclei falling in the “hypodiploid” region was also elevated, showing somewhat higher fold-increases compared to MN induction (Fig 6d). This suggestion of aneuploidization was reinforced by observations made by microscopy, as VB treatment led to elevated frequencies of multinucleated cells (13.7-fold increase at 0.4 ng/ml). VB was also observed to markedly affect the frequency of hypodiploid and hyperdiploid metaphase cells (Fig 6d).
3.2.5. Ethanol
The cytotoxicity threshold of 60% was not achieved for EtOH exposure up to 1.6% v/v when relative survival measurements were based on Coulter counts. In contrast, the top two concentrations were considered inappropriately high when relative survival assessment was based on flow cytometric scoring. No indication of MN induction was evident for microcopy or automated scoring procedures (Fig 3e).
The progression of cells through the cell cycle was affected in a concentration-dependent manner, as reduced proportions of S and G2/M cells were evident (Fig 5e). EtOH had no effect on the frequency of hypodiploid nuclei (Fig 6e) or multinucleated cells at any of the concentrations studied.
3.2.6. Staurosporine
Using the Coulter method, the top dose of STS (20 ng/ml) demonstrated 40% relative survival. However, at this same concentration, relative survival based on flow cytometric analysis yielded an appreciably lower value—7%. Furthermore, %EMA-positive events were markedly elevated at this concentration cytotoxicity (Fig 3f). At concentrations up to and including 10 ng/ml, MN induction was not observed for microscopic or flow cytometric scoring (Fig 4f). Flow cytometry did register a significant increase in MN frequency, but only at the cytotoxic concentration of 20 ng/ml. (Note that MN could not be reliably scored by microscopy at this concentration, as the total number of intact cells with regularly shaped nuclei was deemed too low.)
At concentrations ≤ 10 ng/ml, cell cycle effects were modest (Fig 5f). On the other hand, 20 ng/ml affected the cell cycle so severely that quantitative assessments must be qualified as unreliable. Hypodiploid nuclei were not induced by concentrations ≤ 10 ng/ml. At the highly cytotoxic level of 20 ng/ml, significantly elevated values were recorded, but again their relevance is questionable, as there were qualitative differences to these fluorescence plots compared to those associated with the other agents studied.
Regarding microscopic assessment of multinucleation, STS had no discernable effect at concentrations ≤ 10 ng/ml. Although the frequency of multinucleated cells appeared to be elevated in 20 ng/ml cultures, as noted above, these slides were judged too difficult to score in a reliable and quantitative manner. As was observed with the hypodiploid nuclei endpoint, the frequencies of hypodiploid and hyperdiploid metaphase cells were not significantly elevated until 20 ng/ml (Fig 6f).
4. Discussion
Data presented herein suggest that the flow cytometry-based MN scoring system, initially developed with mouse L5178Y cells [20], is directly transferable to human TK6 cells. These automated analyses were typically accomplished within 2 to 3 minutes per sample, and were capable of discriminating genotoxicants from non-genotoxicants. Importantly, the non-genotoxicants were shown to be negative for MN induction even at cytotoxic concentrations, but as exemplified by STS, this required a new approach to top dose selection.
Development and refinement of this in vitro micronucleus scoring system is occurring during a time when the performance characteristics of standard genotoxicity assays and batteries have come under heavy criticism [22]. Especially relevant to the currently described method, a report by Kirkland et al. indicates that the occurrence of irrelevant positive results for mammalian in vitro genotoxicity assays is unacceptably high [26]. This encouraged us to focus a large part of our efforts on establishing methods that would guard against false positive judgments. Excessive cytotoxicity is thought to represent a primary cause of such results [22, 27-29]. Thus, a major focus of our assay development work has been the establishment of a high information-content assay, information that is useful for setting appropriate top dose levels, and that is also valuable for interpreting MN data.
Based on the present data, as well as those collected recently with L5178Y cells, we conclude that relative survival measurements may be useful for selecting top dose. However, at least in our hands, this measurement should not be based on Coulter counter, but rather a more stringent methodology such as the counting bead approach described herein. This latter method was found to be more sensitive for 5 of 6 agents tested here. These and other unpublished observations have led us to conclude that this approach reveals cytotoxicity that alternative methods, including Coulter counting, total protein, total DNA, or ATP levels, often under-represent. We believe that the more sensitive nature of flow cytometry-based relative survival is related to the several criteria (including two light scatter and two fluorescence parameters) that liberated nuclei must exhibit in order to be included in this calculation.
Beyond relative survival measurements accomplished by flow cytometry, this MN scoring method provides simultaneous cytotoxicity assessments that appear to have significant merit. STS data are a good case in point. Coulter counting would have suggested a top concentration of 20 ng/ml, a dose level associated with a markedly elevated MN value when scored by flow cytometry. However, each of the four concurrent cytotoxicity analyses provided by flow cytometry demonstrated an inappropriately high level of toxicity. Observations made by microscopy for the 20 ng/ml cultures confirmed these assessments. Thus, at a minimum, these MN data would need to be strongly qualified as having occurred in the context of severe cytotoxicity.
Regarding the flow cytometric enumeration of hypodiploid nuclei, further experimentation is warranted. We speculate that these events are related to microscope observations of increased binucleated cell frequency (binucleation that was often associated with unequally-sized nuclei). We further hypothesize that both of these phenomena are related to aneuploidization. While we have not conclusively ruled out the possibility that apoptosis may have caused a significant portion of nuclei to exhibit these SYTOX dye staining characteristics, the collective data presented herein do not support this conclusion. First, light scatter and EMA-staining characteristics of these nuclei matched that of “healthy” cells' nuclei. Secondly, a chromosome scoring technique (phospho-H3 assay) indicated that hypodiploid nuclei responses were always observed in conjunction with increased frequencies of hypo- and hyper-diploid metaphase cells. Thirdly, hypodiploid nuclei responses always occurred in conjunction with elevated frequencies of multinucleated cells, a hallmark of aneugenic activity [30]. Finally, the cytotoxicants EtOH and STS did not cause dose-related increases in the frequency of hypodiploid nuclei, whereas each of the four genotoxic agents did. The ability of ETOPO, radiation, and VB to cause nondisjunction has been well documented [31-33]. While we had not anticipated MMS to exhibit aneuploid phenomena, there are reports of this and other alkylating agents having such effects [34-35].
We speculate that there may be a common mechanism that explains binucleation and the appearance of hypodiploid nuclei, one that is related to recent findings reported by Shi and King [36]. They estimated that approximately 94% of cells that failed cytokinesis exhibited nondisjunction in the preceding mitosis. As documented by many investigators, extra chromosome and centrosome content sets the stage for multipole division, and this is a mechanism that promotes rapid acquisition of aneuploid status [37-38]. We hypothesize that the lysis procedure used for flow cytometric MN scoring is capable of revealing the consequence of nondisjunction events, as hypodiploid daughter nuclei are apparent as sub-2n DNA events with the light scatter and DNA staining characteristics of “healthy” cells' nuclei. Recent reports suggest that some agents may cause nondisjunction at concentrations that are significantly lower than those required to induce MN [5, 7, 9]. This suggests that an efficient and cost-effective assay that detects nondisjunction would be a valuable addition to hazard identification and risk assessment programs. At this time, the degree to which the hypodiploid nuclei endpoint may serve such a function is a matter of speculation. Experimentation with additional chemical agents and the use of other assay techniques, for instance FISH to follow the segregation of specific chromosomes, will be necessary before the utility of this endpoint is understood with more certainty.
In summary, the data presented herein suggest that flow cytometric analysis represents an approach that significantly enhances the information content of in vitro micronucleus screening assays. The simultaneous acquisition of a number of endpoints that convey information regarding test article-induced cytotoxicity aids data interpretation, and appears to help identify irrelevant positives. Miniaturization of the assay and experimentation with additional agents covering a wider range of chemical classes are planned, as are inter-laboratory studies that have been designed to evaluate assay portability.
Acknowledgments
This research was supported by a grant from the National Cancer Institute (grant number R43CA117093-01A1). The contents are the sole responsibility of the authors, and do not necessarily represent the official views of NCI. The authors would like to thank Ying Tsai and Irena Nowak for their expert technical assistance. Fruitful discussions that greatly enhanced the experimental design and choice of test agents studied occurred with many knowledgeable colleagues. Special thanks go to Marlies De Boeck, Freddy Van Goethem, Anthony Lynch, James Harvey, Azeddine Elhajouji, Michael Fenech, Paula Meuhlbauer, Yuhchyau Chen, John Nicolette, Julie Clements, and Masa Honma. Disclosure statement: Litron Laboratories has filed a patent covering flow cytometric methods for scoring micronuclei as described herein.
Footnotes
Publisher's Disclaimer: This is a PDF file of an unedited manuscript that has been accepted for publication. As a service to our customers we are providing this early version of the manuscript. The manuscript will undergo copyediting, typesetting, and review of the resulting proof before it is published in its final citable form. Please note that during the production process errors may be discovered which could affect the content, and all legal disclaimers that apply to the journal pertain.
References
- 1.Kirsch-Volders M, Sofuni T, Aardema M, Albertini S, Eastmond D, Fenech M, Ishidate M, Jr, Kirchner S, Lorge E, Morita T, Norppa H, Surrallés J, Vanhauwaert A, Wakata A. Report from the in vitro micronucleus assay working group. Mutat Res. 2003;540:153–163. doi: 10.1016/j.mrgentox.2003.07.005. [DOI] [PubMed] [Google Scholar]
- 2.Matsushima T, Hayashi M, Matsuoka A, Ishidate M, Jr, Miura KF, Shimizu H, Morimoto K, Ogura H, Mure K, Koshi K, Sufuni T. Validation study of the in vitro micronucleus test in a Chinese hamster lung cell line (CHL/IU) Mutagenesis. 1999;14:569–580. doi: 10.1093/mutage/14.6.569. [DOI] [PubMed] [Google Scholar]
- 3.Miller B, Potter-Locher F, Seelbach A, Stopper H, Utesch D, Madle S. Evaluation of the in vitro micronucleus test as an alternative to the in vitro chromosome aberration assay: position of the GUM working group on the in vitro micronucleus test. Mutat Res. 1998;410:81–116. doi: 10.1016/s1383-5742(97)00030-6. [DOI] [PubMed] [Google Scholar]
- 4.Lorge E, Thybaud V, Aardema MJ, Oliver J, Wakata A, Lorenzon G, Marzin D. SFTG international collaborative study on in vitro micronucleus test. I. General conditions and overall conclusions of the study. Mutat Res. 2006;607:13–36. doi: 10.1016/j.mrgentox.2006.04.006. [DOI] [PubMed] [Google Scholar]
- 5.Elhajouji A, Tibaldi F, Kirsch-Volders M. Indication for thresholds of chromosome non-disjunction versus chromosome lagging induced by spindle inhibitors in vitro in human lymphocytes. Mutagenesis. 1997;12:133–140. doi: 10.1093/mutage/12.3.133. [DOI] [PubMed] [Google Scholar]
- 6.Bentley KS, Kirkland D, Murphy M, Marshall R. Evaluation of thresholds for benomyl- and carbendazim-induced aneuploidy in cultured human lymphocytes using fluorescence in situ hybridization. Mutat Res. 2000;464:41–51. doi: 10.1016/s1383-5718(99)00165-5. [DOI] [PubMed] [Google Scholar]
- 7.Ramirez T, Eastmond DA, Herrera LA. Non-disjunction events induced by albendazole in human cells. Mutat Res. 2007;626:191–195. doi: 10.1016/j.mrgentox.2006.09.004. [DOI] [PubMed] [Google Scholar]
- 8.Perry JM, Perry EM. The use of the in vitro micronucleus assay to detect and assess the aneugenic activity of chemicals. Mutat Res. 2006;607:5–8. doi: 10.1016/j.mrgentox.2006.04.007. [DOI] [PubMed] [Google Scholar]
- 9.Olaharski AJ, Ji Z, Woo JY, Lim S, Hubbard AE, Zhang L, Smith MT. The histone deacetylase inhibitor trichostatin A has genotoxic effects in human lymphoblasts in vitro. Tox Sci. 2006;93:341–347. doi: 10.1093/toxsci/kfl068. [DOI] [PubMed] [Google Scholar]
- 10.Nüsse M, Kramer J. Flow cytometric analysis of micronuclei found in cells after irradiation. Cytometry. 1984;5:20–25. doi: 10.1002/cyto.990050105. [DOI] [PubMed] [Google Scholar]
- 11.Schreiber GA, Beisker W, Braselmann H, Bauchinger M, Bogl KW, Nüsse M. An automated flow cytometic micronucleus assay for human lymphocytes. Int J Radiat Biol. 1992;62:695–709. doi: 10.1080/09553009214552651. [DOI] [PubMed] [Google Scholar]
- 12.Schreiber GA, Beisker W, Bauchinger M, Nüsse M. Multiparametric flow cytometric analysis of radiation-induced micronuclei in mammalian cell cultures. Cytometry. 1992;13:90–102. doi: 10.1002/cyto.990130114. [DOI] [PubMed] [Google Scholar]
- 13.Vral A, Verhaegen F, Thierens H, de Ridder L. The in vitro cytokinesis-block micronucleus assay: a detailed description of an improved slide preparation technique for the automated detection of micronuclei in human lymphocytes. Mutagenesis. 1994;9:439–443. doi: 10.1093/mutage/9.5.439. [DOI] [PubMed] [Google Scholar]
- 14.Verhaegen F, Vral A, Seuntjens J, Schipper NW, de Ridder L, Thierens H. Scoring of radiation-induced micronuclei in cytokinesis-blocked human lymphocytes by automated image analysis. Cytometry. 1994;17:119–127. doi: 10.1002/cyto.990170203. [DOI] [PubMed] [Google Scholar]
- 15.Bocker W, Muller WU, Streffer C. Image processing algorithms for the automated micronucleus assay in binucleated human lymphocytes. Cytometry. 1995;19:283–294. doi: 10.1002/cyto.990190402. [DOI] [PubMed] [Google Scholar]
- 16.Wessels J, Nüsse M. Flow cytometric detection of micronuclei by combined staining of DNA and membranes. Cytometry. 1995;19:201–208. doi: 10.1002/cyto.990190303. [DOI] [PubMed] [Google Scholar]
- 17.Viaggi S, Braselmann H, Nüsse M. Flow cytometric analysis of micronuclei in the CD2+ subpopulation of human lymphocytes enriched by magnetic separation. Int J Radiat Biol. 1995;67:193–202. doi: 10.1080/09553009514550241. [DOI] [PubMed] [Google Scholar]
- 18.Nüsse M, Marx K. Flow cytometric analysis of micronuclei in cell cultures and human lymphocytes: advantages and disadvantages. Mutat Res. 1997;392:109–115. doi: 10.1016/s0165-1218(97)00049-9. [DOI] [PubMed] [Google Scholar]
- 19.Roman D, Locher F, Suter W, Cordier A, Bobadilla M. Evaluation of a new procedure for the flow cytometric analysis of in vitro, chemically induced micronuclei in V79 cells. Environ Molec Mutagen. 1998;32:387–396. [PubMed] [Google Scholar]
- 20.Avlasevich SL, Bryce SM, Cairns SE, Dertinger SD. In vitro micronucleus scoring by flow cytometry: differential staining of micronuclei versus apoptotic and necrotic chromatin enhances assay reliability. Environ Molec Mutagen. 2006;47:56–66. doi: 10.1002/em.20170. [DOI] [PubMed] [Google Scholar]
- 21.Skopek TR, Liber HL, Penman BW, Thilly WG. Isolation of a human lymphoblastoid line heterozygous at the thymidine kinase locus: possibility for a rapid human cell mutation assay. Biochem Biophys Res Commun. 1978;84:411–416. doi: 10.1016/0006-291x(78)90185-7. [DOI] [PubMed] [Google Scholar]
- 22.Kirkland D, Pfuhler S, Tweats D, Aardema M, Corvi R, Darroudi F, Elhajouji A, Glatt H, Hastwell P, Hayashi M, Kasper P, Kirchner S, Lynch A, Marzin D, Maurici D, Meunier JR, Müller L, Nohynek G, Parry J, Parry E, Thybaud V, Tice R, van Benthem J, Vanparys P, White P. How to reduce false positive results when undertaking in vitro genotoxicity testing and thus avoid unnecessary follow-up animal tests: Report of an ECVAM Workshop. Mutat Res. 2007 doi: 10.1016/j.mrgentox.2006.11.008. in press. [DOI] [PubMed] [Google Scholar]
- 23.Brando B, Barnett D, Janossy G, Mandy F, Autran B, Rothe G, Scarpati B, D'Avanzo G, D'Hautcourt JL, Lenkei R, Schmitz G, Kunkl A, Chianese R, Papa S, Gratama JW. Cytofluorometric methods for assessing absolute numbers of cell subsets in blood. Cytometry. 2000;42:327–346. doi: 10.1002/1097-0320(20001215)42:6<327::aid-cyto1000>3.0.co;2-f. [DOI] [PubMed] [Google Scholar]
- 24.Fenech M, Chang WP, Kirsch-Volders M, Holland N, Bonassi S, Zeiger E. HUMN project: detailed description of the scoring criteria for the cytokinesis block micronucleus assay using isolated human lymphocyte cultures. Mutat Res. 2003;534:65–75. doi: 10.1016/s1383-5718(02)00249-8. [DOI] [PubMed] [Google Scholar]
- 25.Muehlbauer PA, Schuler MJ. Detection of numerical chromosomal aberrations by flow cytometry: A novel process for identifying aneugenic agents. Mutat Res. 2005;585:156–169. doi: 10.1016/j.mrgentox.2005.05.002. [DOI] [PubMed] [Google Scholar]
- 26.Kirkland D, Aardema M, Henderson L, Müller L. Evaluation of the ability of a battery of three in vitro genotoxicity tests to discriminate rodent carcinogens and non-carcinogens. I. Sensitivity, specificity and relative predictivity. Mutat Res. 2005;584:1–256. doi: 10.1016/j.mrgentox.2005.02.004. [DOI] [PubMed] [Google Scholar]
- 27.Hilliard CA, Armstrong MJ, Bradt CI, Hill RB, Greenwood SK, Galloway SM. Chromosome aberrations in vitro related to cytotoxicity of nonmutagenic chemicals and metabolic poisons. Environ Molec Mutagen. 1998;31:316–326. [PubMed] [Google Scholar]
- 28.Galloway SM. Cytotoxicity and chromosome aberrations in vitro: experience in industry and the case for an upper limit on toxicity in the aberration assay. Environ Molec Mutagen. 2000;35:191–201. [PubMed] [Google Scholar]
- 29.Greenwood SK, Hill RB, Sun JT, Armstrong MJ, Johnson TE, Gara JP, Galloway SM. Population Doubling: A simple and more accurate estimation of cell growth suppression in the in vitro assay for chromosomal aberrations that reduces irrelevant positive results. Environ Molec Mutagen. 2004;43:36–44. doi: 10.1002/em.10207. [DOI] [PubMed] [Google Scholar]
- 30.Liu Y, Wu Z, Chen J. Differential effects of aneugens and clastogens on incidences of multinucleated cells and of micronucleate cells in Chinese hamster lung (V79) cell line in vitro. Mutat Res. 1998;413:39–45. doi: 10.1016/s1383-5718(98)00012-6. [DOI] [PubMed] [Google Scholar]
- 31.Russell LB, Hunsicker PR, Kerley M, Pyle A, Saxton AM. Etoposide exposure during male mouse pachytene has complex effects on crossing-over and causes nondisjunction. Mutat Res. 2004;565:61–77. doi: 10.1016/j.mrgentox.2004.09.005. [DOI] [PubMed] [Google Scholar]
- 32.Touil N, Elhajouji A, Thierens H, Kirsch-Volders M. Analysis of chromosome loss and chromosome segregation in cytokinesis-blocked human lymphocytes: non-disjunction is the prevalent mistake in chromosome segregation produced by low dose exposure to ionizing radiation. Mutagenesis. 2000;15:1–7. doi: 10.1093/mutage/15.1.1. [DOI] [PubMed] [Google Scholar]
- 33.Leopardi P, Marcon F, Dobrowolny G, Zijno A, Crebelli R. Influence of donor age on vinblastine-induced chromosome malsegregation in cultured peripheral lymphocytes. Mutagenesis. 2002;17:83–88. doi: 10.1093/mutage/17.1.83. [DOI] [PubMed] [Google Scholar]
- 34.Krishna G, Fiedler R, Theiss JC. Simultaneous analysis of chromosome damage and aneuploidy in cytokinesis-blocked V79 Chinese hamster lung cells using an antiketochore antibody. Mutat Res. 1992;282:79–88. doi: 10.1016/0165-7992(92)90078-v. [DOI] [PubMed] [Google Scholar]
- 35.Efthimiou M, Andrianopoulos C, Stephanou G, Demopoulos NA, Nikolaropoulos SS. Aneugenic potential of the nitrogen mustard analogues melphalan, chlorambucil and p-N,N-BIS(2-Chloroethyl)aminophenylacetic acid in cell cultures in vitro. Mutat Res. doi: 10.1016/j.mrfmmm.2007.01.009. in press. [DOI] [PubMed] [Google Scholar]
- 36.Shi Q, King RW. Chromosome nondisjunction yields tetraploid rather than aneuploid cells in human cell lines. 2005;437:1038–1042. doi: 10.1038/nature03958. [DOI] [PubMed] [Google Scholar]
- 37.Andreassen PR, Martineau SN, Margolis RL. Chemical induction of mitotic checkpoint override in mammalian cells results in aneuploidy following a transient tetraploid state. Mutat Res. 1996;372:181–194. doi: 10.1016/s0027-5107(96)00138-8. [DOI] [PubMed] [Google Scholar]
- 38.Lingle WL, Barrett SL, Negron VC, D'Assoro AB, Boeneman K, Liu W, Whitehead CM, Reynolds C, Salisbury JL. Centrosome amplification drives chromosomal instability in breast tumor development. PNAS. 2002;99:1978–1983. doi: 10.1073/pnas.032479999. [DOI] [PMC free article] [PubMed] [Google Scholar]
- 39.Lynch A, Harvey J, Aylott M, Nicholas E, Burman M, Siddiqui A, Walker S, Rees R. Investigations into the concept of a threshold for topoisomerase inhibitor-induced clastogenicity. Mutagenesis. 2003;18:345–353. doi: 10.1093/mutage/geg003. [DOI] [PubMed] [Google Scholar]
- 40.Elia MC, Bradley MO. Influence of chromatin structure on the induction of DNA double strand breaks by ionizing radiation. Cancer Res. 1992;52:1580–1586. [PubMed] [Google Scholar]
- 41.Surrallés J, Catalán J, Creus A, Norppa H, Xamena N, Marcos R. Micronuclei induced by alachlor, mitomycin-C and vinblastine in human lymphocytes: presence of centromeres and kinetochores and influence of staining technique. Mutagenesis. 1995;10:417–423. doi: 10.1093/mutage/10.5.417. [DOI] [PubMed] [Google Scholar]
- 42.Zijno A, Leopardi P, Marcon F, Crebelli R. Analysis of chromosome segregation by means of fluorescence in situ hybridization: application to cytokinesis-blocked human lymphocytes. Mutat Res. 1996;372:211–219. doi: 10.1016/s0027-5107(96)00141-8. [DOI] [PubMed] [Google Scholar]
- 43.Meintieres S, Biola A, Pallardy M, Marzin D. Using CTLL-2 and CTLL-2 bcl2 cells to avoid interference by apoptosis in the in vitro micronucleus test. Environ Molec Mutagen. 2003;41:14–27. doi: 10.1002/em.10126. [DOI] [PubMed] [Google Scholar]