FIGURE 1.
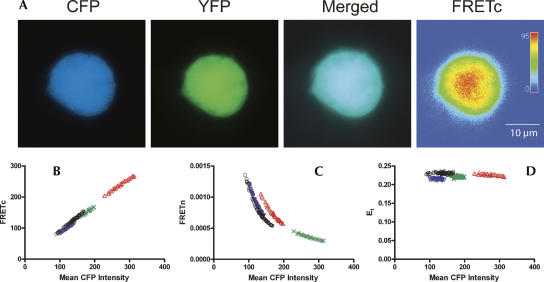
FRET positive control and representative FRET calculations. A tandem vector construct of eCFP and eYFP was used as a positive control for the detection of FRET in DDT1-MF2 cells (Galperin et al. 2004). Slidebook software (v4.1.0.4) was used to obtain mean intensity values from identically sized areas sampled from the entire cell for CFP, YFP, and the raw FRET signal. These data were used to calculate FRETc, FRETn, and the FRET efficiency value, E, which are shown plotted vs. the mean CFP intensities. The maximal FRET efficiency (Et) obtained for CFP:YFP in DDT1-MF2 cells is 0.22±0.02. (A) DDT1-MF2 cell images. The CFP, YFP, and merged channel views show the uniform intracellular distribution of the CFP and YFP proteins throughout the cell. The FRETc image is shown in thermal gradient pseudocolor, where red indicates the strongest signal. The size scale bar (μm) applies to all images. (B) FRETc versus mean CFP intensity. (C) FRETn versus mean CFP intensity. (D) Et versus mean CFP intensity.

