

Abstract
The herbicide atrazine is a known immunotoxicant and an inhibitor of human Natural Killer (NK) cell lytic function. The precise changes in NK cell lytic function following atrazine exposure have not been fully elucidated. The current study identifies the point at which atrazine exerts its affect on the stepwise process of human NK cell mediated lyses of the K562 target cell line. Using intracellular staining of human peripheral blood lymphocytes, it was determined that a 24 h in vitro exposure to atrazine did not decrease the level of NK cell lytic proteins granzyme A, granzyme B or perforin. Thus, it was hypothesized that atrazine exposure was inhibiting the ability of the NK cells to bind to the target cell and subsequently inhibit the release of lytic protein from the NK cell. To test this hypothesis, flow cytometry and fluorescent microscopy were employed to analyze NK cell-target cell co-cultures following atrazine exposure. These assays demonstrated no significant decrease in the level of target cell binding. However, the levels of NK intracellular lytic protein retained and the amount of lytic protein released were assessed following a 4 h incubation with K562 target cells. The relative level of intracellular lytic protein was 25–50% higher, and the amount of lytic protein released was 55–65% less in atrazine treated cells than vehicle treated cells following incubation with the target cells. These results indicate that ATR exposure inhibits the ability of NK cells to lyse target cells by blocking lytic granule release without affecting the ability of the NK cell to form stable conjugates with target cells.
Keywords: Atrazine, Natural Killer cells, Perforin
Atrazine is a chlorinated triazine herbicide used throughout the world with an extensive history of occupational and environmental human exposure. Studies on professional applicators found evidence of atrazine in their urine during the spraying season (Perry et al. 2000; Perry et al. 2001). EPA surveys of well water systems in agricultural communities found levels in excess of the regulated limit in 88% of the water systems tested (EPA 2003). A 1998 survey of 21,241 community water supplies (CWS) found that 11.2% of the CWSs surveyed had levels of atrazine above the limits of quantification (http://ca.water.usgs.gov/pnsp/use92/1998). In addition, a study of one hundred Iowa homes of farm and non-farm families found atrazine in the dust of their homes (Curwin et al. 2005). Not surprisingly, Curwin et al. 2005 found that the atrazine concentration was higher in the homes of farms that actively applied atrazine. Further studies by Curwin et al. 2007 of both farm and non-farm families in Iowa found atrazine metabolites in the urine of both populations. An independent study in the state of Minnesota found that atrazine metabolites were present in the urine of children from nonagricultural families (Adgate et al. 2001). These results indicate that atrazine exposure is not limited to farmers and farm families but those people near agriculturally active areas are also at risk of exposure. Overall human exposure to atrazine occurs across the population through multiple exposure routes.
Research into the toxic effects of atrazine exposure has revealed atrazine to be directly disruptive to the central nervous system, the endocrine system and the immune system (Cooper et al. 1999; Rodriguez et al. 2005; Sanderson et al. 2001). Mencoboni et al. 1992 found that acute intraperitoneal exposure to atrazine reduced hematopoietic progenitors for a short period. A transient reduction in IgM production and T cell reactivity has also been reported after an acute oral exposure (Fournier et al, 1992). Subchronic (2 week) exposure to atrazine decreased resistance to tumor challenge (Karrow et al., 2005). Natural killers were identified as an immune cell targets of atrazine in subchronically exposed mice (Karrow et al., 2005). This decrease in natural killer (NK) cell lytic function might explain the observed reduction in tumor resistance. Whalen et al 2003 also reported earlier that a 24 h in vitro exposure of a mixture of human T-cells and NK cells to atrazine reduced NK cell specific lytic function. Thus, while unlikely to be the only susceptible population, the available evidence indicates that NK cells are affected by atrazine exposure.
NK cells are innate immune effector cells which eliminate virally-infected cells and cancerous cells via a non-antigen-specific lysis. One manner in which NK cells mediate this lysis of aberrant cells is through the release of stores of apoptosis-inducing proteins upon contact with the target cells (Trapani and Smyth 2002; Whiteside and Herberman 1994). One mechanism by which NK cells can recognize the aberrant cells is through absence of self recognition. The lack of inhibitory ligands normally present on healthy cells leads to formation of an activating signaling complex at the point of target cell contact (Kopcow et al. 2005). During the first 24 h of a viral infection, NK cell activity stems the expansion of the virus by killing virally infected cells (Whiteside and Herberman 1994). Environmental factors that reduce NK cell function would logically make those exposed more susceptible to acute virus infections, interfere with the management of chronic viral infections as well as cause other health problems.
NK cells interact with all cells that they recognize through the formation of an immunological synapse (Orange et al. 2003). The formation of a synapse does not necessarily lead to the NK meditated lysis of the target cell, but it is required for NK cell mediated lysis of the target cell (Wulfing et al. 2003). Thus, while stable adhesion is required for granule release and blockage of the adhesion will block target cell lysis, stable adhesion of the NK cell to the target does not necessitate the release of the granules and the lysis of the target cell (Vyas et al. 2001; Vyas et al. 2002). Considering earlier reports of atrazine down-regulation of lytic function we hypothesized that the atrazine exposure would decrease target cell adhesion and subsequent granule release. PBLs isolated from healthy human male donors were exposed to atrazine at or near environmentally-relevant concentrations for 24 h. The ability of NK cells to bind the target cells as well as the ability of the NK cells to subsequently release lytic granule was assessed. Herein it is reported that atrazine can specifically inhibit the release of lytic granules without affecting the ability of the NK cell to bind to the target cell.
Methods
Atrazine
Atrazine (98% purity) was purchased from Chemservice (West Chester, PA). The atrazine was dissolved in 100% ethanol (ETOH) and applied directly to the cultures. Control cultures received 0.1% ETOH, and are designated in the figures as 0μM atrazine.
Cell Culture
Peripheral Blood lymphocytes (PBLs) were maintained in a Thermo Forma Sterie Cycle CO2 incubator cultured in RPMI 1640 supplemented with 10% heat inactivated fetal bovine serum (FBS) (Hyclone, Logan UT), 2mM of L-glutamine (Medtech Inc., Herndon VA), 0.05M HEPES (Sigma Chemical Co. St. Louis, MO), 45μM β-mercaptoethanol (Sigma Chemical Co.), and 50μg/ml of penicillin/streptomycin (Hyclone) (Complete RPMI). The K562 cell line was maintained in Iscove’s modified Dulbecco’s medium with NaHCO3 and 30 mM HEPES. The media was further supplemented with 2 mM of L-glutamine, 45 μM β-mercaptoethanol, and 50 μg/ml of penicillin/streptomycin. Unless otherwise noted the cells were cultured at 37°C in 5% CO2.
Peripheral Blood Lymphocyte Harvest
Human blood was obtained from healthy donors (as approved by the West Virginia University Institution Review Board for the Protection of Human Research Subjects), diluted 1:1 in PBS and centrifuged through a ficoll gradient (Histopaque 1077) at 750 g for 30 minutes at room temperature. The leukocyte layer was washed in 6 times its volume of room temperature sterile PBS and centrifuged at approximately 300 g for 10 minutes at room temperature. The washed pellet was then resuspended in PBS and layered over 6 mLs of FBS at room temperature. The cells were then centrifuged through the FBS to separate platelets and other large serum proteins. After the FBS-gradient, the cells were suspended in RPMI, placed in plastic 100mm diameter Petri dishes and cultured for 2 hours at 37°C in 5% CO2 in order to remove adherent cells. This yielded a preparation of approximately 10–15% NK cells and 70–80% T-cells as determined by flow cytometry. All experiments were conducted from a pool of 16 healthy male donors between the ages of 23 and 44. Each assay was conducted using the blood from a single donor, and then repeated at least twice with PBLs obtained from a different donor each time.
Cytotoxic Lymphocyte Assay
Lymphocytes were isolated from human peripheral blood as described above and counted. The cells were incubated with carboxyfluorescein diacetate succinimidyl ester (CFSE) (Molecular Probes, Eugene OR) in PBS for 15 minutes at 37°C. Following incubation, the cells were centrifuged and resuspended in 37°C complete RPMI, incubated for 30 minutes at 37 °C and 5% CO2. The CFSE-labeled PBLs were plated at 106, 5x10⁵, 2.5x10⁵ or 1.2x10⁵ cells per well in a 96 well v-bottom plate with each well also containing 5x10⁴ K562 target cells. The K562 target cells are human leukemia cells that are sensitive to lysis by human NK cells. Target cells were also plated alone with complete RMPI media or in wells containing 0.01% Triton X-100 to assess spontaneous and maximum observable cell death respectively. The plates containing the mixtures of labeled effector cells with target cells were incubated at 37°C at 5% CO2 for 4 hrs.
After 4 h, cell mixtures were centrifuged at 300 g at 4 °C for 5 minutes and washed once with in PBS + 1% BSA and 0.1% sodium azide. The cell mixtures were incubated for 20 minutes in the dark at 4°C with 20 μg/ml 7- amino actinomycin D (7-AAD) or stained with propidium iodide (PI). PI treated samples were not fixed but analyzed immediately. Samples treated with 7-AAD were then washed in 1% BSA in PBS + 0.1% sodium azide and fixed in 0.4% paraformaldhyde in PBS overnight in the dark at 4°C. The cells were analyzed via flow cytometry using a Becton Dickinson FACScalibur (San Jose, CA) and Cell Quest-ProTM software. To determine if CFSE staining compromised the ability of PBLs to lyse NK sensitive target cells, experiments were performed in the absence of CFSE. In general, the PBLs are considerably smaller than the K562s, and in the CFSE free assay the cell subpopulations were segregated based on forward scatter (size). There was no direct effect of CFSE on NK cell specific lysis (data not shown).
Enrichment of NK cells
PBLs were isolated as described above, and the cells were then treated for 24 h with atrazine. Following the treatment, the PBLs were counted and the NK cell population was enriched by magnetic depletion of CD3 positive cells. Briefly, cells were incubated with anti-CD3 antibody conjugated to fluorescein isothiocyanate (FITC) (BD PharMingen) in the dark on ice for 30 minutes. These cells were washed twice with cold PBS buffer containing 2% FBS followed by a fifteen minute incubation in cold buffer solution with an anti-FITC antibodies conjugated to Microbeads (Mitenyi Biotec). The cells were then washed once and resuspended at 1x10⁸ cells per 500 μl of buffer. The cells were separated using an autoMACS (Miltenyi Biotec). The depletion reduced the percentage of CD3+ cells from approximately 70% of the PBLs to approximately 40% of the PBLs as determined by flow cytometry (data not shown).
Flow Cytometry
The subpopulations of lymphocytes and the viability of those populations were determined using flow cytometry. Single cell suspensions of lymphocytes were prepared, as described above, and stained with fluorescently conjugated antibodies specific for human T-cell and NK markers. The antibodies and their specific markers were purchased from BD PharMingen, Franklin Lakes, NJ and are summarized in Table 1. Staining was conducted as follows: 1×10⁶ lymphocytes were incubated with purified mouse IgG for 20 minutes on ice to prevent nonspecific binding of the antibodies to the cells. Next, the cells were washed with ice cold PBS containing 2% FBS (Hyclone, Logan UT) and 0.2% sodium azide (Sigma-Aldrich Chemical Co). The cells are then incubated with the appropriate antibody containing diluents for 30 minutes (Table 1) and then fixed in 0.4% paraformaldehyde. Assessment of the levels of the intracellular granule proteins was determined by permeablizing the fixed cells using 0.1% saponin (Fisher Scientific, NJ) containing wash buffer and incubating the cells with FITC or phycoerythrin (PE ) conjugated antibody specific for perforin, granzyme A or granzyme B (Table 1). The cells were analyzed using a Becton Dickinson FACScalibur (San Jose, CA) and Cell Quest Pro software (San Jose, CA).
Table 1.
List of fluorochrome-conjugated antibodies and stains used for the studies reported herein.
| Target Molecule | Dye or Antibody Clone | Fluorochrome | Excitation/Emission Wavelengths (nm) |
|---|---|---|---|
| CD3 | Clone HIT3A | FITC | 492/517 |
| CD3 | Clone HIT3A | PE-Cy5 | 585/650 |
| CD8 | Clone RPA-T | PE | 565/573 |
| CD16 | 3G8 | AlexaFluor 647 | 647/660 |
| CD56 | Clone B159 | AlexaFluor 647 | 647/660 |
| CD56 | Clone B159 | PE | 565/573 |
| Intracellular amines | CFSE | FITC | 492/517 |
| Granzyme A | Clone CB9 | FITC | 492/517 |
| Granzyme B | Clone GB11 | FITC | 492/517 |
| LFA-1 | H111 | PE-Cy5 | 585/670 |
| Perforin | Clone δG9 | FITC | 492/517 |
NK Cell Adhesion
PBLs were cultured for 24 h with or without atrazine. The atrazine containing media was removed and the cells were placed in complete RPMI. K562 cells were stained with CFSE (as described above), resuspended in complete RPMI and counted. The PBLs and labeled K562s cell were then placed in 15 ml tubes at PBL to K562 ratios from 4:1 to 1:1. The mixed cultures were centrifuged for 7 minutes at 228 g at 4°C, and the placed in a dark 37°C water bath for 10 minutes. The tubes were then incubated in the dark on ice for 30 minutes to prevent or halt cell lysis. The cells were gently resuspended and incubated 20 minutes in the dark on ice with either a fluorochrome conjugated anti-CD16 antibody or anti-CD56 antibody (Table 1). The cells were gently resuspended in ice cold PBS buffered with 2% FBS and transferred to FACS tubes. The tubes were placed on ice in the dark until individually analyzed. Control samples containing PBLs previously fixed in paraformaldhyde were used to detect non-specific cell-cell interactions. Analysis was carried out via a Becton Dickinson FACScalibur (San Jose, CA) directly after antibody staining or fixed for later analysis on a MetaMorph multidimensional fluorescence microscope (Fryer Company INC, Chicago IL).
Perforin ELISA
A human perforin sandwich ELISA kit was purchased from Mabtech (Stockholm, Sweden) and performed as per manufacturer’s instructions. Briefly, a high protein binding ELISA plate was incubated overnight at 4°C with Pf-80/164 perforin-specific antibody, and then washed twice with PBS. The plate was then blocked for one hour at room temperature with 0.1% BSA and 0.05% Tween-20 at 200 μl/well and washed with PBS + 0.05% Tween-20. Supernatants, 100 μl/well from PBL-K562 co-cultures containing 5x10⁵ PBLs and 5x10⁴ targets, were transferred to the ELISA plate along with a perforin standard. The plate was incubated overnight at 4°C and washed with PBS + 0.05% Tween-20. Perforin specific Pf-344 biotin conjugated antibody was added to each well and incubated for one hour. The plate was washed and incubated with streptavidin horse radish peroxidase (HRP) for one hour. The plate was washed as before to remove excess streptavidin-HRP and the plate was incubated with a hydrogen peroxide containing substrate. The concentrations were calculated from the OD using a μQuant Universal Microplate Spectrophotometer (Bio-Tek Instruments, Winooski, VT).
Protein Extraction
Whole cells lysates were produce from PBL cultures following enrichment of the NK cell population (see above). At least 1x10⁷ cells were incubated for 5 minutes on ice in 25–50 μl of lysis buffer (1M Tris, 5M NaCl, 0.5M ethylenediamineteraacetic acid (EDTA), 0.1M ethylene glycol-bis(2-amino-ethylether)-N,N, N′, N′-tetra-acetic acid (EGTA), Triton X-100, 0.1M sodium pyrophosphate, 1M β-glyerolphosphate, 200mM NA3VO4 and 1 mg/ml of leupeptin). Phenylmethylsulfonyl fluoride (PMSF) (100 mM stock) was added to the cell lysate mixture at 10 μl per ml. Following the incubation, the cells were sonicated eight times for five seconds each time, and then centrifuged for 10 minutes at 4°C at 10,600 g. Supernatants were transferred to fresh tubes and the amount of protein in the extract was then determined using a Pierce BCA protein ELISA kit (Rockford IL). Extracts were stored at -70°C.
Western Blots
Western blots were performed using whole cell extracts of enriched NK cell populations (see above). Briefly, 40 μg of whole cell extract was boiled for 5 minutes in sample buffer (62.5 mM Tris-HCL pH 6.8, 2% SDS, 10% glycerol, 50 mM DTT and 0.1% bromophenol blue) to denature the proteins. Samples were electrophoresed through 12% tris polyacrylamide separating gels with 4% stacking gels at 90 volts for 2 h. Proteins were transferred to Hybond-P (Amersham Pharmacia) membranes at 45 volts for 90 min. Blots were washed in Tris buffered saline (TBS) for 5 min at room temperature, blocked 1 h in TBS + 0.1% Tween 20 (TBS/T) plus 5% dry milk at room temperature and washed three times in TBS/T. Blots were incubated overnight at 4 °C with a primary rabbit antibody specific for perforin (clone H-315, Santa Cruz Biotech, CA) diluted 1:500 in TBS/T plus 5% dry milk. Twelve h later, blots were washed three times in TBS/T, 5 min per wash, incubated for 1 h at room temperature with a horseradish peroxidase (HRP)-conjugated goat anti-rabbit IgG (H+L) secondary antibody (Cell Signaling Technology, Inc.) and washed three times in TBS/T. Blots were developed using Phototope-HRP detection kit for western blots (Cell Signaling Technology, Inc). Bands were visualized by exposing to X-Ray film (BioMax MR, Eastman Kodak Company).
For quantification, blots were stripped of antibodies by washing once in H2O for 5 min at room temperature then incubated in 0.2 M NaOH for 5 min at room temperature and washed again in H2O for 5 min at room temperature. Blots were blocked in TBS/T plus 5% dry milk, washed three times in TBS/T and incubated for 2 h at room temperature with an anti-β-actin antibody (Santa Cruz Biotechnology). Blots were then washed three times with TBS/T, 5 min at room temperature, incubated for 1 h room temperature with HRP-conjugated donkey anti-goat IgG (Santa Cruz Biotechnology) and developed as described above. Densitometric analysis was performed using Optimus software (Media Cybernetics, Silver Spring, MD). Total 70 kD, 65 kD, and 60 kD perforin levels were normalized to β-actin protein levels for each sample.
Statistics
Statistical significance was determined by two methods, comparing the data of the atrazine-treated groups against the data obtained from the control groups using a t-test, and comparing all the treatments groups using an analysis of variance (ANOVA). In the ANOVAs used there was 1 degree of freedom, and thus a post hoc test following the ANOVA was not necessary.
Results
Atrazine decreases NK specific lytic activity of PBLs
Other labs have demonstrated that atrazine decreases the human NK cell lytic function (Whalen et al. 2003). To confirm these results NK specific lytic function of PBLs following a 24 h incubation with or without atrazine was assessed using the NK specific K562 target cell line. Figure 1 is a representative experiment in which atrazine decreased NK cell lytic function. ANOVA analysis of all the curves found there to be significant decreases in PBL cultures treated with atrazine the 30 μM, 10 μM and 3 μM concentrations. A comparison of single point was also applied using a lytic unit scale. Normalizing to 30% lysis (an arbitrary lytic unit), the 30 μM and 10 μM cultures achieved 30% lysis at approximately 10 PBLs per target cell while the vehicle and media control samples achieved 30% lysis at the 2.5:1 PBL to target cell ratio. A significant (p<0.05) reduction was consistently observed at the 30 μM and 10 μM exposure level, and with 3 μM exposure level with some donors.
Figure 1. NK specific lysis of K562 target cells.
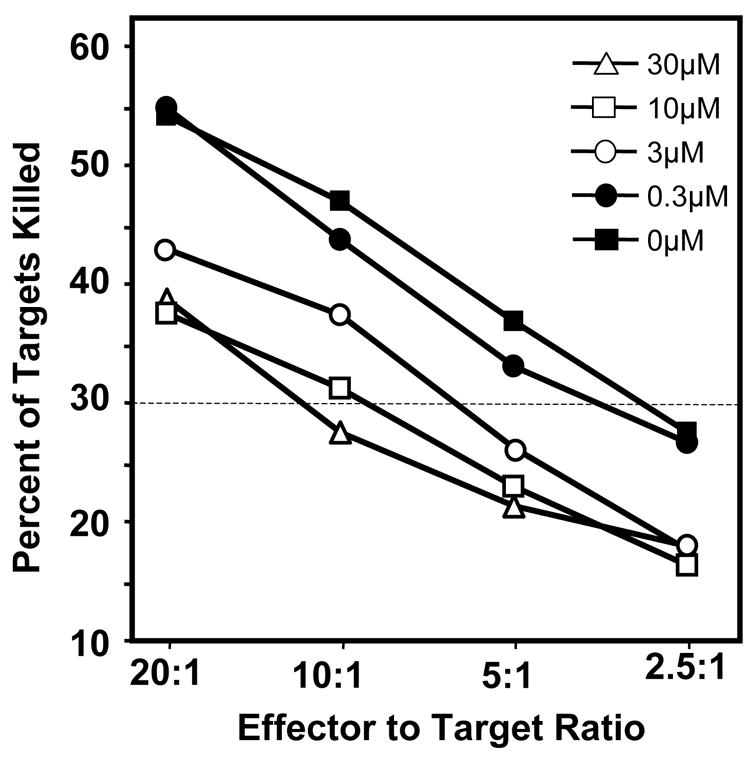
PBLs were harvested from healthy male donors and treated with atrazine in vitro for 24 hrs as described in the Methods. NK specific lytic function was determined by incubating PBLs with K562 cells at ratios ranging from 20:1 to 2.5:1 for 4 hrs, and the staining the cells with propidium iodide. The cells were analyzed immediately via flow cytometry as described in the Methods. One way ANOVA analysis indicated that the values obtained from those cells treated with 30μM, 10μM or 3μM concentration of atrazine were significantly different (p<0.05) than those obtained from cell treated with 0.3μM of atrazine or vehicle control (0μM).
Atrazine does not affect viability or NK cell subpopulation distributions
NK subpopulations possess different lytic potentials and varying lytic specificities (Frey et al. 1998; Perez et al. 2004; Sedlmayr et al. 1996; Trotta et al. 2005; Vitale et al. 2004). Following a 24 h exposure to atrazine the PBLs were assessed for viability and subpopulation distribution via flow cytometry. Subpopulations distribution was determined using four lymphocyte markers: CD56, CD16, CD3 and CD8 and viability was determined using 7-AAD exclusion. The percentages of CD56dim, CD56bright and CD56+CD3+ NK cells were not significantly different from controls following treatment. The CD16 marker was expressed on all of the CD56dim NK cells surveyed. There were no changes in viability or subpopulation distribution following incubation with atrazine (data not shown).
The basal level of lytic proteins was not changed following a 24 h exposure to atrazine
To test the effects of atrazine on NK cell perforin, granzyme A and B levels, PBLs were isolated and incubated 24 h with a 30 μM or 10 μM concentration of atrazine. Perforin levels were assessed prior to incubation with target cells using intracellular staining and flow cytometry. The PBLs were stained with an anti-CD56 antibody, an anti-CD3 antibody and an anti-CD8 antibody before being stained with an anti-perforin antibody (antibodies are listed in Table 1). After gating on the CD56+ cells (NK cells), the relative quantity of perforin for CD56+ cells was determined by the mean fluorescent intensity (MFI). There was no significant change in perforin levels prior to the addition of targets following a 24 h incubation with a 30 μM or 10 μM concentration of atrazine (Figure 2A). The perforin MFI for CD56+ cells for each treatment was 411.7 ± 23.7, 334.2 ± 24.7, and 354.7 ± 10.3 for 30 μM, 10 μM and 0 μM, respectively. Granzyme A and B levels were also assessed prior to the addition of target cells following a 24 h exposure to atrazine. The protein levels were compared using flow cytometry and in no case did we find that a 24 h exposure to atrazine significantly changed the MFI of granzyme A or B in CD56+ cells (Figure 2B). The MFI values for granzyme A in CD56+ cells were 86.2 ± 3.1 for 30 μM, 87.4 ± 5.3 for 10 μM and 84.1 ± 1.5 for the 0 μM. The MFI values for granzyme B in CD56+ cells were 51.2 ± 0.9 for 30 μM, 50.1 ± 1.6 for 1 0μM and 50.9 ± 2.7 for the 0μM. Thus, the observed decrease in NK cell lytic function was not a result of reduced expression of the lytic proteins perforin, granzyme A or B. The data presented is representative of multiple experiments from multiple donors.
Figure 2. Quantification of lytic protein levels in ATR treated NK cells.
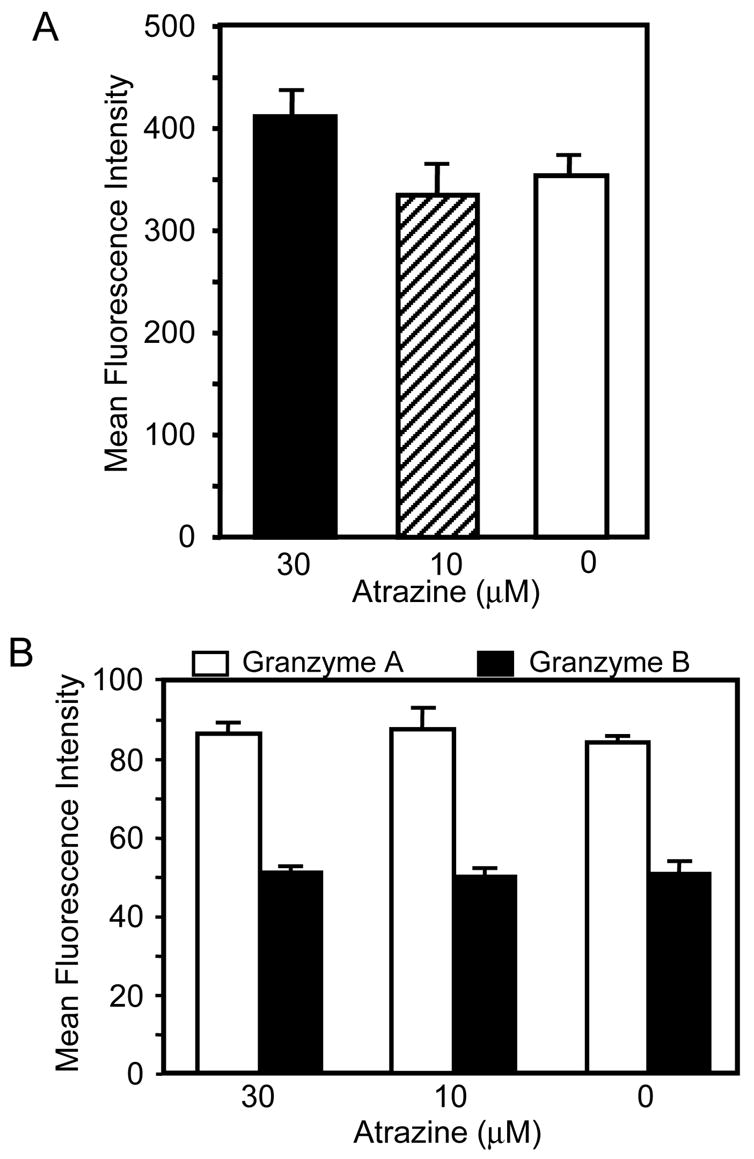
A-B) PBLs were cultured for 24 hrs with atrazine as described in Methods, surface stained with antibodies specific for CD56 (NK cell marker) and CD3 (T-cell marker), and intracellularly stained for perforin (Figure 2A), granzyme A or B (Figure 2B). The mean fluorescent intensity (MFI) of the intracellular proteins in treated and untreated CD56+CD3− cells was compared via ANOVA and t-test. There was no significant difference between the levels of perforin or granzyme A and B.
Atrazine exposure does not effect the post-translational modification of perforin
Post-translational modification of perforin and relative protein levels were assessed by a Western blot analysis of whole cell protein extract of buffy coat PBLs enriched for CD56+ cells. Western blot analysis was only performed using cells from donors in which only the CD56+ subpopulation was perforinhi. Some donors have a CD3+ CD8+ perforinhi population as assessed by flow cytometry. In these cases Western blots were not used to quantify the perforin levels following atrazine treatment. Densitometry of the 70 kD, 65 kD, and 60 kD bands were normalized to βactin and the ratios of perforin to βactin were compared between treatments. The perforin to βactin ratio represented in Figure 3B was 0.76 for 30 μM and 0.60 for the 10 μM treatment and 0.58 for the 0 μM treatment for the 70 kD band. The ratio for the 65 kD band was 1.35 for the 30 μM treatment, 1.07 for the 10 μM treatment and 1.1 for the 0μM treatment. The ratio for the 60 kD protein was 1.25 for the 30 μM treatment, 0.96 for the 10 μM treatment and 1.04 for the 0 μM treatment. The ratio of the perforin bands to one another also was not notably different between treatment and control groups. The data is representative of multiple experiments from multiple donors. The ratio of perforin bands to actin bands were compared to controls. In three experiments the average ratio to actin of all perforin visualized via Western blot from NK cells treated with 30μM of atrazine was 124% ± 35% of the control.
Figure 3. Assessment of perforin post-translational modification following a 24 h treatment with atrazine.
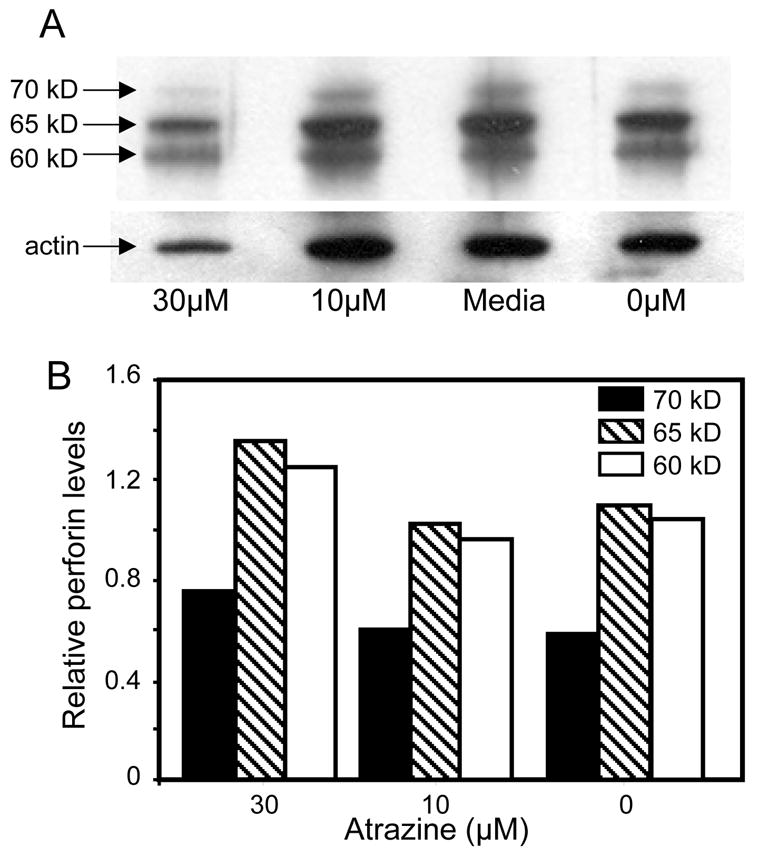
A-B) PBLs were harvested and incubated for 24 hrs in the presence of atrazine. The cultures were enriched for CD56+ cells and total cell protein was extracted as described in Methods. The total cell perforin was visualized via western blot, and the three stages of perforin post translation medication were normalized to the amount βactin in the cell extracts.
Atrazine does not affect the ability of NK cells to bind target cells
The expression levels of the adhesion molecule LFA-1 on CD56+ cells using flow cytometry was assessed following a 24 h atrazine exposure. There was no decrease in the level of LFA-1 on CD56+ cells following a 24 h exposure to atrazine (data not shown). The efficiency with which atrazine-exposed NK cells could bind to the target cell was then directly assessed. After staining K562 cells with CFSE, they were then incubated with PBLs as described in the Methods and the co-cultures were stained for CD56 specific markers. When fixed PBLs were used, no double positive events indicative of false positives (Figure 4A) or binding of anti-CD16 antibodies non-specifically to target cells were present. When live untreated PBLs were used, double positive events representing binding of the NK cell to the target cell (Figure 4A) were observed. When atrazine treated PBLs were incubated with K562 cells at varying effector-target ratios no significant change in the number of double positive due to atrazine treatment (Figure 4B) was measurable. At effector to target ratios 4 to 1, 2 to 1 and 1 to 1 the percent of double positive events for vehicle treated cultures were 7.7 ± 0.9, 4.0 ± 0.3 and 2.7 ± 0.2 respectively. The co-cultures containing atrazine treated PBLs contained 6.8 ± 0.8, 3.6 ± 0.9 and 2.7 ± 0.3 percent double positive target cells. These experiments were also repeated using anti-CD56 antibody to rule out the possibility that blocking the CD16 molecule or blocking of the CD56 molecule would produce different effects when cell-cell interaction were observed. Neither the use of an anti-CD16 antibody or anti-CD56 antibody effected NK cell-K562 cell interactions (data not shown).
Figure 4. Quantification of NK cell adhesion.
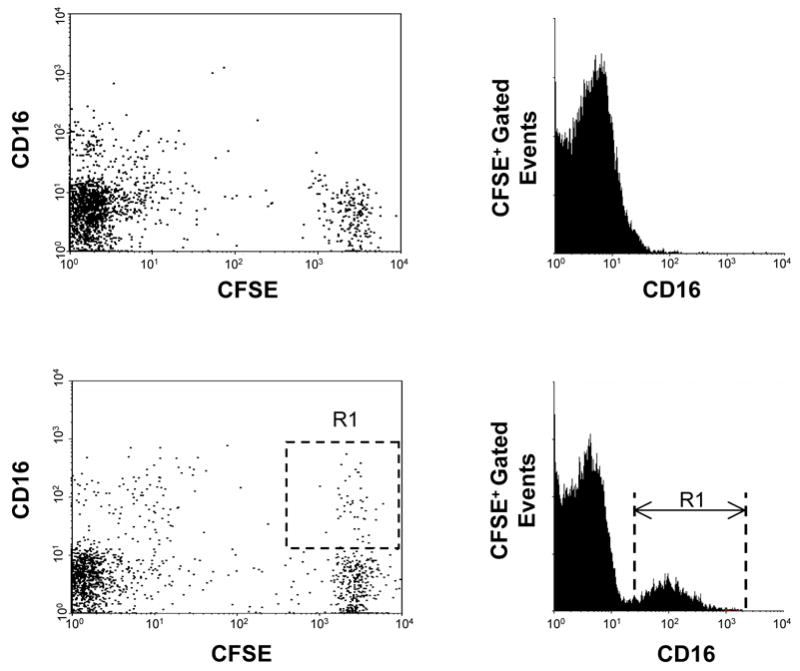
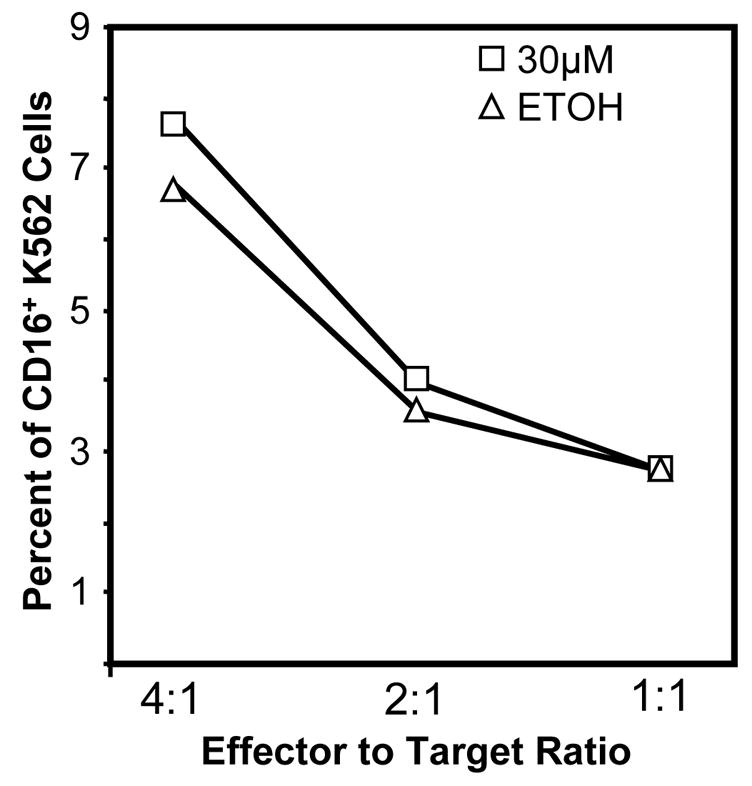
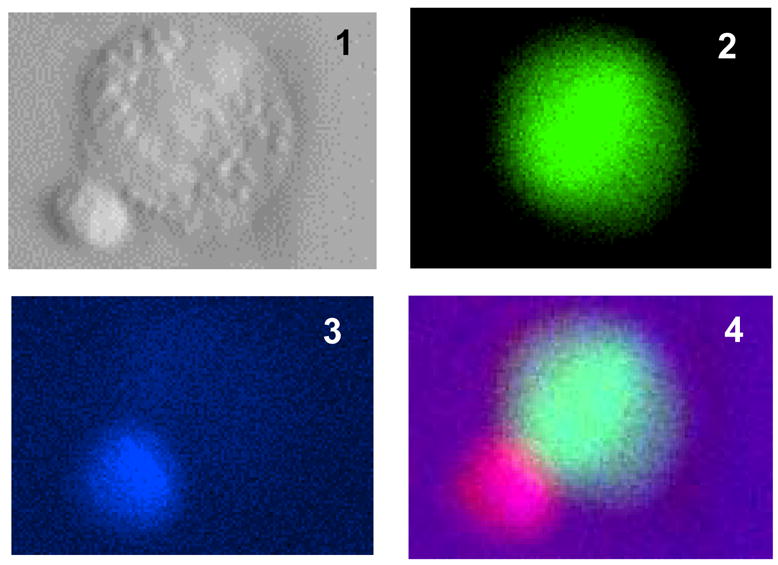
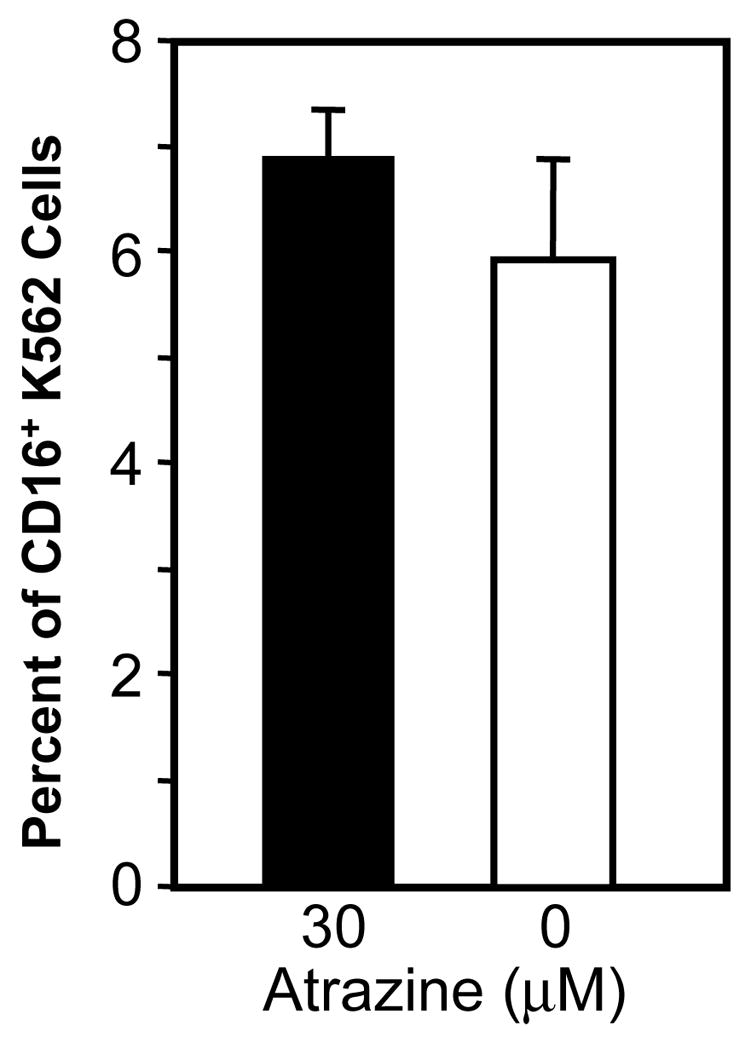
A) K562 target cells were stained with CFSE and mixed with fixed anti-CD16 conjugated to an Alexa647 fluorochrome stained PBLs. Fixed PBLs (top two panels) will not bind target cells, and the staining of co-cultures containing K562 cells and fixed PBLs produced no double positive events. K562 target cells were stained with CFSE and mixed with live PBLs stained with anti- CD16 conjugated to an Alexa647 fluorochrom (bottom two panels). The CFSE+CD16+ events, the boxed areas (R1), represent binding of NK cells to target cells. B) The percent of CD16+ events among CFSE+ target cells was determined at three effector to target ratios for atrazine and vehicle treated cells. A t-test comparison of the treatments at each ratio revealed no significant difference in NK cells adhesion and ANOVA analysis found no difference between the treatments when all data points were considered. C) Adhesion efficiency was also assessed using fluorescent microscopy. Panels 1–4 show a single adhesion event in which the NK cell is stained blue and the K562 cell green. Panel 1 is the bright field depiction, panels 2–3 are the single color channels and panel four is a composite of panels 1–3 (Magnification 40x). D) At least 200 CFSE positive events were counted per sample and samples were prepared in triplicate. The number of double positive events was determined as a percent of CFSE event counts. The difference between the samples was not significant.
Direct adhesion of the NK cell to the target cell was also assessed via fluorescent microscopy using FITC labeled target cells and pacific blue (PB) labeled NK cells (see methods). The number of PB labeled cells associated with FITC labeled target cells was enumerated as percent of target of cells counted. Figure 4C exemplifies a positive event. Panel 1 is the bright field view of an NK cell-target cell interaction. Panel 2 is the FITC channel view of the target cell, and panel 3 is the PB view of the interaction. Panel 4 is a digital combination of the three images. Figure 4D is the percent of double positive events as enumerated by fluorescent microscopy. 6.9% ± 0.5 of the labeled K562s cell were scored with NK cells adhering when the PBLs had been treated with 30 μM atrazine. 5.9% ± 1.0 of the targets were scored as bound by NK cells for vehicle treated PBLs. The percentages were determined from an enumeration of greater than 200 CFSE+ target cells from four experiments employing three different donors. These differences were not significantly different. The data is a representative experiment of multiple experiments from multiple donors.
Atrazine decreases the ability of NK cells to release granule proteins
After ligation of the target cell, the next step of the NK cell lytic process is the release of the lytic granules. Atrazine-treated (30μM) and control PBLs were incubated with K562 target cells for 4 h and the levels of the perforin in the CD56+ cells was assayed via flow cytometry following the incubation. Atrazine (30μM) treated cells had significantly (p<0.05) more intracellular perforin than the vehicle controls (Figure 5A). This indicated that the perforin was being retained by the atrazine exposed NK cells during the incubation with the K562 cells rather than released. The observed perforin MFI of the vehicle treated CD56+CD3− cell population was 46.8 ± 7.4 while the atrazine treated CD56+CD3− cells had a perforin MFI of 89.3 ± 8.0. These findings were confirmed by measuring the amount of perforin in the supernatant using a perforin-specific sandwich ELISA. PBLs incubated 24 h with a 30 μM concentration of released significantly less perforin upon incubation with K562 cells than control cells (Figure 5B). Atrazine exposed PBLs (1x10⁶) released 1042.0 ± 14.1 pg/ml when incubated with a 30μM concentration and 1431 ± 281.5 when incubated with a 10μM concentration. The value of both treatment groups was significantly different from controls (p<0/05). Untreated PBLs (1x10⁶) cultured with target released 2412.53 ± 168.9 pg/ml of perforin. This provides further evidence that atrazine reduced the ability of NK cell to release the lytic following target cell contact. The data is representative of multiple experiments from multiple donors.
Figure 5. Specific Granule Release.
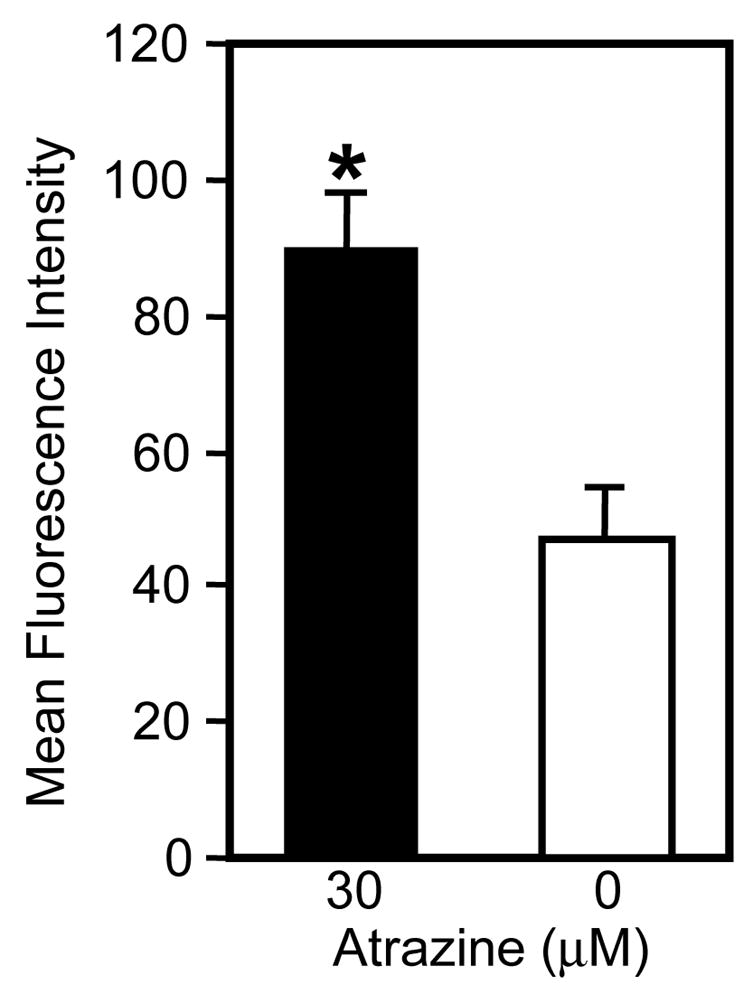
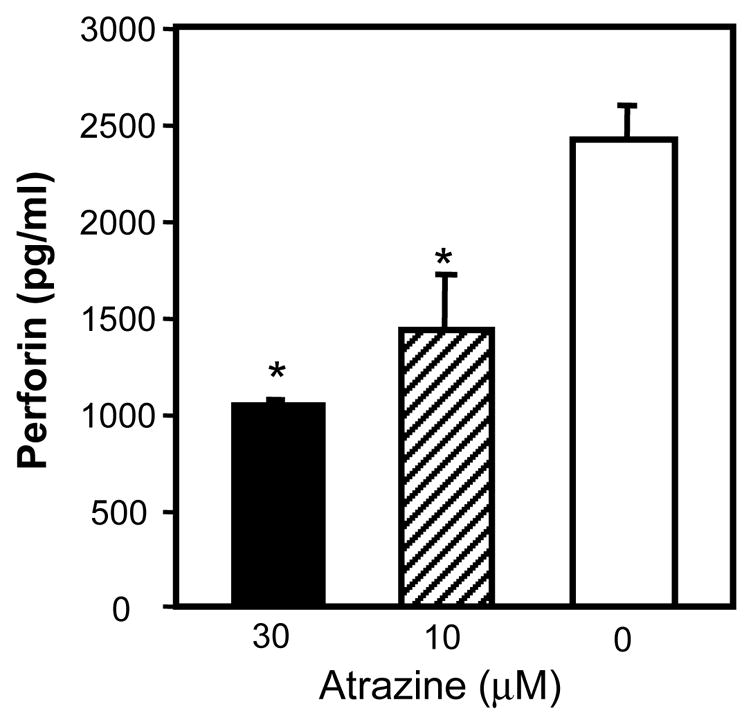
A) Using perforin levels as indicator of granule release, the amount of perforin in CD56+ cells was quantified via intracellular staining following 4 h incubation with K562 target cells. Atrazine-treated cells contained significantly more perforin than untreated cells following incubation with K562 cells (p<0.05) as determined by a standard t-test. B) PBLs were incubated with K562 cells at 20:1 ratio for 4 hrs and the supernatant of the co-cultures was collected. The amount of perforin in the supernatant was determined via ELISA. The PBLs treated with 30μM and 10μM atrazine released significantly less perforin in the presence of NK specific targets than untreated cells (p<0.05) as determined by standard T-test. The data in panel A & B are both representative of three different experiments. Measurement of perforin release and the measurement of intracellular perforin were not performed concurrently.
Discussion
As noted in the introduction, atrazine has been repeatedly demonstrated to be immunotoxic both in vitro and in vivo (Fournier et al. 1992; Hooghe et al. 2000). This report has further characterized the effects of a direct 24 h atrazine exposure on human NK cell lytic function by demonstrating that atrazine significantly inhibits human PBL lysis of NK sensitive targets cells in a concentration dependent manner (Figure 1), and sought to identify a subcellular effect of atrazine exposure which would explain this reduction in NK-specific lytic function. This analysis had two consecutive parts.
First, the condition of the NK cells following exposure to atrazine but prior to the interaction with the K562 target was assessed. NK mediated lysis of the K562 target cells is sensitive to decreases in the levels of lytic granule proteins granzyme A, granzyme B and perforin or decreases in the level the LFA-1 adhesion protein. (Arnaout 1990; Dustin and Springer 1988; Matsumoto et al. 2000b; Thomas et al. 2004). Normal lysis of the K562 cell line by NK cells is dependent on the perforin-granzyme pathway and reductions in the levels of these proteins can cause a reduction in the ability of NK cells to lyse K562 targets cell (Clement et al. 1990; Montel et al. 1995). Intracellular staining and analysis of the NK cell (CD56+) subpopulation via flow cytometry found no difference in the level of lytic granule proteins between the atrazine-treated cell population and vehicle-treated cell population (Figure 2).
Perforin undergoes several stages of post translational modification. It is initially generated as a 65 kilodalton (kD) precursor protein which is modified to a 70 kD protein (Uellner et al. 1997). The 70 kD protein is cleaved to produce the active 60 kD protein which is found in the lytic granule and is required for cell mediated apoptosis. Interruption of perforin post-translational modification inhibits perforin-granzyme mediated cell lysis (Uellner et al. 1997). Western blot analysis of the perforin present in enriched NK cell cultures found no alteration in the post-translational modification of the protein following a 24 h atrazine treatment.
Inhibition of NK cell lysis could also be caused by a block in the binding of the NK cell to the target cell. One essential component for NK cell-target cell binding is LFA-1 (Matsumoto et al. 2004; Matsumoto et al. 2000). Down-regulation or inhibition of LFA-1 expression inhibits or reduces PBL specific lysis of NK cell sensitive targets (Perez et al. 2004). NK cell-target cell adhesion and the expression level of lymphocyte function-associated antigen-1 (LFA-1), which is required for NK cell-target cell interactions; (Davis et al. 1999) was not effected by the atrazine exposure. These data indicate that atrazine exposed NK cells possess the proteins known to be essential in the specific lysis of the K562 target cell line, and that their expression was not significantly different from control cell populations. Therefore, it was hypothesized that atrazine exposure interfered with the binding of the target cell in manner independent of LFA-1 levels and subsequently the amount of granules released would be reduced.
This hypothesis was partially correct. A 24 h exposure to atrazine decreased specific lysis of K562 cells independent of any effect on the ability of the NK cells to bind to target cells. Analysis of NK cell-K562 cell interactions revealed that the ability of NK cells to form stable conjugates with the target cells was not effected by the atrazine treatments (Figure 4). The number of stable conjugates between CD16+ lymphocytes and K562 cells was determined by using both flow cytometry and fluorescent microscopy. However, not all NK cell-target cell interactions result in target cell lysis (Frederick et al., 1996; Wulfing et al. 2003). Further, it has been shown that there are regulatory check points beyond stable ligation of the NK cell to the target cell that determine NK cell lytic activity (Bryceson et al. 2005).
The subsequent release of the lytic granules from the NK cell was assessed. Despite the ability of treated cells to form stable conjugates it was found that the amount of lytic protein released by atrazine-treated NK cells following incubation with target cells was significantly less than by vehicle control cell population (Figure 5). Inhibition of granule release results in decreased or complete abolition of target cell lysis (Kopcow et al., 2005). Incubation with K562 target cells induces NK cells to expel the lytic granule proteins (MacDermott et al. 1985; Nagatake et al. 1995). The magnitude of the affect was different when observed by the different assays. Specifically, the flow cytometric assessments described a change in release between 25–50% of the controls while the ELISA detected a 55–65% reduction in perforin release. This is likely due to the fact that the measurement of intracellular proteins by flow cytometry was a more qualitative assessment relative to the controls while the ELISA provided a more quantitative assessment of perforin levels. Although atrazine treatment did not affect viability, expression of lytic protein or the ability of NK cells to form stable conjugates with target cell, it did affect the ability of NK cells to release the lytic granules.
Prior attempts to define subcellular targets for atrazine toxicity have met with limited success (Devos et al. 2003). However, Roberge et al 2004 found that atrazine concentrations as low as 10μM cause reductions in the function of the phosphodiesterase enzyme (PDE) in a cell-free model. PDE is responsible for the conversion of the signaling molecule cyclic adenosine monophosphate (cAMP) to five prime adenosine monophosphate (5’-AMP), and inhibition of PDE can cause increases in the levels of cellular cAMP. This is significant in that Goto et al 1983 and Raskovalova et al 2005 established that increases in cellular cAMP levels either through the increased production of or the addition of exogenous cAMP caused a decrease in the NK cell mediated lysis of NK cell specific targets (Goto et al. 1983; Raskovalova et al. 2005). Thus a potential target through which atrazine may effect on NK cell lytic function is the PDE protein (Roberge et al. 2004).
Another possible mechanism of action of atrazine is on the ability of treated cells to form microtubule organizational centers (MTOCs). This is a necessary prerequisite for the release of the lytic granules in human T-cells as well as NK cells and it was not directly assessed in this study (Burkhardt et al. 1993; Wulfing et al. 2003). Radoja et al (2001) observed that tumor infiltrating lymphocytes could bind target cells although the release of the granzyme B and perforin were inhibited. Radoja et al 2001 found that an unknown factor could cause a specific inhibition of MTOC formation despite tyrosine kinase activity by the receptor molecules (Radoja et al. 2001). Thus, it is reasonable to assume that MTOC formation would be effected by atrazine exposure considering the decreased levels of granule release. MTOC mobilization in the NK cell is dependant on SRC or SYK/SRC mediated activation of phosphatidylinositol 3-kinase (PI3-kinase) signaling (Brumbaugh et al. 1997). The PI3-K molecule activates Rac and allows for signaling along the extracellular signal-regulated kinase (ERK) pathway (Vivier et al. 2004). Whether or not atrazine affects any of the specific molecules of this pathway is not yet known. Atrazine induced inhibitions of granule release suggest that atrazine may be effecting the MTOC process at some point, and in addition to PDE function follow up study of the NK cell activity following atrazine exposure should consider the afore mentioned signaling pathway.
Extrapolation of in vitro findings to an estimate of human risk often begins with correlating the in vitro exposure concentrations with the human body burden. Accurately measuring human body burden requires controlling a very long list of confounding factors. Some of these confounding factors are readily identifiable (e.g., occupation, gender and age), and are typically well controlled. Curwin et al. 2007 measured atrazine metabolite levels in the urine of male farm applicators, and found a maximum level of 68 μg/L (0.3 μM) which is identical to the minimum effective level (MEL) reported by Hooghe et al. 2000 and approximates our MEL of 3.0 μM. Studies of the pharmacokinetics of atrazine in rats found that single oral dose of atrazine resulted in blood plasma levels concentrations that were twice as high urine levels a week after dosing (McMullin et al. 2003). The studies of human urine levels thus suggest a plasma concentration higher than that found in the urine and it is in the peripheral blood tissue in which we would expect NK cells to encounter atrazine. The apparent conclusion, based on the data from human urine (Curwin et al 2007), is that the dose-to-effect correlation of the studies reported herein have a direct relevance to human exposures. In vitro experiments at concentrations that do not reduce cell viability often provide mechanistic information on how the pesticide (xenobiotic) affects cells which can then lead to a reassessment of what would be an appropriate indicator of the potential risk to humans. For example, prior to the results reported herein, it would have been viewed as impractical to perform a study to correlate serum atrazine or metabolite levels with NK cell perforin granule release, but given our results such a study would be both feasible and very informative.
In summary, this data indicates that atrazine inhibition of NK cell specific lysis is the result of an inhibition of granule release. In other studies, measurements of granule release have been considered to be a surrogate for a measurement of target cell death (Nagatake et al. 1995). However, in the assessment of a toxic effect, each step must be measured directly because the sight of action is yet unknown. It has been noted in studies of CTL and NK cell lytic behavior that inhibition of cytotoxic activity can be induced by alterations of cell function at any of several levels. Here it has been demonstrated that atrazine does not decrease the levels of lytic proteins, or the ability of the NK cell to bind to the target cell, but does inhibit the ability the NK cells to release lytic granules. Specific inhibition of granule release has been shown to be a means of tumor cell resistance to cell mediated apoptosis (Radoja et al. 2001). Studies of the effects of atrazine on NK cell function may help us to discern which cell functions are potential targets for the disruption of specific release of the granule. The wide spread human exposure to atrazine makes a necessity of determining the means by which this compound affects immune function.
Footnotes
Publisher's Disclaimer: This is a PDF file of an unedited manuscript that has been accepted for publication. As a service to our customers we are providing this early version of the manuscript. The manuscript will undergo copyediting, typesetting, and review of the resulting proof before it is published in its final citable form. Please note that during the production process errors may be discovered which could affect the content, and all legal disclaimers that apply to the journal pertain.
Reference List
- 1.Adgate JL, Barr DB, Clayton CA, Eberly LE, Freeman NC, Lioy PJ, Needham LL, Pellizzari ED, Quackenboss JJ, Roy A, Sexton K. Measurement of children's exposure to pesticides: analysis of urinary metabolite levels in a probability-based sample. Environ Health Perspect. 2001;109(6):583–590. doi: 10.1289/ehp.01109583. [DOI] [PMC free article] [PubMed] [Google Scholar]
- 2.Arnaout MA. Leukocyte adhesion molecules deficiency: its structural basis, pathophysiology and implications for modulating the inflammatory response. Immunol Rev. 1990;114:145–180. doi: 10.1111/j.1600-065x.1990.tb00564.x. [DOI] [PubMed] [Google Scholar]
- 3.Brumbaugh KM, Binstadt BA, Billadeau DD, Schoon RA, Dick CJ, Ten RM, Leibson PJ. Functional role for Syk tyrosine kinase in natural killer cell-mediated natural cytotoxicity. J Exp Med. 1997;186(12):1965–1974. doi: 10.1084/jem.186.12.1965. [DOI] [PMC free article] [PubMed] [Google Scholar]
- 4.Bryceson YT, March ME, Barber DF, Ljunggren HG, Long EO. Cytolytic granule polarization and degranulation controlled by different receptors in resting NK cells. J Exp Med. 2005;202(7):1001–1012. doi: 10.1084/jem.20051143. [DOI] [PMC free article] [PubMed] [Google Scholar]
- 5.Burkhardt JK, McIlvain JM, Jr, Sheetz MP, Argon Y. Lytic granules from cytotoxic T cells exhibit kinesin-dependent motility on microtubules in vitro. J Cell Sci. 1993;104 ( Pt 1):151–162. doi: 10.1242/jcs.104.1.151. [DOI] [PubMed] [Google Scholar]
- 6.Clement MV, Haddad P, Soulie A, Legros-Maida S, Guillet J, Cesar E, Sasportes M. Involvement of granzyme B and perforin gene expression in the lytic potential of human natural killer cells. Res Immunol. 1990;141(6):477–489. doi: 10.1016/0923-2494(90)90017-s. [DOI] [PubMed] [Google Scholar]
- 7.Cooper RL, Goldman JM, Stoker TE. Neuroendocrine and reproductive effects of contemporary-use pesticides. Toxicol Ind Health. 1999;15(1–2):26–36. doi: 10.1177/074823379901500104. [DOI] [PubMed] [Google Scholar]
- 8.Curwin BD, Hein MJ, Sanderson WT, Nishioka MG, Reynolds SJ, Ward EM, Alavanja MC. Pesticide contamination inside farm and nonfarm homes. J Occup Environ Hyg. 2005;2(7):357–367. doi: 10.1080/15459620591001606. [DOI] [PubMed] [Google Scholar]
- 9.Curwin BD, Hein MJ, Sanderson WT, Striley C, Heederik D, Kromhout H, Reynolds SJ, Alavanja MC. Urinary pesticide concentrations among children, mothers and fathers living in farm and non-farm households in iowa. Ann Occup Hyg. 2007;51(1):53–65. doi: 10.1093/annhyg/mel062. [DOI] [PubMed] [Google Scholar]
- 10.Davis DM, Chiu I, Fassett M, Cohen GB, Mandelboim O, Strominger JL. The human natural killer cell immune synapse. Proc Natl Acad Sci U S A. 1999;96(26):15062–15067. doi: 10.1073/pnas.96.26.15062. [DOI] [PMC free article] [PubMed] [Google Scholar]
- 11.Devos S, De Bosscher K, Staels B, Bauer E, Roels F, Berghe W, Haegeman G, Hooghe R, Hooghe-Peters EL. Inhibition of cytokine production by the herbicide atrazine. Search for nuclear receptor targets. Biochem Pharmacol. 2003;65(2):303–308. doi: 10.1016/s0006-2952(02)01507-1. [DOI] [PubMed] [Google Scholar]
- 12.Devos S, Van Den HR, Hooghe R, Hooghe-Peters EL. Limited effect of selected organic pollutants on cytokine production by peripheral blood leukocytes. Eur Cytokine Netw. 2004;15(2):145–151. [PubMed] [Google Scholar]
- 13.Dustin ML, Springer TA. Lymphocyte function-associated antigen-1 (LFA-1) interaction with intercellular adhesion molecule-1 (ICAM-1) is one of at least three mechanisms for lymphocyte adhesion to cultured endothelial cells. J Cell Biol. 1988;107(1):321–331. doi: 10.1083/jcb.107.1.321. [DOI] [PMC free article] [PubMed] [Google Scholar]
- 14.Rossi L, editor. EPA. Interim Reregistration Eligibility Decision. Washington DC: Enviornmental Protection Agency; 2003. pp. 1–103.pp. 1–31. [Google Scholar]
- 15.Fournier M, Friborg J, Girard D, Mansour S, Krzystyniak K. Limited immunotoxic potential of technical formulation of the herbicide atrazine (AAtrex) in mice. Toxicol Lett. 1992;60(3):263–274. doi: 10.1016/0378-4274(92)90284-q. [DOI] [PubMed] [Google Scholar]
- 16.Frederick MJ, Yu TK, Krohn EG, Johnston DA, Grimm EA. Protein tyrosine kinase inhibition blocks granule exocytosis and cytolytic function of lymphokine-activated killer cells. Immunopharmacology. 1996;35(2):83–102. doi: 10.1016/s0162-3109(96)00115-4. [DOI] [PubMed] [Google Scholar]
- 17.Frey M, Packianathan NB, Fehniger TA, Ross ME, Wang WC, Stewart CC, Caligiuri MA, Evans SS. Differential expression and function of L-selectin on CD56bright and CD56dim natural killer cell subsets. J Immunol. 1998;161(1):400–408. [PubMed] [Google Scholar]
- 18.Goto T, Herberman RB, Maluish A, Strong DM. Cyclic AMP as a mediator of prostaglandin E-induced suppression of human natural killer cell activity. J Immunol. 1983;130(3):1350–1355. [PubMed] [Google Scholar]
- 19.Hooghe RJ, Devos S, Hooghe-Peters EL. Effects of selected herbicides on cytokine production in vitro. Life Sci. 2000;66(26):2519–2525. doi: 10.1016/s0024-3205(00)00586-5. [DOI] [PubMed] [Google Scholar]
- 20.Karrow NA, McCay JA, Brown RD, Musgrove DL, Guo TL, Germolec DR, White KL., Jr Oral exposure to atrazine modulates cell-mediated immune function and decreases host resistance to the B16F10 tumor model in female B6C3F1 mice. Toxicology. 2005;209(1):15–28. doi: 10.1016/j.tox.2004.12.002. [DOI] [PubMed] [Google Scholar]
- 21.Kopcow HD, Allan DS, Chen X, Rybalov B, Andzelm MM, Ge B, Strominger JL. Human decidual NK cells form immature activating synapses and are not cytotoxic. Proc Natl Acad Sci U S A. 2005;102(43):15563–15568. doi: 10.1073/pnas.0507835102. [DOI] [PMC free article] [PubMed] [Google Scholar]
- 22.MacDermott RP, Schmidt RE, Caulfield JP, Hein A, Bartley GT, Ritz J, Schlossman SF, Austen KF, Stevens RL. Proteoglycans in cell-mediated cytotoxicity. Identification, localization, and exocytosis of a chondroitin sulfate proteoglycan from human cloned natural killer cells during target cell lysis. J Exp Med. 1985;162(6):1771–1787. doi: 10.1084/jem.162.6.1771. [DOI] [PMC free article] [PubMed] [Google Scholar]
- 23.Matsumoto G, Kubota E, Omi Y, Lee U, Penninger JM. Essential role of LFA-1 in activating Th2-like responses by alpha-galactosylceramide-activated NKT cells. J Immunol. 2004;173(8):4976–4984. doi: 10.4049/jimmunol.173.8.4976. [DOI] [PubMed] [Google Scholar]
- 24.Matsumoto G, Omi Y, Lee U, Nishimura T, Shindo J, Penninger JM. Adhesion mediated by LFA-1 is required for efficient IL-12-induced NK and NKT cell cytotoxicity. Eur J Immunol. 2000b;30(12):3723–3731. doi: 10.1002/1521-4141(200012)30:12<3723::AID-IMMU3723>3.0.CO;2-9. [DOI] [PubMed] [Google Scholar]
- 25.Matsumoto G, Omi Y, Lee U, Nishimura T, Shindo J, Penninger JM. Adhesion mediated by LFA-1 is required for efficient IL-12-induced NK and NKT cell cytotoxicity. Eur J Immunol. 2000a;30(12):3723–3731. doi: 10.1002/1521-4141(200012)30:12<3723::AID-IMMU3723>3.0.CO;2-9. [DOI] [PubMed] [Google Scholar]
- 26.McMullin TS, Brzezicki JM, Cranmer BK, Tessari JD, Andersen ME. Pharmacokinetic modeling of disposition and time-course studies with [14C]atrazine. J Toxicol Environ Health A. 2003;66(10):941–964. doi: 10.1080/15287390306454. [DOI] [PubMed] [Google Scholar]
- 27.Mencoboni M, Lerza R, Bogliolo G, Flego G, Pannacciulli I. Effect of atrazine on hemopoietic system. In Vivo. 1992;6(1):41–44. [PubMed] [Google Scholar]
- 28.Montel AH, Bochan MR, Hobbs JA, Lynch DH, Brahmi Z. Fas involvement in cytotoxicity mediated by human NK cells. Cell Immunol. 1995;166(2):236–246. doi: 10.1006/cimm.1995.9974. [DOI] [PubMed] [Google Scholar]
- 29.Nagatake H, Watanabe N, Kobayashi Y. Granule exocytosis in a cultured human natural killer cell-rich population induced by K562 target cells and by PMA/A23187. Cell Immunol. 1995;161(2):295–298. doi: 10.1006/cimm.1995.1039. [DOI] [PubMed] [Google Scholar]
- 30.Orange JS, Harris KE, Andzelm MM, Valter MM, Geha RS, Strominger JL. The mature activating natural killer cell immunologic synapse is formed in distinct stages. Proc Natl Acad Sci U S A. 2003;100(24):14151–14156. doi: 10.1073/pnas.1835830100. [DOI] [PMC free article] [PubMed] [Google Scholar]
- 31.Perez OD, Mitchell D, Jager GC, Nolan GP. LFA-1 signaling through p44/42 is coupled to perforin degranulation in CD56+CD8+ natural killer cells. Blood. 2004;104(4):1083–1093. doi: 10.1182/blood-2003-08-2652. [DOI] [PubMed] [Google Scholar]
- 32.Perry M, Christiani D, Dagenhart D, Tortorelli J, Singzoni B. Urinary biomarkers of atrazine exposure among farm pesticide applicators. Ann Epidemiol. 2000;10(7):479. doi: 10.1016/s1047-2797(00)00150-2. [DOI] [PubMed] [Google Scholar]
- 33.Perry MJ, Christiani DC, Mathew J, Degenhardt D, Tortorelli J, Strauss J, Sonzogni WC. Urinalysis of atrazine exposure in farm pesticide applicators. Toxicol Ind Health. 2001;16(7–8):285–290. doi: 10.1177/074823370001600705. [DOI] [PubMed] [Google Scholar]
- 34.Radoja S, Saio M, Schaer D, Koneru M, Vukmanovic S, Frey AB. CD8(+) tumor-infiltrating T cells are deficient in perforin-mediated cytolytic activity due to defective microtubule-organizing center mobilization and lytic granule exocytosis. J Immunol. 2001;167(9):5042–5051. doi: 10.4049/jimmunol.167.9.5042. [DOI] [PubMed] [Google Scholar]
- 35.Raskovalova T, Huang X, Sitkovsky M, Zacharia LC, Jackson EK, Gorelik E. Gs protein-coupled adenosine receptor signaling and lytic function of activated NK cells. J Immunol. 2005;175(7):4383–4391. doi: 10.4049/jimmunol.175.7.4383. [DOI] [PubMed] [Google Scholar]
- 36.Roberge M, Hakk H, Larsen G. Atrazine is a competitive inhibitor of phosphodiesterase but does not affect the estrogen receptor. Toxicol Lett. 2004;154(1–2):61–68. doi: 10.1016/j.toxlet.2004.07.005. [DOI] [PubMed] [Google Scholar]
- 37.Rodriguez VM, Thiruchelvam M, Cory-Slechta DA. Sustained exposure to the widely used herbicide atrazine: altered function and loss of neurons in brain monoamine systems. Environ Health Perspect. 2005;113(6):708–715. doi: 10.1289/ehp.7783. [DOI] [PMC free article] [PubMed] [Google Scholar] [Retracted]
- 38.Sanderson JT, Letcher RJ, Heneweer M, Giesy JP, van den BM. Effects of chloro-s-triazine herbicides and metabolites on aromatase activity in various human cell lines and on vitellogenin production in male carp hepatocytes. Environ Health Perspect. 2001;109(10):1027–1031. doi: 10.1289/ehp.011091027. [DOI] [PMC free article] [PubMed] [Google Scholar]
- 39.Sedlmayr P, Schallhammer L, Hammer A, Wilders-Truschnig M, Wintersteiger R, Dohr G. Differential phenotypic properties of human peripheral blood CD56dim+ and CD56bright+ natural killer cell subpopulations. Int Arch Allergy Immunol. 1996;110(4):308–313. doi: 10.1159/000237321. [DOI] [PubMed] [Google Scholar]
- 40.Thomas LD, Shah H, Green SA, Bankhurst AD, Whalen MM. Tributyltin exposure causes decreased granzyme B and perforin levels in human natural killer cells. Toxicology. 2004;200(2–3):221–233. doi: 10.1016/j.tox.2004.04.002. [DOI] [PubMed] [Google Scholar]
- 41.Trapani JA, Smyth MJ. Functional significance of the perforin/granzyme cell death pathway. Nat Rev Immunol. 2002;2(10):735–747. doi: 10.1038/nri911. [DOI] [PubMed] [Google Scholar]
- 42.Trotta R, Parihar R, Yu J, Becknell B, Allard J, Wen J, Ding W, Mao H, Tridandapani S, Carson WE, Caligiuri MA. Differential expression of SHIP1 in CD56bright and CD56dim NK cells provides a molecular basis for distinct functional responses to monokine costimulation. Blood. 2005;105(8):3011–3018. doi: 10.1182/blood-2004-10-4072. [DOI] [PubMed] [Google Scholar]
- 43.Uellner R, Zvelebil MJ, Hopkins J, Jones J, MacDougall LK, Morgan BP, Podack E, Waterfield MD, Griffiths GM. Perforin is activated by a proteolytic cleavage during biosynthesis which reveals a phospholipid-binding C2 domain. EMBO J. 1997;16(24):7287–7296. doi: 10.1093/emboj/16.24.7287. [DOI] [PMC free article] [PubMed] [Google Scholar]
- 44.Vitale M, Della CM, Carlomagno S, Romagnani C, Thiel A, Moretta L, Moretta A. The small subset of CD56bright. Eur J Immunol. 2004;34(6):1715–1722. doi: 10.1002/eji.200425100. [DOI] [PubMed] [Google Scholar]
- 45.Vyas YM, Maniar H, Dupont B. Visualization of signaling pathways and cortical cytoskeleton in cytolytic and noncytolytic natural killer cell immune synapses. Immunol Rev. 2002;189:161–178. doi: 10.1034/j.1600-065x.2002.18914.x. [DOI] [PubMed] [Google Scholar]
- 46.Vyas YM, Mehta KM, Morgan M, Maniar H, Butros L, Jung S, Burkhardt JK, Dupont B. Spatial organization of signal transduction molecules in the NK cell immune synapses during MHC class I-regulated noncytolytic and cytolytic interactions. J Immunol. 2001;167(8):4358–4367. doi: 10.4049/jimmunol.167.8.4358. [DOI] [PubMed] [Google Scholar]
- 47.Vivier E, Nunes JA, Vely F. Natural killer cell signaling pathways. Science. 2004;306(5701):1517–1519. doi: 10.1126/science.1103478. [DOI] [PubMed] [Google Scholar]
- 48.Whalen MM, Loganathan BG, Yamashita N, Saito T. Immunomodulation of human natural killer cell cytotoxic function by triazine and carbamate pesticides. Chem Biol Interact. 2003;145(3):311–319. doi: 10.1016/s0009-2797(03)00027-9. [DOI] [PubMed] [Google Scholar]
- 49.Whiteside TL, Herberman RB. Role of human natural killer cells in health and disease. Clin Diagn Lab Immunol. 1994;1(2):125–133. doi: 10.1128/cdli.1.2.125-133.1994. [DOI] [PMC free article] [PubMed] [Google Scholar]
- 50.Wulfing C, Purtic B, Klem J, Schatzle JD. Stepwise cytoskeletal polarization as a series of checkpoints in innate but not adaptive cytolytic killing. Proc Natl Acad Sci U S A. 2003;100(13):7767–7772. doi: 10.1073/pnas.1336920100. [DOI] [PMC free article] [PubMed] [Google Scholar]