

Here we present new technology for optical coherence tomography (OCT) that enables ultrahigh-resolution, non-invasive in vivo ophthalmologic imaging of retinal and corneal morphology with an axial resolution of 2–3 μm. This resolution represents a significant advance in performance over the 10–15-μm resolution currently available in ophthalmic OCT systems and, to our knowledge, is the highest resolution for in vivo ophthalmologic imaging achieved to date. This resolution enables in vivo visualization of intraretinal and intra-corneal architectural morphology that had previously only been possible with histopathology. We demonstrate image processing and segmentation techniques for automatic identification and quantification of retinal morphology. Ultrahigh-resolution OCT promises to enhance early diagnosis and objective measurement for tracking progression of ocular diseases, as well as monitoring the efficacy of therapy.
Current clinical practice emphasizes the development of techniques to diagnose disease in its early stages, when treatment is most effective and irreversible damage can be prevented or delayed. In ophthalmology, the precise visualization of pathology is especially critical for the diagnosis and staging of ocular diseases. Therefore, new imaging techniques have been developed to augment conventional fundoscopy and slit-lamp biomicroscopy. Ultrasonography is routinely used in ophthalmology, but requires physical contact with the eye and has axial resolutions of approximately 200 μm (ref. 1). High-frequency ultrasound enables approximately 20 μm axial resolutions, but due to limited penetration, only anterior eye structures can be imaged2. Confocal microscopy has been used to image the cornea with sub-micrometer transverse resolution3. Scanning laser ophthalmoscopy enables en face fundus imaging with micron-scale transverse and approximately 300-μm axial resolution4,5. None of these techniques, however, permits high-resolution, cross-sectional imaging of the retina in vivo.
Recently, optical coherence tomography (OCT) has emerged as a promising new technique for high-resolution, cross-sectional imaging6,7. OCT is attractive for ophthalmic imaging because image resolutions are 1–2 orders of magnitude higher than conventional ultrasound, imaging can be performed non-invasively and in real time, and quantitative morphometric information can be obtained. OCT is somewhat analogous to ultrasound imaging except that it uses light instead of sound. High-resolution, cross-sectional images are obtained by measuring the echo time delay of reflected infrared light using a technique known as low coherence interferometry8,9. OCT imaging was first demonstrated in the human retina in vitro6 and in vivo10,11. Recently, it has been extended to a wide range of other non-transparent tissues to function as a type of optical biopsy12–15. To date, however, the most important clinical applications of OCT have been retinal imaging in ophthalmic diagnosis7,16–22. Current ophthalmic OCT systems have 10–15-μm axial resolution and provide more detailed structural information than any other non-invasive ophthalmic imaging technique6,7,10,11. However, the resolution of current clinical ophthalmic OCT technology is significantly below what is theoretically possible. Improving the resolution of OCT ophthalmic imaging would enable structural imaging of retinal pathology at an intraretinal level, as well as improve the accuracy of morphometric quantification.
The axial resolution of conventional ophthalmic OCT systems is limited to 10–15 μm by the bandwidth of light sources used for imaging. Short-pulse, solid-state lasers can generate ultrabroad bandwidth, low-coherence light13. A broadband Cr:Forsterite laser operating in the near infrared (1,300 nm) has permitted cellular-level OCT imaging in developmental biology specimens with 6-μm axial resolution13. For ophthalmic imaging, light sources operating at 800 nm are necessary to avoid absorption in the ocular media. Recently, a state-of-the-art broadband Ti:Al2O3 laser has been developed for ultrahigh (~1 μm) axial resolution, spectroscopic OCT imaging in non-transparent tissue at 800-nm center wavelength23,24. We describe here ultrahigh-resolution ophthalmic OCT based on this state-of-the-art optical technology and demonstrate its potential to provide enhanced structural and quantitative information for ophthalmologic imaging.
Ultrahigh-resolution OCT
Ultrahigh-resolution, in vivo ophthalmic imaging with axial resolutions of 2–3 μm was demonstrated in normal human subjects with a new OCT imaging system using a state-of-the-art Ti:Al2O3 laser25. Using image-processing techniques, we identified and quantitatively measured retinal architectural morphology. A comparison of conventional (top) and ultrahigh-resolution (middle) OCT images of the retina along the papillomacular axis (spanning the fovea and the optic disc) of a normal human subject is shown in Fig. 1. The axial resolution is approximately 3 μm, as determined by measuring the full-width half maximum of isolated reflections from structures in the retina. The axial dimension of the OCT image is normalized by the index of refraction (1.36) to convert optical delay into geometrical distances. The transverse resolution is governed by the numerical aperture of the pupil and is approximately 15 μm in all of the retinal OCT images. Ultrahigh-resolution OCT enables visualization of the foveal and optic disc contour, as well as internal architectural morphology of the retina and choroid that is not resolvable with conventional resolution OCT. The retinal nerve fiber layer (NFL) is clearly differentiated in Fig. 1, and the variation of its thickness towards the optic disc, where the ganglion cell axons penetrate the sclera, can be observed26. The thickening of the NFL coincides with a decrease in the ganglion cell layer from the fovea to the optic disc27. The thickness of the NFL, as well as the macular ganglion cell layer, may be an important indictor for early glaucomatous changes28. Choroidal vasculature in and around the optic disc can also be resolved.
Fig. 1.

Conventional (top) and ultrahigh-resolution (bottom) in vivo OCT images along the papillomacular axis. The log of the backscattered light intensity (from 5 to 45 dB) is represented on a false-color scale. Axial resolution is 10 μm (top) and 3 μm (bottom). The image sizes are 8.46 × 0.95 mm (transverse × axial, top) and 8.43 × 0.82 mm (bottom). The image has been expanded by a factor of two in the axial direction. Conventional and ultrahigh-resolution OCT images were acquired with 100 × 180 (transverse × axial) and 600 × 725 pixel sampling, respectively. This corresponds to a pixel spacing of 84.6 × 5.2 μm (transverse × axial) and 14.1 × 1.1 μm, respectively. The nerve fiber layer is well differentiated and varies in thickness between the fovea and optic disc.
A comparison of an in vivo cross-sectional, ultrahigh-resolution OCT image of a normal human macula, compared to a textbook histological micrograph26, is shown in Fig. 2. These results demonstrate that ultrahigh-resolution ophthalmic OCT enables in vivo visualization of retinal architectural morphology. The retina is usually divided into ten distinct layers, including four cell layers and two layers of neuronal interconnections26,27,29. Several of these layers can be resolved by ultrahigh-resolution ophthalmic OCT (Fig. 2). Layers that consist of nerve fibers or plexiform layers are optically backscattering, whereas nuclear layers are weakly backscattering. The internal limiting membrane (ILM) has previously only been visible with electron microscopy and is not resolved with OCT. The obliquely running photoreceptor axons are sometimes considered as a separate layer in the outer plexiform layer (OPL), known as Henle’s fiber layer, and is highly backscattering26. Note that the junction between the inner and outer segment of the photoreceptors (IS/OS PR) could be visualized. This structure is not a physical membrane, but an alignment of junctional complexes between Müller cells and photoreceptor cells30. The retinal pigment epithelium (RPE), which contains melanin, is a very strongly backscattering layer31. Bruch’s membrane, which is only 1–4-μm thick, could not be visualized32. The choriocapillaris is vascular and strongly backscattering.
Fig. 2.
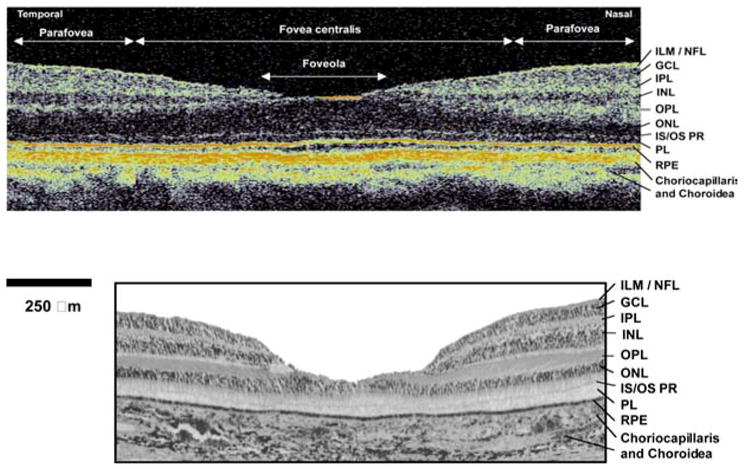
Comparison of an in vivo ultrahigh-resolution OCT image (top) of the normal human macula to a histologic micrograph of the normal macula (bottom) taken from an ophthalmic textbook26. The OCT image has 1:1 aspect ratio to permit comparison to histology. Several layers can be resolved and have been labeled in the image: Inner limiting membrane (ILM), nerve fiber layer (NFL), ganglion cell layer (GCL), inner plexiform layer (IPL), inner nuclear layer (INL), junction between the inner and outer segment of the photoreceptors (IS/OS PR), outer nuclear layer (ONL), retinal pigment epithelium (RPE). The foveola, fovea centralis, as well as the parafoveal region, are also indicated. (Histological micrograph reproduced with permission from Stereoscopic Atlas of Macular Diseases: Diagnosis and Treatment26.)
Ultrahigh-resolution OCT images can be processed using segmentation algorithms to identify and quantitatively measure intraretinal structure relevant for the early diagnosis and monitoring of ophthalmologic diseases. Examples of a segmented OCT image of the fovea (a), the measured thicknesses of the various retinal layers (b), and a measurement of the retinal layers along the papillomacular axis (c) are shown in Fig. 3. Expert segmentation algorithms using boundary detection17,20,21 were developed to identify retinal layers in the OCT image automatically for rapid measurement and interpretation. Errors in the boundary detection from signal dropouts or blood vessels result in sharp discontinuities in the boundaries and are corrected using a transverse continuity condition. The thickness of the retinal structures is calculated using the thickness measured from the OCT images divided by the group refractive index (1.36) of the retina17,20,21. In the foveal region (Fig. 3a and b), the measured retinal thickness, that is, the distance from the ILM to the RPE, varies from a minimum of 155 μm in the foveola to a maximum 275 μm in the nasal perifoveal region. The NFL was segmented only in the nasal portion, but the numerical values are not plotted as it is extremely thin (mean: 12 μm). Instead the NFL has been included with the ganglion cell layer (GCL) and inner plexiform layer (IPL) and the combined thickness of these three layers plotted. The optical contrast between the GCL and IPL layers was insufficient to segment them individually. In the foveola region, the retina consists mainly of the outer nuclear and the photoreceptor layer (Fig. 3a and b), in agreement with the expected retinal morphology26. The GCL and IPL are thickest in the parafoveal region (mean: 100 μm). The mean values of the inner nuclear layer (INL) and OPL in this area are 38 μm and 23 μm, respectively, also in agreement with the literature33,34. The mean RPE layer thickness was 9 μm (ref. 31). The layers corresponding to the choriocapillaris and superficial choroidal layers had a mean thickness of 24 μm and 32 μm, respectively. Fig. 3c shows thickness measurements of the retinal NFL, GCL and IPL, as well as retinal thickness obtained by segmenting a papillomacular OCT image (data not shown). The visualization and measurement of the NFL is especially important for glaucoma diagnosis. The NFL thickens towards the optic disc, whereas the GCL and IPL thicknesses decrease. This is consistent with retinal morphology, which indicates that the GCL is two or fewer cells in thickness in the extramacular retina, and five or more cells in thickness at the fovea26. Precise quantification of the GCL thickness in the macular region might be an indicator for early glaucoma diagnosis28.
Fig. 3.
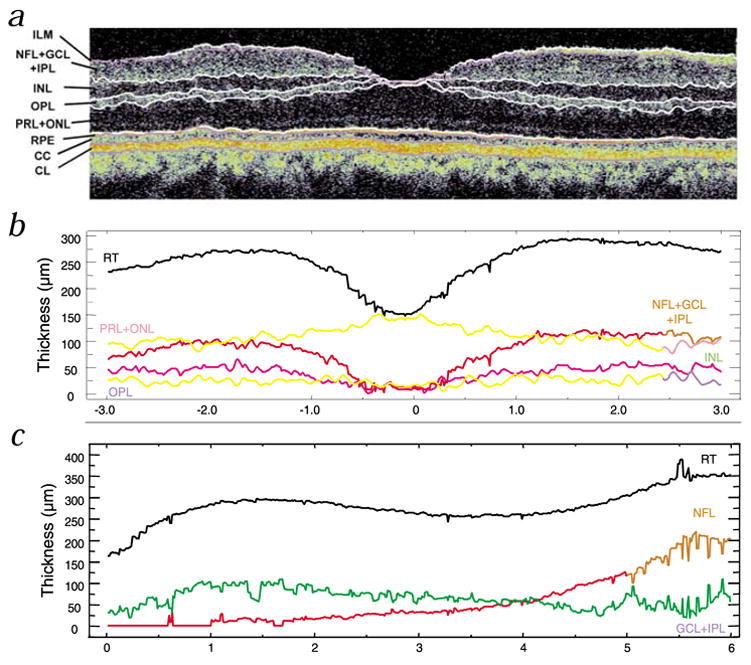
Quantification of intraretinal structures. a, Image-processed, segmented OCT image of the fovea. b, Corresponding plot of thickness of the retinal layers. c, Plot of thickness of retinal layers along the papillomacular axis. (The segmented OCT image of the papillomacular axis is not shown, but similar to that in Fig. 1.) The tomogram has been expanded by a factor of three in the vertical direction for better visualization of the retinal substructure. The measured thicknesses of the segmented layers (except the RPE and choroidal layers) are plotted as a function of transverse position (b and c). Clear visualization and quantification of the NFL is especially important for glaucoma diagnosis (c). NFL thickness increases towards the optic disc with a corresponding reduction in the thickness of the GCL and IPL layer towards the optic disc (see c). Choriocapillaris (CC); choroidal layer (CL); ganglion cell layer (GCL); inner plexiform layer (IPL); inner nuclear layer (INL); internal limiting membrane (ILM); nerve fiber layer (NFL); outer plexiform layer (OPL); photo receptor layer (PRL); retinal pigment epithelium (RPE); retinal thickness (RT).
In addition to the retina, ultrahigh-resolution OCT can also image the anterior segment with unprecedented resolution. In this case, the transverse resolution can be improved significantly because the pupil does not limit the numerical aperture for beam focusing. An in vivo ultrahigh-resolution OCT image of the cornea of a normal human subject with approximately 2 μm axial and 6 μm transverse resolutions is shown in Fig. 4. The corneal epithelium, Bowman’s layer, intrastromal morphology (for example, corneal lamellae) can clearly be differentiated. Descement’s membrane was not resolved, possibly because of insufficient contrast between the endothelium and stroma. The endothelial surface of the cornea is also visible, although the endothelial cell layer is approaching the image resolution and is difficult to differentiate.
Fig. 4.
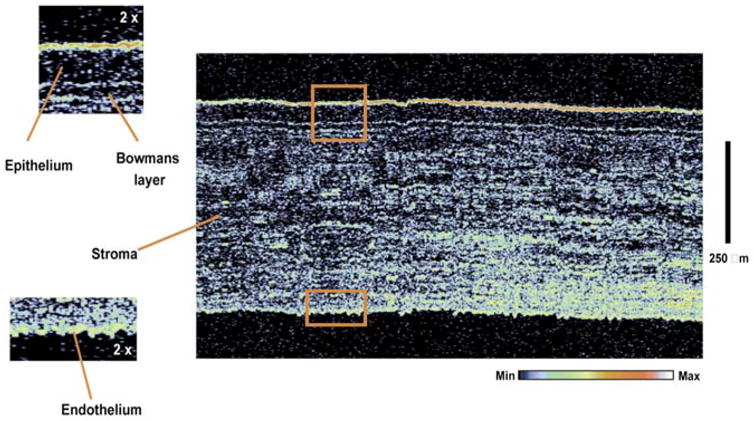
In vivo ultrahigh-resolution corneal OCT image of a normal human subject. The image has 6 × 2 μm (transverse × axial) resolution. The image size is 1.1 × 0.8 mm (transverse × axial) with 600 × 800 pixels, corresponding to 1.8 × 1 μm pixel spacing. The corneal epithelium, Bowman’s layer, intrastromal morphology and endothelium can be visualized. Boxes show enlargement by a factor of two and correspond to matching shapes in large figure.
Discussion
Conventional resolution ophthalmic OCT has enabled the non-invasive, real-time visualization of retinal pathology, and numerous clinical studies have already been performed. Ultrahigh-resolution ophthalmic OCT achieves a significant improvement in performance, enabling imaging of internal retinal and corneal structure, which had previously only been possible with histopathology. In combination with image processing and segmentation techniques, ultrahigh-resolution OCT permits the quantitative measurement of internal retinal architectural morphology, providing a clinical diagnostic tool for diseases such as glaucoma, diabetic retinopathy, and macular degeneration—the three leading causes of blindness. Retinal and choroidal structures are often involved early in disease, but are difficult to resolve with conventional resolution OCT. Ultrahigh-resolution ophthalmologic OCT enables better visualization and quantification of intraretinal structures for more sensitive and earlier diagnosis of ocular pathologies.
Previous studies have examined the correlation of conventional resolution OCT and histology in animals35,36. Correlation with histology was shown, but was challenging because of the small retinal dimensions and limited image resolution35. OCT imaging of fixed in vitro human retina specimens showed discrepancies with histology37 that might be explained by changes in optical properties due to fixation and the highly directional reflectance of the NFL (ref. 38). Because it is not practical to perform one-to-one comparisons of in vivo OCT human retinal imaging with histology, our study subjectively compares OCT images of normal human eyes to textbook histology.
Reproducibility of morphometric measurements is governed by many factors, for example, image resolution, optical properties of retinal layers, variations within the patient population and so forth. However, improving the instrumental image resolution is a critical step in improving the accuracy and diagnostic usefulness of morphometric imaging. A more sensitive and repeatable quantification of the retinal NFL thickness, as well as the ability to quantify the ganglion cell layer, could enable more sensitive glaucoma diagnosis, staging and monitoring. Ultrahigh-resolution OCT should also increase the sensitivity of staging diseases such as macular holes. Early detection and diagnosis of disease, before the onset of visual loss, is important because early treatment can delay or reduce visual impairment.
Ultrahigh-resolution OCT could be a powerful technique for imaging the anterior eye segment. The ability to visualize corneal microstructure in real time could be useful for monitoring and intraoperative control of kerato-refractive surgery. Ultrahigh-resolution OCT could also be used to track disease progression in animal models of disease, providing longitudinal data without the need to sacrifice the animal as in standard biopsy and histopathology.
The ultrahigh-resolution ophthalmologic OCT system reported here is based on a prototype instrument. However, the ultimate availability of this ultrahigh-resolution OCT technology will depend mainly on the availability of lasers or other sources of ultrabroad-bandwidth light. At present, solid-state lasers are still relatively expensive research instruments. With continuing research in laser technology, more compact and less expensive light sources for OCT imaging can be expected in the near future.
In summary, the results presented in this study demonstrate ultrahigh-resolution ophthalmic OCT in normal human subjects with axial resolutions of 3 μm in the retina and 2 μm in the cornea. Intraretinal morphology can be visualized and retinal layers can be identified and quantitatively measured using image-processing algorithms. Ultrahigh-resolution retinal imaging and its ability to measure quantitatively and track changes in morphology should contribute to a better understanding of pathologies and enable increased sensitivity and specificity for early diagnosis and treatment of ocular diseases. Although further basic and clinical studies are necessary, these results suggest that ultra-high-resolution OCT has the potential to be a powerful research and clinical tool in ophthalmology.
Methods
Optical coherence tomography
OCT performs cross-sectional imaging of internal tissue microstructure by measuring the echo time delay of backscattered infrared light using a Michelson interferometer and a low coherence light source6,12–14. One arm of the interferometer directs the light onto the sample and a second reference arm has a retroreflecting mirror that is precisely, mechanically translated. Interference between the light from the sample and reference paths occurs only when the optical distance traveled by the light in both paths matches within its coherence length. The interferometer output is detected and demodulated to measure the echo time delay and magnitude of the backscattered light. By acquiring sequential transverse–axial measurements and removing motion artifacts using cross-correlation algorithms11, the resulting data set is a two-dimensional array representing the optical backscattering in a cross-sectional plane of the tissue. This can be digitally processed and displayed as a gray-scale or false-color image. As OCT is based on fiber optics, the ophthalmic OCT system (Fig. 5) is easily interfaced to a slit-lamp biomicroscope or fundus camera, which relay images the beam into the eye. A pair of computer-controlled mirrors scan the transverse position of the beam on the retina to acquire a tomographic image, which is processed and displayed in real time on a computer. A CCD provides a simultaneous view of the fundus and allows the OCT images to be registered with retinal landmarks or pathology.
Fig. 5.
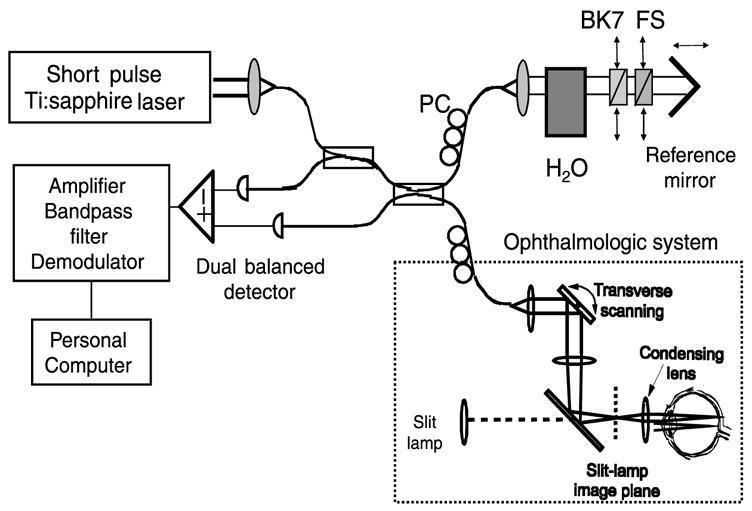
Ultrahigh-resolution ophthalmologic OCT system using a titanium:sapphire laser light source. The interferometer was dispersion balanced (using H2O water; BK7 glass; FS fused silica) and optimized for ultrabroad bandwidths to achieve axial resolutions of 2–3 μm. Polarization paddles (PC polarization controllers) were used to control incident polarization. The system was interfaced to a slit-lamp biomicroscope to permit simultaneous OCT imaging and en face retinal viewing.
Axial and transverse image resolution
OCT can achieve extremely high axial resolution. The axial resolution of OCT is determined by the coherence length (inversely proportional to the bandwidth) of the light source used. Superluminescent diodes (SLD) have been used extensively for OCT imaging systems because they are compact and relatively inexpensive. However, axial resolutions are limited to 10–15 μm. Although incandescent light sources have broad bandwidths and can achieve high resolutions, they do not have sufficient intensity in a single spatial mode for high-speed imaging. Ultrashort pulse laser sources are attractive for OCT because they have very broad spectral bandwidths and high single-mode power. Ultrahigh-resolution ophthalmic OCT imaging was performed using a Ti:Al2O3 laser that generates pulses as short as 5.4 femtoseconds, corresponding to bandwidths of up to 350 nm centered at 800 nm (ref. 25). These ultra-broad bandwidths enable the axial resolution of 2–3 μm, a factor of 4–5 times better than standard, 10–15-μm OCT systems using SLDs. In order to achieve ultrahigh-resolution OCT, the fiber-optic interferometer and optical components were designed to transmit broad optical bandwidths. Special care must be taken to balance optical dispersion in the sample and reference paths of the interferometer because the axial resolution will broaden if there is a significant dispersion mismatch between the paths. Dispersion was balanced by using variable thicknesses of fused silica (FS) and BK7 (Fig. 5). The dispersion of ocular media was compensated using 25-mm water (Fig. 5). For ophthalmic imaging, chromatic aberration in the eye itself appears to pose a fundamental limit to resolution.
The best achievable transverse resolution for OCT is given by the smallest achievable diffraction-limited spot size on the retina, which is in the best case 10 μm (ref. 39). In our system, the transverse spot size is chosen to be approximately 15 μm, to improve the depth of focus and permit imaging through an undilated pupil. This spot size is maintained in the retina; however, scattering in deeper structures such as the RPE and choroid can increase the spot size and degrade transverse resolution40.
Dynamic range and sensitivity
Interferometry has the advantage of measuring the field of the reflected optical signal rather than the intensity. Thus, extremely high dynamic ranges and sensitivities can be achieved. Dual-balanced detection was used to cancel excess amplitude noise that was present in the titanium:sapphire laser to achieve a nearly quantum-limited sensitivity of 95 dB (ref. 11). The sensitivity is defined as the minimum detectable backscattered power compared to the incident power.
Image acquisition time and laser safety
Image acquisition time depends upon the number of transverse pixels. Our prototype system performs axial scans at a rate of 50 Hz, resulting in image acquisition times of 4–12 s for a 200–600 transverse pixel image. Higher axial scanning rates of 100–300 Hz should be possible with future design modifications to reduce the image acquisition time to 1–2 s. As OCT achieves high detection sensitivity, imaging can be performed with extremely low light exposures. In order to reduce the peak intensity of the femtosecond pulses, the beam was coupled into a 100-m length of optical fiber, which dispersively broadened the pulse duration to several hundred picoseconds. As the laser pulse repetition rate was 90 MHz, the individual pulse energies and peak intensities are extremely low and the integrated output is equivalent to a continuous wave-light exposure41. For a broad bandwidth centered at 800 nm, a maximum permissible exposure of 300 μW with illumination time of 27 s for fixed intra-beam viewing is the maximum permissible exposure according to the American National Standards Institute (ANSI) standard, taking ~700 nm as the shortest wavelength. Assuming a scanning beam with 30 consecutive scans, the maximum permissible exposure is 740 μW. Measurements were performed on normal, healthy subjects using a 300 μW incident optical power in a scanned beam, well within the ANSI exposure limits41.
Acknowledgments
We thank S. Bursell, A. Claremont, E. Ippen, C. Pitris, K. Saunders, E. Swanson, J. MacNutt, V.M. Miller, J. Prien, S. Hel and C. Bang. Supported in part by the NIH contract RO1-EY11289-13 and EY11006-04, the Air Force Office of Scientific Research contract F49620-98-1-0139, the Joint Services Electronics Program contract DAAH04-95-1-0038 and the Medical Free Electron Laser Program N00014-97-1-1066. W.D. was supported by the Max Kade Foundation and the Österreichische Akademie der Wissenschaf-ten. U.M. and F.X.K. were supported by the Deutsche Forschungs-gemeinschaft. R.K.G. was supported from the Howard Hughes Medical Institute.
References
- 1.Bamber JC, Tristam M. Diagnostic Ultrasound. In: Webb S, editor. The Physics of Medical Imaging. Adam Hilger; Bristol and Philadelphia: 1988. pp. 319–388. [Google Scholar]
- 2.Pavlin CJ, McWhae JA, McGowan HD, Foster FS. Ultrasound biomicroscopy of anterior segment tumors. Ophthalmology. 1992;99:1220–1228. doi: 10.1016/s0161-6420(92)31820-2. [DOI] [PubMed] [Google Scholar]
- 3.Masters BR, Thaer AA. Real-time scanning slit confocal microscopy of the in vivo human cornea. Appl Opt. 1994;33:695–701. doi: 10.1364/AO.33.000695. [DOI] [PubMed] [Google Scholar]
- 4.Webb RH, Hughes GW, Pomerantzeff O. Flying spot TV ophthalmoscope. Appl Opt. 1980;19:2991–2997. doi: 10.1364/AO.19.002991. [DOI] [PubMed] [Google Scholar]
- 5.Bille JF, Dreher AW, Zinser G. Scanning laser tomography of the living human eye. In: Master BR, editor. Noninvasive Diagnostic Techniques in Ophthalmology. Springer Verlag; New York: 1990. pp. 528–547. [Google Scholar]
- 6.Huang D, et al. Optical coherence tomography. Science. 1991;254:1178–1181. doi: 10.1126/science.1957169. [DOI] [PMC free article] [PubMed] [Google Scholar]
- 7.Puliafito CA, Hee MR, Schuman JS, Fujimoto JG. Optical Coherence Tomography of Ocular Disease. Slack, Thorofare; New Jersey: 1995. [Google Scholar]
- 8.Youngquist RC, Carr S, Davies DEN. Optical coherence domain reflectometry: A new optical evaluation technique. Opt Lett. 1987;12:158–160. doi: 10.1364/ol.12.000158. [DOI] [PubMed] [Google Scholar]
- 9.Takada K, Yokohama I, Chida K, Noda J. New measurement system for fault location in optic waveguide devices based on an interferometric technique. App Opt. 1987;26:1603–1606. doi: 10.1364/AO.26.001603. [DOI] [PubMed] [Google Scholar]
- 10.Fercher AF, Hitzenberger CK, Drexler W, Kamp G, Sattmann H. In vivo optical coherence tomography. Am J Ophthalmol. 1993;116:113–114. doi: 10.1016/s0002-9394(14)71762-3. [DOI] [PubMed] [Google Scholar]
- 11.Swanson EA, et al. In vivo retinal imaging by optical coherence tomography. Opt Lett. 1993;18:1864–1866. doi: 10.1364/ol.18.001864. [DOI] [PubMed] [Google Scholar]
- 12.Fujimoto JG, et al. Optical biopsy and imaging using optical coherence tomography. Nature Med. 1995;1:970–972. doi: 10.1038/nm0995-970. [DOI] [PubMed] [Google Scholar]
- 13.Boppart SA, et al. In vivo cellular optical coherence tomography imaging. Nature Med. 1998;4:861–865. doi: 10.1038/nm0798-861. [DOI] [PubMed] [Google Scholar]
- 14.Tearney GJ, et al. In vivo endoscopic optical biopsy with optical coherence tomography. Science. 1997;276:2037–2039. doi: 10.1126/science.276.5321.2037. [DOI] [PubMed] [Google Scholar]
- 15.Fujimoto JG, Pitris C, Boppart S, Brezinski M. Optical coherence tomography, an emerging technology for biomedical imaging and optical biopsy. Neoplasia. 2000;2:9–25. doi: 10.1038/sj.neo.7900071. [DOI] [PMC free article] [PubMed] [Google Scholar]
- 16.Hee MR, et al. Optical coherence tomography of the human retina. Arch Ophthalmol. 1995;113:325–332. doi: 10.1001/archopht.1995.01100030081025. [DOI] [PubMed] [Google Scholar]
- 17.Hee MR, et al. Topography of diabetic macular edema with optical coherence tomography. Ophthalmology. 1998;105:360–370. doi: 10.1016/s0161-6420(98)93601-6. [DOI] [PMC free article] [PubMed] [Google Scholar]
- 18.Hee MR, et al. Optical coherence tomography of macular holes. Ophthalmology. 1995;102:748–756. doi: 10.1016/s0161-6420(95)30959-1. [DOI] [PubMed] [Google Scholar]
- 19.Hee MR, et al. Optical coherence tomography of age-related macular degeneration and choroidal neovascularization. Ophthalmology. 1996;103:1260–1270. doi: 10.1016/s0161-6420(96)30512-5. [DOI] [PubMed] [Google Scholar]
- 20.Schuman JS, et al. Quantification of nerve fiber layer thickness in normal and glaucomatous eyes using optical coherence tomography. Arch Ophthalmol. 1995;113:586–596. doi: 10.1001/archopht.1995.01100050054031. [DOI] [PubMed] [Google Scholar]
- 21.Schuman JS, et al. Reproducibility of nerve fiber layer thickness measurements using optical coherence tomography. Ophthalmology. 1996;103:1889–1898. doi: 10.1016/s0161-6420(96)30410-7. [DOI] [PMC free article] [PubMed] [Google Scholar]
- 22.Bowd C, Weinreb RN, Williams JM, Zangwill LM. The retinal nerve fiber layer thickness in ocular hypertensive, normal and glaucomatous eyes with optical coherence tomography. Arch Ophthalmol. 2000;118:22–26. doi: 10.1001/archopht.118.1.22. [DOI] [PubMed] [Google Scholar]
- 23.Drexler W, et al. In vivo ultrahigh resolution optical coherence tomography. Opt Lett. 1999;24:1221–1223. doi: 10.1364/ol.24.001221. [DOI] [PubMed] [Google Scholar]
- 24.Morgner U, et al. Spectroscopic optical coherence tomography. Opt Lett. 2000;25:111–113. doi: 10.1364/ol.25.000111. [DOI] [PubMed] [Google Scholar]
- 25.Morgner U, et al. Sub-two-cycle pulses from a Kerr-lens mode-locked Ti:sapphire laser. Opt Lett. 1999;24:411–413. doi: 10.1364/ol.24.000411. [DOI] [PubMed] [Google Scholar]
- 26.Gass JDM. Stereoscopic Atlas of Macular Diseases: Diagnosis and Treatment. Vol. 1. Mosby; St. Louis, Missouri: 1997. Normal macula; pp. 1–49. [Google Scholar]
- 27.Hogan H, Alvarado JA, Wedell JE. Histology of the Human Eye: An Atlas and Textbook. W.B. Saunders; Philadelphia: 1971. pp. 393–522. [Google Scholar]
- 28.Zeimer R, Asrani S, Zou S, Quigley H, Jampel H. Quantitative detection of glaucomatous damage at the posterior pole by retinal thickness mapping. Ophthalmology. 1998;105:224–231. doi: 10.1016/s0161-6420(98)92743-9. [DOI] [PubMed] [Google Scholar]
- 29.Krebs W, Krebs I. Primate Retina and Choroid—Atlas of Fine Structure in Man and Monkey. Springer; New York: 1991. pp. 4–8. [Google Scholar]
- 30.Spalton DJ, Hitchings RA, Hunter PA. Atlas of Clinical Ophthalmology. 2. Mosby; St. Louis, Missouri: 1994. Anatomy of the retina; pp. 13.3–13.9. [Google Scholar]
- 31.Oyster CW. In: The Human Eye — Structure and Function. Oyster CW, editor. Sinauer Associates; Sunderland, Massachusetts: 1999. pp. 660–661. [Google Scholar]
- 32.Ramrattan RS, et al. Morphometric analysis of Bruch’s membrane, the choriocappillaris, and the choroid in aging. Invest Ophthalmol Vis Sci. 1994;35:2857–2864. [PubMed] [Google Scholar]
- 33.Rohen JW. Morphologie und embryologie des sehorgans. In: Francois J, Hollwich F, editors. Augenheilkunde in Klinik und Praxis. Georg Thieme; Stuttgart: 1977. pp. 1.17–1.19. [Google Scholar]
- 34.Marshall J, Heckenlively JR. Pathologic findings and putative mechanisms in retinitis pigmentosa. In: Heckenlively JR, editor. Retinitis Pigmentosa. J.B. Lippincott; Philadelphia: 1988. pp. 37–67. [Google Scholar]
- 35.Toth CA, et al. A comparision of retinal morphology viewed by optical coherence tomography and light microscopy. Arch Ophthalmol. 1997;115:1425–1428. doi: 10.1001/archopht.1997.01100160595012. [DOI] [PubMed] [Google Scholar]
- 36.Huang Y, et al. Relation of optical coherence tomography to microanatomy in normal and rd chickens. Invest Ophthalmol Vis Sci. 1998;39:2405–2416. [PubMed] [Google Scholar]
- 37.Chauhan DS, Marshall J. The interpretation of optical coherence tomography images of the retina. Invest Ophthalmol Vis Sci. 1999;40:2332–2341. [PubMed] [Google Scholar]
- 38.Knighton RW, Huang XR. Optical coherence tomography of retinal nerve fiber layer (e-letter) Invest Ophthalmol Vis Sci. 2000;41 [Google Scholar]
- 39.Howland HC, Howland B. A subjective method for the measurement of monochromatic aberrations of the eye. J Opt Soc Am. 1977;67:1508–1518. doi: 10.1364/josa.67.001508. [DOI] [PubMed] [Google Scholar]
- 40.Thrane L, Yura HT, Andersen PE. Analysis of optical coherence tomography systems based on the extended Huygens-Fresnel principle. J Opt Soc Am A Opt Image Sci Vis. 2000;17:484–490. doi: 10.1364/josaa.17.000484. [DOI] [PubMed] [Google Scholar]
- 41.Safe Use of Lasers, ANSI Z 136.1. American National Standards Institute; New York: 1993. [Google Scholar]