Abstract
For genomewide association (GWA) studies in family-based designs, we propose a novel two-stage strategy that weighs the association P values with the use of independently estimated weights. The association information contained in the family sample is partitioned into two orthogonal components—namely, the between-family information and the within-family information. The between-family component is used in the first (i.e., screening) stage to obtain a relative ranking of all the markers. The within-family component is used in the second (i.e., testing) stage in the framework of the standard family-based association test, and the resulting P values are weighted using the estimated marker ranking from the screening step. The approach is appealing, in that it ensures that all the markers are tested in the testing step and, at the same time, also uses information from the screening step. Through simulation studies, we show that testing all the markers is more powerful than testing only the most promising ones from the screening step, which was the method suggested by Van Steen et al. A comparison with a population-based approach shows that the approach achieves comparable power. In the presence of a reasonable level of population stratification, our approach is only slightly affected in terms of power and, since it is a family-based method, is completely robust to spurious effects. An application to a 100K scan in the Framingham Heart Study illustrates the practical advantages of our approach. The proposed method is of general applicability; it extends to any setting in which prior, independent ranking of hypotheses is available.
Genomewide association (GWA) studies are motivated by the promise of a better understanding of the genetic architecture of complex diseases. So far, successful studies for both relatively rare diseases and complex phenotypes have been conducted. For age-related macular degeneration (AMD)1 and inflammatory bowel disease,2 loci with large genetic effects were detected—for example, an odds ratio of 7.4 for AMD.1 In the field of complex diseases and phenotypes, GWA studies have identified loci for cardiac repolarization (QT interval),3 type 2 diabetes,4 and BMI.5
The association between BMI and the INSIG2 SNP was detected with a recently developed two-stage algorithm6 for family-based association studies. This two-step algorithm applies the two steps—the screening step and the testing step—to the same data set and thereby can establish genomewide significance within one study, minimizing the potential impact of study heterogeneity. In this approach, the association information in the family sample is split into the between-family component and the within-family component. The between-family component is used in the screening step to estimate a relative ranking of the markers. The most promising markers after the screening step are then tested in the testing step.
The two criticisms of the approach in the work of Van Steen et al.6 have been that the screening step can be susceptible to population admixture and stratification and that only a very small number of SNPs (the top 10–20 ranked markers in the screening step) are formally tested for association. Here, we abandon this “top R” approach and allow all genotyped markers to be tested for association in the second step of the testing strategy. Although the top R approach was originally implemented to minimize the multiple-testing problem and to thereby increase the statistical power of the testing strategy, we show that testing all markers in the second stage can be more powerful and can achieve power levels that are in the same range as the power levels of population-based studies. When there is population admixture and stratification, we show that the new approach is robust to spurious effects and that its power is only slightly affected by the degree of stratification. A genomewide scan for height (MIM 606255) in a 100K scan in the Framingham Heart Study (FHS) illustrates the practical advantages of the new approach.
A new algorithm for screening and testing with the use of the same data set.—In the first step of the algorithm—the screening step—we compute, for all genotyped SNPs, the conditional power of the family-based association test (FBAT) statistic on the basis of the estimates obtained from the conditional mean model.7 Since these power estimates are statistically independent of the FBAT statistics that will be computed subsequently, the overall significance level of the algorithm does not need to be adjusted for the screening step.
In the second step of the algorithm—the testing step—the new method tests all the genotyped markers, not just the 10 or 20 SNPs with the highest power ranking tested in the top R approach.6 However, unlike a Bonferroni or false-discovery–rate (FDR) approach, the new method incorporates the extra information obtained in the screening step—that is, the conditional power estimate of the FBAT statistic—so that markers that have a high power ranking are tested at a significance level that is far less stringent than that used in a standard Bonferroni adjustment. This adjustment is made at the expense of the lower-ranked markers, which are tested using more-stringent thresholds. The adjustment follows the intuition that low conditional power estimates imply small genetic effect sizes and/or low allele frequencies, which makes such SNPs less desirable choices for the investment of relatively large parts of the significance level. For SNPs with low power estimates, the evidence against the null hypothesis has to be extremely strong to overthrow the prior evidence against association from the screening step. A similar idea of individually weighting the significance level for each SNP has been proposed by Roeder et al.,8 whereby one uses information from a linkage study to weigh the P values of an association study. More recently, Wasserman and Roeder9 presented a more general method for weighted hypothesis testing that uses either externally or internally estimated weights. Our method follows a similar idea but differs in that we make use of only the marker ranking after the screening step and not the actual power estimates.
Our new procedure ensures that all markers are tested and that, moreover, the overall error is maintained at the desired level. Our approach is applicable either to a familywise error rate or to an FDR. We outline here the approach for the familywise error rate, but the modification for the FDR is straightforward.
More formally, let us assume that m is the total number of markers. After the screening step, all genotyped SNPs are ranked on the basis of their conditional power estimates and are indexed by i=1,2,3,…m, where the index i denotes the power ranking of the SNPs in descending order. In the second step of the algorithm, we test marker i, using the significance cutoff wiα, where w1+w2+…+wm=1, wi⩾0, and α is the genomewide significance level desired—for example, .05. Since the sum of all weights is 1—that is, w1+w2+…+wm=1—the proposed testing strategy will maintain an overall significance level of α. The power of the proposed algorithm will depend on the choice of the weight parameters wi.
There are many possible ways to select the weights. Both the top R and the standard approach based on Bonferroni-adjusted P values are special cases of the testing strategy. The Bonferroni correction does not incorporate the conditional power estimates and assigns equal weights to all markers, wi=1/m for all i. In the top R algorithm, the information from the screening step allows us to favor some markers over others by giving higher weight to markers on the basis of their conditional power estimates—namely, w1=…wR=1/R and wR+1=…wm=0.
Here, we develop a weighting scheme that combines the advantages of both the Bonferroni procedure (e.g., testing all markers) and the original top R approach (e.g., incorporating the additional information about the association at a population level into the testing strategy). To derive optimal weights wi, it is important to keep in mind that, in a GWA study, we are testing a large number of markers. The majority of markers will be noise, and only a few of them are expected to be associated with a phenotype. Consequently, for robustness purposes, we assume that the marker set can be partitioned into a relatively small number of partitions, such that markers that belong to the same partition receive the same weight.
Formally, let K be the number of partitions and ki be the size of the ith partition. Let wi be the weight assigned to this partition. Then, k1+k2+…+kK=m and k1w1+k2w2+…+kKwK=1. Both the Bonferroni procedure and the top R procedure share this “sparse weights” property. The Bonferroni approach can be described by K=1, k1=m, and w1=1/m, whereas the top R approach can be described by K=2, w1=1/R, and w2=0.
For the weighting scheme that we propose here, the number of partitions K will be small as well (K≈10–20). When the ranking of the markers after the screening step is taken into account, the first partitions will be small and will contain the most promising markers, whereas the latter partitions containing the less promising markers will be bigger and bigger, reflecting our greater uncertainty about their association with disease. Formally, the sizes of the partitions (ki) should increase, and the weights (wi) should correspondingly decrease. Although there are many possible weighting functions, the use of exponential weights has theoretical appeal (more details can be found in appendix A).
The exponential weighting scheme.—We denote the size of the first partition by k1. Optimal choices of the first partition size, k1, are derived by simulation studies described below, both in the absence and presence of admixture and stratification. Then, on the basis of k1, the sizes of the consecutive partitions are defined recursively. The size of the second partition is given by k2=2k1, that of the third by k3=2k2, etc. This will result in an exponential distribution for the partition sizes. As the sizes of the partitions increase, the weights (wi) for the adjusted significance levels will decrease exponentially:
 |
With these partition sizes and weights, we have
 |
We discuss the theoretical motivation of these choices of weights and partition sizes in appendix A.
For example, table 1 shows the significance cutoffs (i.e., wiα), dependent on the conditional power ranking, that result when a 100K scan is analyzed and the first partition is assumed to be of size 5 (k1=5). Taking R=20 in the top R approach results in a threshold of .05/20=.0025. The Bonferroni correction gives a threshold of .05/100,000=5×10-7. Although the proposed cutoffs are of the same magnitude as that of the top R approach for the 15 SNPs with the highest conditional power rankings, the proposed test is more conservative than the Bonferroni correction only for SNPs that are not ranked among the 1,275 SNPs with the highest conditional power.
Table 1. .
Exponential Weighting with k1=5
| Rank (⩽) after Screening Step |
wiαa |
| 5 | 5.00×10⁻³ |
| 15 | 1.25b×10−3 |
| 35 | 3.12×10⁻⁴ |
| 75 | 7.81×10⁻⁵ |
| 155 | 1.95×10⁻⁵ |
| 315 | 4.88×10⁻⁶ |
| 635 | 1.22×10⁻⁶ |
| 1,275 | 3.05c×10−7 |
| 2,555 | 7.63×10⁻⁸ |
| 5,115 | 1.90×10⁻⁸ |
| 10,235 | 4.77×10⁻⁹ |
| 20,475 | 1.19×10⁻⁹ |
| 40,955 | 2.98×10⁻¹⁰ |
| 81,915 | 7.45×10⁻¹¹ |
| 100,000 | 1.86×10⁻¹¹ |
The nominal P value is compared against this threshold.
Less stringent than the top 20 method.
More stringent than the Bonferroni correction.
Using simulation studies, we assessed the power and robustness of the proposed testing strategy under various conditions and also compared it with population-based studies with identical numbers of probands. In summary, our simulation results suggest that the new testing strategy outperforms the top R and the Bonferroni-adjustment methods and achieves power levels that are comparable to population-based designs. In the presence of population admixture and confounding, the proposed testing strategy has the advantage of being totally robust to spurious effects.
Power comparisons in the absence of population stratification.—With simulation studies, we compare the proposed testing strategy with the top R approach, Bonferroni adjustment, and population-based analysis. We simulate complete trios, with genotypes at m=100,000 markers. On the basis of the selected allele frequencies, the genotypes of each parent are randomly drawn from a binomial distribution for each marker. The offspring genotype is generated by simulated Mendelian transmission from the parents to the offspring. The first marker is assumed to be the disease-susceptibility locus (DSL) with the disease-allele frequency in the range of 0.1–0.5 and heritability in the range of 0.01–0.05. Using an additive mode of inheritance, we simulate a normally distributed quantitative trait with a locus-specific heritability of h—that is, the percentage of phenotypic variation explained by the DSL SNP.6 The allele frequencies for the random markers are uniformly chosen from [0.1, 0.5].
We report the results for the Bonferroni approach (using the FBAT statistic), the “top 20” approach (top R method with R=20), and the proposed approach, using k1=5 for the size of the first partition. (Note that we compared power results for several values of k1—that is, {5, 10, 100}—and k1=5 provided the most power.) By regressing the quantitative trait on the offspring genotype, we also estimate the power of the corresponding population-based test for the same number of probands.
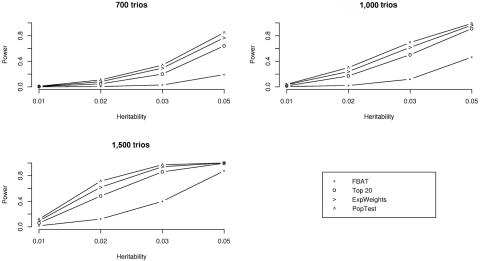
Figure 1 shows the empirical power estimates based on 1,000 replicates in our simulation study, for sample sizes of 700, 1,000, and 1,500 trios. The simulation results suggest that the proposed testing algorithm consistently outperforms both the top R algorithm and the approach based on Bonferroni adjustment. Furthermore, it is noteworthy that the proposed testing algorithm achieves power levels that are very close to those of a population-based analysis with the same number of probands. Since we did not impose any ascertainment condition for the phenotype in the simulation study, the simulation conditions are ideal for the population-based analysis. In the presence of ascertainment, further work is necessary to evaluate the different approaches.
Figure 1. .
Power versus heritability for three sample sizes when there is no population stratification: 700, 1,000, and 1,500 trios. FBAT is the simple Bonferroni method that uses the FBAT statistic, top 20 is the top R method with R=20, ExpWeights is the proposed method that uses the size of the first partition k1=5, and PopTest is the standard population-based test that uses Bonferroni adjustment. Minor-allele frequency at the DSL is 0.3. Other allele frequencies 0.1–0.5 resulted in similar trends and are therefore not shown.
Power comparisons in the presence of population stratification.—To study the power and the robustness of the different approaches in the presence of stratification, we simulate a study population that consists of two distinct subpopulations that differ in terms of both allele frequencies and phenotypic means.
In the simulation study, the trios are assigned to each subpopulation with equal probabilities. The allele frequencies for the random markers for population 1 and population 2 are generated using the Balding-Nichols10 model, as follows. For each marker, an ancestral population–allele frequency p is drawn from a uniform distribution between 0.1 and 0.9. The allele frequencies for each of the two subpopulations are drawn independently from a beta-distribution with parameters p(1-FST)/FST and (1-p)(1-FST)/FST (FST is Wright’s measure of population subdivision).
In addition to differences in allele frequencies at each marker locus, we also simulate different phenotypic means in the two subpopulations, which, in combination with the allele-frequency differences, will result in spurious associations at a population level. Namely, for the random markers in subpopulation 1, we generate the offspring phenotype by drawing from a normal distribution with mean 0 and variance 1. For the families from subpopulation 2, an offset value (δ) is added to the mean of the phenotype distribution. The signal at the DSL is distorted in a similar way.
To examine the impact of this type of confounding on the various approaches, we repeat the simulation studies, using the same sample sizes as in the previous simulation studies. The parameters used in the simulation are as follows. The ancestral-allele frequency at the DSL is fixed at 0.3, and the heritability is 0.05 for the smaller sample sizes of 700 and 1,000 trios and 0.03 for the larger sample size of 1,500 trios. The degree of stratification at the markers is reported on the basis of Wright’s FST={0.001, 0.005, 0.01}. Values of FST on the order of 0.01 are typical of the differentiation between closely related populations.11,12 The offset parameter (δ) is fixed at 0.2.
For a realistic comparison between the family-based methods and the population-based approach, we have to adjust the population-based analysis for admixture and stratification. Various adjustment approaches are available, including genomic-control methods13 and structured association methods.11,14,15 We report results for the population-based analyses that are corrected using the Eigenstrat approach,14 which uses the correlation between the proband’s genotypes to infer continuous axes of genetic variation.
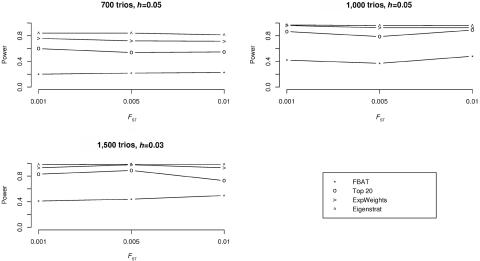
A summary of the results is shown in figure 2. In terms of power, the Eigenstrat-adjusted population-based analysis achieves the highest power levels, followed by the proposed testing strategy, whose power levels are only slightly smaller. Similar to the case of no confounding, the proposed testing strategy outperforms the top R approach and the Bonferroni approach. At the same time, the results of our simulation study show that the power of all three family-based approaches is only slightly influenced by the increasing degrees of admixture (fig. 2). The negligible dependence of the power estimates on the degree of admixture can be explained by the fact that the ranking of the disease locus is only slightly affected by the increase in confounding and also by the fact that our weighting scheme is robust to such small alterations in the ranking.
Figure 2. .
Power versus FST for three sample sizes with population stratification: 700, 1,000, and 1,500 trios. FBAT is the simple Bonferroni method that uses the FBAT statistic, top 20 is the top R method with R=20, ExpWeights is the proposed method that uses the size of the first partition k1=5, and Eigenstrat is the population-based test that uses Eigenstrat adjustment.
FHS data analysis.—To illustrate the practical relevance of the proposed testing strategy, we applied the approach to a 100K scan, using the National Heart, Lung, and Blood Institute (NHLBI) FHS data set. The participants in the FHS are a longitudinal, community-based sample free of any selection criteria for a particular trait or disease and have been followed for >24 years. We used a subsample of the FHS (FHS offspring cohort) consisting of 923 participants who were genotyped for 116,204 SNPs and have phenotypic measures from up to six exam visits. Using this data set, we performed a GWA analysis for stature (i.e., height in inches).
In general, we closely followed the methodology presented in the work of Herbert et al.5 while extending the top R algorithm to accommodate the improved weighting scheme presented here. For the GWA analysis of stature, the details of the procedure are as follows: (1) Using the between-family information, we combined the longitudinal measures of height into one univariate phenotype, using the FBAT–principal components (PC) approach, which maximizes the heritability of the aggregate phenotype.16 (2) We then derived conditional power estimates for each SNP-phenotype combination. (3) Each SNP-phenotype combination was then ranked on the basis of its conditional power, and the proposed weighting scheme (k1=5) was applied to each of the within-family (i.e., FBAT) tests generated. Since stature is predicted by age and sex, we used these two parameters as covariates in the analysis.
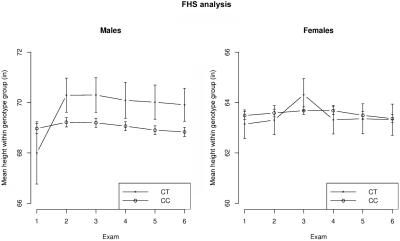
We identified SNP rs10514619 with a nominal FBAT-PC P value of .0047; this SNP was ranked second (according to conditional power) in the screening step. Since .0047<.005 (table 1), this SNP is genomewide significant at the .05 level with use of the proposed weighting approach, but it fails to reach significance with use of the top R method (with R=20), since .0047>.05/20. This SNP maps to 16q24.1 within the protein-coding locus LOC729979 found only in libraries from testis (National Center for Biotechnology Information). Interestingly, a sex-specific subgroup analysis suggests that males are primarily responsible for the observed association signal (see fig. 3).
Figure 3. .
Profile plots of the mean height (±SE) across six exams within the rs10514619 genotype group. The minor-allele frequency at the SNP is 0.03.
Discussion.—In this report, we propose a powerful two-stage approach in family-based association studies. Our approach is appealing, in that it allows testing of all the genotyped markers but also uses the available extra information from the screening step. The proposed concept is of general applicability; it extends to any setting in which prior, independent ranking of hypotheses is available.
In the absence of admixture and stratification, our simulation studies show that our approach achieves increases in power over both the standard family-based approach and the top R procedure and has almost the same power levels as population-based methods with the same number of probands. Moreover, in the presence of a reasonable level of stratification likely to be seen in practice, the power of our approach is only slightly affected by the degree of confounding. Since it is a family-based test, our approach also maintains complete robustness to spurious effects.
Genetic association findings with complex phenotypes are known to be difficult to replicate and, consequently, require time-consuming and costly efforts. However, the main purpose of GWA studies is the discovery of new associations, which we hope will foster the identification of novel disease genes. To accelerate this process, there are two key requirements for the statistical analysis: (1) optimal use of the total association information in the sample, to avoid missing an important genetic association, and (2) minimal number of false-positive results, to avoid unnecessary, expensive, and time-consuming follow-up efforts. The testing strategy proposed here provides both.
Acknowledgments
We thank two referees for very helpful comments on an earlier draft of this report. This research was supported by National Institute of Mental Health grants R01-MH063445 and R01-MH59532. The FHS was conducted and supported by the NHLBI in collaboration with Boston University. This manuscript was not prepared in collaboration with investigators of the FHS and does not necessarily reflect the opinions or views of the FHS, Boston University, or NHLBI.
Appendix A
We can get more insight into the proposed method by looking at the distribution of the DSL rank after the screening step as a function of the true underlying effect and the number of markers tested.
In the conditional mean model, the effect size for marker k is estimated using
where Y represents the offspring’s coded phenotype, and Xk denotes the offspring’s coded genotype at locus k. Let  be the estimated effect size.
We can now compute P(DSLisranked kth). (To keep the computations simple, we assume that the m markers are all independent.)
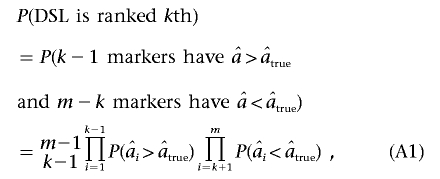 |
where  is the estimated effect size of the DSL.
Lange and Laird17 showed that
 |
where pi is the allele frequency of the ith ranked marker. For a large number of trios n and, for the sake of simplicity, with the assumption that all markers have equal frequencies p,
 |
Hence, equation (A1) can be rewritten as
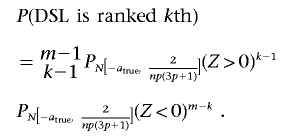 |
Let
In other words, Ptrue is the probability that the DSL has an estimated effect higher than that of a random marker. Then,
 |
Then, we have
Hence, the value of Ptrue (which depends on the genetic effect at the true disease locus) and the number of markers tested determine the distribution over the possible rankings for the DSL after the screening step (fig. A1). Unfortunately, we do not know the value of Ptrue. However, we can assume a distribution over the values of Ptrue. In this case, selecting the top K SNPs (where K is a small number—say, 10–20) corresponds to the assumption that Ptrue follows a Dirac delta-distribution, with the entire probability mass at a value very close to 1 (see fig. A1). The simple (unweighted) Bonferroni correction corresponds to the assumption that Ptrue∼U(0,1). The method we propose here falls in between these two extremes. Namely, we assume that Ptrue has an exponential distribution. In this case, the probability that a DSL is ranked kth will decrease exponentially as well. Indeed,
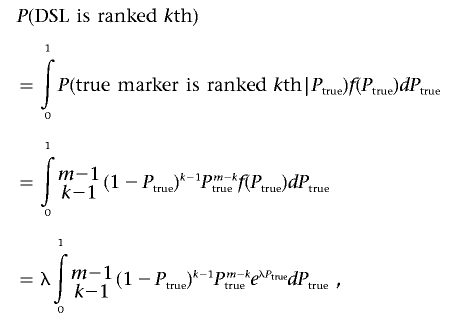 |
with λ>0. This function is exponentially decreasing with increasing k. Roughly, one can think of the integral above as a weighted average of eλPtrue with weights P(DSLisranked kth|Ptrue). For each value of k, there is only a small range of values for Ptrue that ensure a positive value for the weights, with the range of values becoming larger as k increases (as shown in fig. A1 by the increasing overlap among the distributions as k increases). This means that, for small values of k, the integral is proportional to eλP with P close to 1, whereas, for large values of k, the integral is proportional to eλP with a small P. This shows the exponential decrease of the rank distribution with increasing rank.
Figure A1. .
Distribution of the rank for the DSL as a function of its Ptrue (m=10,000)
Web Resource
The URL for data presented herein is as follows:
- Online Mendelian Inheritance in Man (OMIM), http://www.ncbi.nlm.nih.gov/Omim/ (for height) [PubMed]
References
- 1.Klein RJ, Zeiss C, Chew EY, Tsai JY, Sackler RS, Haynes C, Henning AK, SanGiovanni JP, Mane SM, Mayne ST, et al (2005) Complement factor H polymorphism in age-related macular degeneration. Science 308:385–389 10.1126/science.1109557 [DOI] [PMC free article] [PubMed] [Google Scholar]
- 2.Duerr RH, Taylor KD, Brant SR, Rioux JD, Silverberg MS, Daly MJ, Steinhart AH, Abraham C, Regueiro M, Griffiths A, et al (2006) A genome-wide association study identifies IL23R as an inflammatory bowel disease gene. Science 314:1461–1463 10.1126/science.1135245 [DOI] [PMC free article] [PubMed] [Google Scholar]
- 3.Arking DE, Pfeufer A, Post W, Kao WH, Newton-Cheh C, Ikeda M, West K, Kashuk C, Akyol M, Perz S, et al (2006) A common genetic variant in the NOS1 regulator NOS1AP modulates cardiac repolarization. Nat Genet 38:644–651 10.1038/ng1790 [DOI] [PubMed] [Google Scholar]
- 4.Sladek R, Rocheleau G, Rung J, Dina C, Shen L, Serre D, Boutin P, Vincent D, Belisle A, Hadjadj S, et al (2007) A genome-wide association study identifies novel risk loci for type 2 diabetes. Nature 445:881–885 10.1038/nature05616 [DOI] [PubMed] [Google Scholar]
- 5.Herbert A, Gerry NP, McQueen MB, Heid IM, Pfeufer A, Illig T, Wichmann HE, Meitinger T, Hunter D, Hu FB, et al (2006) A common genetic variant is associated with adult and childhood obesity. Science 312:279–283 10.1126/science.1124779 [DOI] [PubMed] [Google Scholar]
- 6.Van Steen K, McQueen MB, Herbert A, Raby B, Lyon H, Demeo DL, Murphy A, Su J, Datta S, Rosenow C, et al (2005) Genomic screening and replication using the same data set in family-based association testing. Nat Genet 37:683–691 10.1038/ng1582 [DOI] [PubMed] [Google Scholar]
- 7.Lange C, DeMeo D, Silverman EK, Weiss ST, Laird NM (2003) Using the noninformative families in family-based association tests: a powerful new testing strategy. Am J Hum Genet 73:801–811 [DOI] [PMC free article] [PubMed] [Google Scholar]
- 8.Roeder K, Bacanu SA, Wasserman L, Devlin B (2006) Using linkage genome scans to improve power of association in genome scans. Am J Hum Genet 78:243–252 [DOI] [PMC free article] [PubMed] [Google Scholar]
- 9.Wasserman L, Roeder K (2006) Weighted hypothesis testing. (http://arxiv.org/abs/math.ST/0604172) (accessed July 5, 2007)
- 10.Balding DJ, Nichols RA (1995) A method for quantifying differentiation between populations at multi-allelic loci and its implications for investigating identity and paternity. Genetica 96:3–12 10.1007/BF01441146 [DOI] [PubMed] [Google Scholar]
- 11.Pritchard JK, Donnelly P (2001) Case-control studies of association in structured or admixed populations. Theor Popul Biol 60:227–237 10.1006/tpbi.2001.1543 [DOI] [PubMed] [Google Scholar]
- 12.Nicholson G, Smith AV, Jónsson F, Gústafsson Ó, Stefánsson K, Donnelly P (2002) Assessing population differentiation and isolation from single-nucleotide polymorphism data. J R Statist Soc B 64:695–715 10.1111/1467-9868.00357 [DOI] [Google Scholar]
- 13.Devlin B, Roeder K (1999) Genomic control for association studies. Biometrics 55:997–1004 10.1111/j.0006-341X.1999.00997.x [DOI] [PubMed] [Google Scholar]
- 14.Price AL, Patterson NJ, Plenge RM, Weinblatt ME, Shadick NA, Reich D (2006) Principal components analysis corrects for stratification in genome-wide association studies. Nat Genet 38:904–909 10.1038/ng1847 [DOI] [PubMed] [Google Scholar]
- 15.Epstein MP, Allen AS, Satten GA (2007) A simple and improved correction for population stratification in case-control studies. Am J Hum Genet 80:921–930 [DOI] [PMC free article] [PubMed] [Google Scholar]
- 16.Lange C, Van Steen K, Andrew T, Lyon H, DeMeo DL, Raby B, Murphy A, Silverman EK, MacGregor A, Weiss ST, et al (2004) A family-based association test for repeatedly measured quantitative traits adjusting for unknown environmental and/or polygenic effects. Stat Appl Genet Mol Biol 3:Article17 [DOI] [PubMed] [Google Scholar]
- 17.Lange C, Laird NM (2002) On a general class of conditional tests for family-based association studies in genetics: the asymptotic distribution, the conditional power, and optimality considerations. Genet Epidemiol 23:165–180 10.1002/gepi.209 [DOI] [PubMed] [Google Scholar]


